With most of us focusing so much on the weather in our hometown, it can be easy to forget that a local weather event can exert global influence. But given recent events in New York City and Panama, it appears that Mother Nature has been trying to reinforce that point.
The post-Christmas snowstorm that hammered much of the eastern United States produced chaos for travelers in a number of states, but it was the 20 inches that fell in New York City that had the farthest reaching impact. The closure of all three NYC metro airports caused a ripple effect that spread across the country and throughout other parts of the world. Not only were throngs of holiday travelers stranded at terminals in New York, but more than 5,000 domestic flights–as well as many in other countries–were canceled and countless more were backed up for days while waiting for LaGuardia, JFK, and Newark airports to get up and running. So, for example, more than 200 flights were canceled at Chicago’s O’Hare and Midway airports solely because of the East Coast snow, disrupting the plans of thousands of travelers even though the blizzard was hundreds of miles to the east.
(Aside 1: What could be a better use of your time when stuck in a snowstorm than this cool time-lapse video shot during the blizzard in the New Jersey shore town of Belmar…)
(Aside 2: There’s that old meteorologists’ adage, “Nobody lives at the Airport”, which happens to be the title of Larry Heitkemper’s presentation at our Seattle meeting, Wednesday 26 January. Heitkemper discusses how to transform official airport observations into data relevant to energy demand where people actually live; apparently, however, when blizzards strike far too many people really do live at the airport.)
Meanwhile, heavy rains last month in Panama forced the Panama Canal to close for just the third time in its 96-year history. Torrential rainfall inundated parts of Central and South America throughout November and early December. Two artificial lakes (Gatun and Alhajuela) in Panama that flow into the canal rose to record-high levels, forcing the canal to close for 17 hours so that one of the lakes could be drained. While the closing was short-lived, the global effects were still significant. About 5% of all international trade utilizes the canal, with approximately 40 ships winding through its 48 miles each day. While sections of the canal have been blocked at times, it was the first time the entire canal was closed since the United States invaded Panama in 1989. The only other closures were caused by landslides in 1915 and 1916, not long after it first opened.
 Matt
Matt
Say It Ain't Snow, Santa
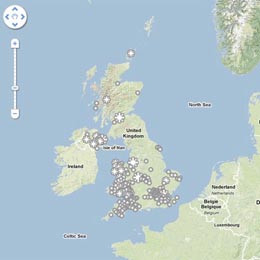
Is it possible that dreaming of a white Christmas can backfire? Parts of the United Kingdom may find out over the next week if bitter cold temperatures and heavy snowfall continues. The conditions–which also have included gale-force winds at times–are getting so severe that officials are warning that many packages may not be delivered in time for them to be opened on Christmas morning, creating the possibility that Santa may not be arriving (on time) this year. Heavy snow predicted for the weekend has already started in many locations, and severe weather warnings have been given for a number of areas. (The UK Met Office has been tracking the snowfall on an interactive map on their website.)
Temperatures consistently below 0°C have been chilling the region for weeks, with The Weather Outlook forecaster Brian Gaze calling the cold spell “a once-in-a-lifetime event.” Snow and ice on roads, runways, and rails have created travel headaches, with the next week likely to be even worse. But no one’s travel is as important as St. Nick’s, and at this point the forecasts are not favorable.
“This year in Scotland and the northeast [England] it is likely that Father Christmas won’t be coming,” said Simon Veale, director of the delivery company Global Freight Solutions, in a statement certain to shock children throughout the United Kingdom.
The current scene is evoking comparisons to perhaps the U.K.’s most famous holiday weather event, the 1927 Christmas Blizzard that left 20-foot snowdrifts in some locations.
A Good Climate for Looking at Clouds
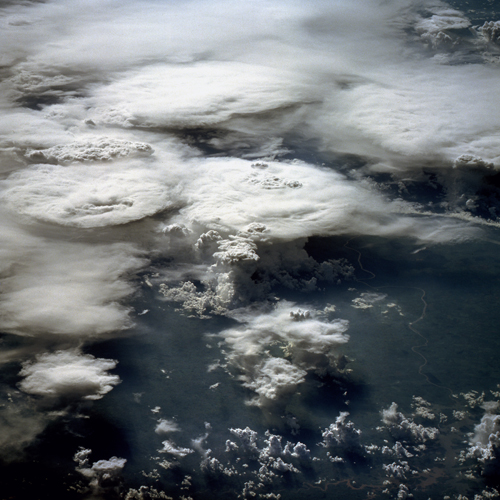
How much do we know about clouds and the effects they have on climate change? It’s a lingering source of uncertainty, with as many questions as answers. No wonder the National Science Foundation calls them “The Wild Card of Climate Change” on its new website about the effect of clouds in climate.
The site is good place to start thinking about this complicated issue. The NSF page features videos of cloud experts like David Randall of Colorado State University and AMS President Peggy LeMone of NCAR, as well as a slide show, animations, articles, and other educational material that address some of most salient cloud/climate questions, such as: Will clouds help speed or slow climate change? Why is cloud behavior so difficult to predict? And how are scientists learning to project the behavior of clouds?
The impression one gets from the website about the progress of the science in this area may vary depending on your point of view, but Randall, for one, sounds about as optimistic as you can get. In his video, he admits that optimism is a job requirement for climate modelers, but in his assessment, “We’re not in the infant stages of understanding [clouds] any more; we’re in first or second grade, and on the way to adolescence.” His hope for solving their role in climate and representing cloud effects in climate modeling rests in part on better computers and in part on the numerous bright people entering the field now, ready to overshadow the work of their mentors.
The AMS Annual Meeting in Seattle will be a good occasion to dig deeper at the roots of Randall’s optimism and sample some of the emerging solutions to the cloud/climate relationship. For example, Andrei Sokolov and Erwan Monier of MIT will discuss the influence that adjusting cloud feedback has on climate sensitivity (Wednesday, 26 January, 11:30 a.m. in Climate Variability and Change). Basically, they’re using small adjustments to the cloud cover used to calculate surface radiation in a model to create a suite of results–an ensemble. The range of results better reflects the sensitivity of climate observed in the 20th century better than some other methods of creating ensembles, such as adjusting the model physics.
Randall says in his video that early predictions about climate change are already coming to pass and this leads to optimism that more predictions will verify well in the coming years as we scrutinize climate more and more closely. This of course presupposes sustained efforts to observe and verify. Laying the groundwork for this task–and for thus better climate models–are Stuart Evans (University of Washington) and colleagues in a study they are presenting in Seattle. According to their abstract, “Improving cloud parameterizations in large scale models hinges on understanding the statistical connection between large scale dynamics and the cloud fields they produce.” Their study focuses on the relationship between synoptic-scale dynamic patterns and cloud properties (Monday, 24 January, 11 a.m. in Climate Variability and Change). Evans et al. dig through 13 years of cloud vertical radar profiles from the US Southern Plains site of the DOE ARM program and relate it to atmospheric “states”, thus providing a metric for evaluating how well climate models relate cloudiness to radiation and other surface properties.
While Evans and colleagues use upward looking remote sensing, Joao Teixeira (JPL/Cal Tech) and coauthors look down at boundary layer cloudiness from above–using satellites. They expect to show how new methodologies with satellite data can improve the way low level clouds are parameterized in climate models (Thursday, 27 January, 9:30 a.m., in Climate Variability and Change). A recent workshop at Cal Tech on space-based studies of this problem stated:
Clouds in the boundary layer, the lowermost region of the atmosphere adjacent to the Earth’s surface, are known to play the key role in climate feedbacks that lead to these large uncertainties. Yet current climate models remain far from realistically representing the cloudy boundary layer, as they are limited by the inability to adequately represent the small-scale physical processes associated with turbulence, convection and clouds.
The lack of realism of the models at this low level is compounded by the lack of global observing of what goes on underneath the critical low-level cloud cover–hence the effort of Teixeira et al. (and others) to “leverage” satellite observing, with its global reach, to improve understanding of low level thermodynamics in the name of improving climate simulations.
Kermit Would Approve
It’s not easy being green, as Kermit the Frog famously lamented on the TV show, “Sesame Street,” but it might be getting easier thanks in part to the Tungara frog—a native of Central and South America. David Wendell of the University of Cincinnati recently led a study that developed a new type of foam that can absorb CO2 and convert it to sugar before it escapes into the atmosphere (a process that occurs naturally in plants during photosynthesis). A key ingredient in the foam, which could be placed into the exhaust systems of power plants, is a protein that is naturally created by the Tungara frog to form a foam nest that protects their eggs. (Here’s a brief video showing a frog weaving the nest.) 
“I read about a protein that the frog uses that allows bubbles to form in the nest, but doesn’t destroy the lipid membranes of the eggs that the females lay in the foam, and realized that it was perfect for our own foam,” says Wendell. The CO2-absorbing foam is an amalgam of numerous enzymes harvested from plants, fungi, bacteria, and frogs, and it converts all of the solar energy it captures into sugars, making it as much as five times more efficient than plants, and, according to Wendell, “the first technology that actually consumes more carbon than it generates.” The invention recently won the $50,000 grand prize at the 2010 Earth Awards, which were founded in 2007 to encourage innovative designs “to improve our quality of life and build a new economy.”
Up, Up, and Away!
When seven-year-old Max Geissbühler wanted to make a homemade spacecraft, his father, Luke, was skeptical that it could be done. But with further investigation (and further lobbying from Max), they realized that a simple weather balloon combined with some modern technology would allow them to not only create a workable “spacecraft,” but make a video of its flight, as well, tracking its movement as it ascended 19 miles into the upper stratosphere.
The father-and-son team created a small capsule out of a fast-food container that they sprayed with insulation. They put a camera and an iPhone into the container and protected them from cold temperatures they would encounter with chemical hand-warming packets. Then they filled the balloon with helium, attached it to the capsule, and launched it from the town of Newburgh, New York. Its rapid ascent at 25 feet per second brought it through 100-mph winds to a maximum height of about 100,000 feet before the balloon burst, approximately 70 minutes after it was launched. A parachute attached to the capsule brought it back to ground only about 30 miles from its launch site; they found it thanks to a GPS application on the iPhone. Both the phone and camera were intact, and the camera recorded all but the last couple minutes of the flight.
Homemade Spacecraft from Luke Geissbuhler on Vimeo.
The remarkable video that resulted has been a hit at video-sharing sites like Vimeo, where it has been viewed more than 3.7 million times in just one month. A website about the balloon project and possible future endeavors can be found here.
Air Quality Monitoring Gets Smart
Smartphones continue to get more popular and, well, smarter, making them ideal for large-scale data-gathering projects. The concept is called crowdsourcing, and there are an increasing number of benefits that a large group of people with smartphones and other mobile devices could provide.
Case in point: Researchers at the University of Southern California have created an application for Android phones (an iPhone app is in development) that they hope will enhance air pollution monitoring. The “Visibility” app allows the public to send pictures they take of the sky to a central database, where the pollution levels for the pictures’ locations can be estimated and recorded. 
As long as the picture is predominantly of the sky and taken on a sunny day, the app can compare it to accepted models of the luminance of the sky for that location. This provides an estimate of visibility, which in turn helps in calculating the amount of certain types of aerosols in the atmosphere. With the help of some of the phone’s features–such as its accelerometer, compass, and GPS–the app can calculate the orientation of the camera and the sun and the time the picture was taken and send that information and the actual picture to a computer, which then estimates the pollution level for the area shown in the picture. The application sends this data back to the picture-taker while simultaneously recording it in a database. (A paper on the research is available here.)
More than 250 people downloaded the app in the first three days it was available. The app has already shown promising results in both Phoenix and the Los Angeles basin when the photo-derived observations are compared to air quality data collected by the EPA. With air pollution monitoring currently limited to sparse distribution of monitor stations, the potential exists for this new app and its successors to change the way we monitor the sky.
The app’s developers hope that its popularity continues to increase, which would help them to refine and update its performance. So if you’re reading this on your smartphone, here’s an opportunity to collect some air quality data of your own.
A Slow Start, but Gaining Fast
Tropical Storm Lisa became the 12th named storm in the Atlantic Basin this week in what has suddenly become the active 2010 hurricane season that forecasters months ago had predicted. Nine of those twelve storms formed since August 21, with five of them becoming hurricanes. Before that, only one of the first three named storms (Alex) even reached hurricane strength. By contrast, 2005 (9 out of 28) and 2008 (6 out of 16) both had numerous storms form before August 20. Why the delay this year? According to a story in Newscientist.com, a mass of hot, dry air over the oceans stunted the formation of tropical storms. Scientists traced this dry air to a massive ridge of high pressure that sat for months over Europe and Asia, causing an intense heatwave in Russia and severe monsoon rains in Pakistan this summer that killed thousands of people. But just as mid-August arrived, when the typical height of Atlantic hurricane activity is imminent, things changed. As the Weather Underground’s Jeff Masters wrote in his blog on August 17:
Vertical instability, which was unusually low since late July, has now returned to near normal levels over the tropical Atlantic, though it remains quite low over the rest of the North Atlantic. Instability is measured as the difference in temperature between the surface and the top of the troposphere (the highest altitude that thunderstorm tops can penetrate to). If the surface is very warm and the top of the troposphere is cold, an unstable atmosphere results, which helps to enhance thunderstorm updrafts and promotes hurricane development. Since SSTs in the Atlantic were at record highs and upper tropospheric temperatures were several degrees cooler than average in July, enhancing instability, something else must have been going on to reduce instability. Dry air can act to reduce instability, and it appears that an unusually dry atmosphere, due to large-scale sinking over the Atlantic, was responsible for the lack of instability.
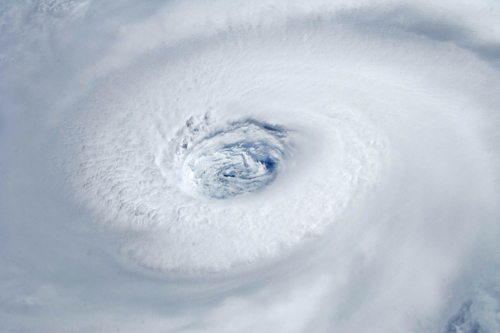
Not until the heat wave broke near the end of August did the tropical storms really begin to form in earnest, with four storms (Danielle, Earl, Fiona, and Gaston) arising just between August 21 and September 1. And spurred by those record-high SSTs mentioned by Masters, the 2010 season has not only produced 12 named storms and 6 hurricanes, but 5 major hurricanes–four of them Category 4–making that slow start seem like a distant memory. To put this season in historical perspective, there have been yearly averages of 14 named storms, 8 hurricanes, and 4 major hurricanes since the current active Atlantic hurricane period began in 1995. This season is just one major hurricane away from moving into a 7-way tie for 3rd-most major hurricanes in a season, topped only by the 7 major hurricanes in 1961 and 2005 and 8 in 1950 (lists of most active seasons in various categories can be found here).
The Reality of Weather in Fantasy Sports
When it comes to playing fantasy sports, every advantage counts. For fantasy baseball player Andy Rice– an avid storm chaser and a software product manager for Weather Central, a weather services company (and AMS corporate member) based in Madison, Wisconsin–familiarity with weather data allows him to create statistical analyses of player performance in various weather conditions. For example, as he explains in this interview, major league hitters perform better in hot conditions than in cold, with a league-wide 2009 batting average of .271 when temperatures were in the 80s and .274 when they were in the 90s, compared with just .250 when temps were in the 30s. 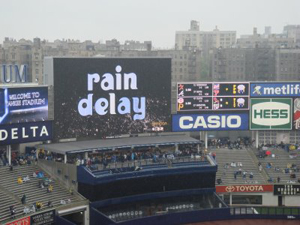
He also noted that rainouts–the nuisance of players, fans, and fantasy participants alike–are not nearly as common as they seem to be, although rain delays occur more frequently, which can be valuable information for fantasy players setting their daily lineups:
There are usually somewhere between 25-45 games postponed due to weather out of 2,700 games played per year. That’s 1-2%, so it’s kind of funny when I see people getting so concerned about it in the chat room. Rain Delays are a different story and happen more frequently. Their impact is mainly on the starting pitcher, since they tend to get pulled after a lengthy delay.
Similar to forecasting the weather, putting together a fantasy team largely depends on determining probabilities based on an evaluation of conditions–and also having realistic expectations:
In these daily leagues you know that not all of your players are going to have an amazing day, but if your pitcher wins and you get 3 or 4 hitters that have a good day, you have a really good chance of winning. So you need to give yourself a team of batters with an increased probability of having a big day and hope a few hit. If I have two players that I view equally, and one has a chance of steady rain for a few hours during the game, the probability of having a good day goes down and I’ll probably pick the guy playing in the dome.
They Still Make Them Like They Used To
This summer, the Catlin Arctic Survey team became the first explorers to ever take ocean water samples at the North Pole. The three-person team covered 500 miles over 2 1/2 months in their expedition across sea ice off the coast of Greenland. On the way they were met with numerous obstacles: a persistent southerly drift that regularly pushed them backward, strong headwinds, ice cracks opening under their tent, dangerously thin ice, and areas of open water they had to swim across.
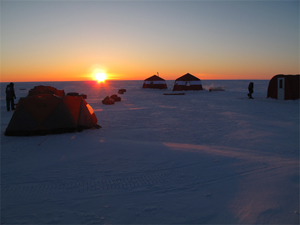
They persisted through it all, measuring ice thickness, drilling ice cores, and collecting water samples (see the video below) and plankton data. They hope their research will provide insight into the effects of carbon dioxide on local marine life and Arctic Ocean acidification.
The heartiness of the Catlin team reminds us of the rich history of polar exploration in the name of meteorology. Historian Roger Turner of the University of Pennsylvania gave a fascinating presentation at the AMS Annual Meeting in Atlanta about the origins of the tradition, spotlighting the group of young Scandinavian meteorologists who studied under Vilhelm Bjerknes in Bergen, Norway. They were vital contributors to numerous Arctic expeditions in the 1920s.
This first wave of Bergen School meteorologists was well-suited to polar exploration, where they contributed their familiarity with the Far North conditions as well as their new understanding of upper-air dynamics. But Turner argues that their affinity for outdoors activities–particularly in the harsh conditions of the Arctic–also set them apart from others in their generation and, by implication, from the desk-bound meteorologists today.
We think those hardy meteorological pioneers of yesteryear would appreciate the intrepid scientific spirit of the Catlin team.
New Partnership
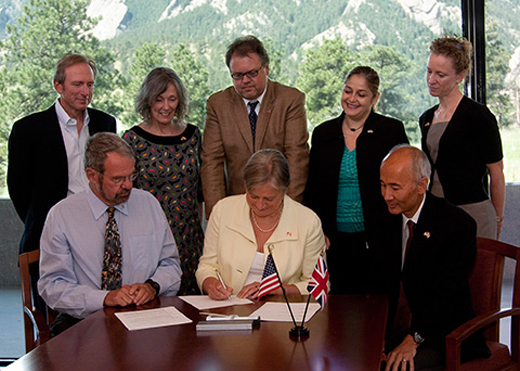
Recognizing the need for greater cooperation in understanding and predicting weather and climate, the U.K. Met Office and NCAR recently signed an agreement to conduct joint research. While many scientists from the two organizations already work together individually, the new arrangement encourages the merging of observing and field programs and facilitates the sharing of insights related to modeling, software engineering, and instrument creation. Specific research that the agreement promotes includes fundamental atmospheric processes, particularly related to the planetary boundary layer; upper-ocean processes and short-term upper ocean-atmosphere interactions in weather and climate prediction; next-generation modeling for massively parallel computing architectures; predictability of the climate system on seasonal-to-decadal timescales; and real-time attribution of hazardous weather and climate extremes to human influences.
