When UAS Flock Together

All the research ships and aircraft of atmospheric science may never be able to gather in one place for testing. But small, portable unmanned aircraft systems (UAS) are another matter. An international vanguard of scientists developing these atmospheric observing capabilities is finding that it is really helpful to get together to pool their insights—and devices—to accelerate each other’s progress. Together, their technology is taking off.

In the May 2020 BAMS, Gijs de Boer (CIRES and NOAA) and colleagues overview one of these coordinate-and-compare campaigns: when 10 teams from around the world brought 34 UAS to Colorado’s San Luis Valley for a week of tests, laying groundwork for new collaborations and future field programs. The July 2018 flight-fest conducted 1,300 research flights totaling more than 250 flight hours focused on observing the intricacies of the lower atmosphere.

Dubbed the LAPSE-RATE campaign—Lower Atmospheric Profiling Studies at Elevation–A Remotely-Piloted Aircraft Team Experiment—it was one of the fruits of a new community of scientists, the International Society for Atmospheric Research Using Remotely-Piloted Aircraft (ISARRA).
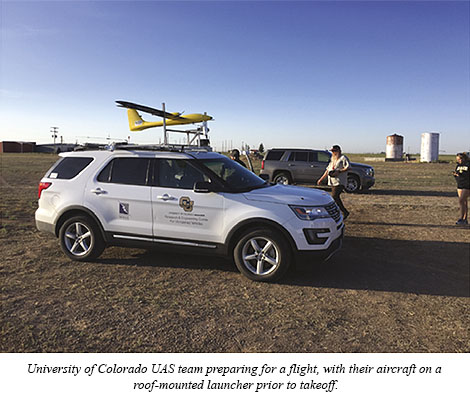
UAV_launch_ready2At a “Community Day,” the scientists shared their aircraft and interests with the public as well. Working together all in one place has huge benefits. The teams get to see how they compare with each other, work out the kinks with their UAS, and move faster toward their research goals. It’s one reason they are getting so good so fast.

Below, de Boer answers some questions about the campaign and how he got started with UAS.

BAMS: What are some of the shared problems revealed by working together—as in LAPSE-RATE—with other UAS teams?
Gijs de Boer: There are common problems at a variety of levels.  For example, accurate wind sensing has proven challenging, and we’ve definitely worked together to improve wind estimation. Additionally, different modes of operation, understanding which sensors are good and which are not, and sensor placement are all examples of how the community has worked together to lift up the quality of measurements from all platforms.

BAMSWhat are the most surprising lessons from LAPSE-RATE?
GdB: I think that the continued rapid progression of the technology and the innovation in UAS-based atmospheric research is impressive.  Some of the tools deployed during LAPSE-RATE in 2018 have already been significantly improved upon.

BAMS: What are some examples of this more recent UAS improvement?
GdB: Everything continues to get smaller and lighter.  Aircraft have become even more reliable, and instrumentation has continued to be scrutinized to improve data quality.  Battery technology has also continued to improve, allowing for longer flight times and more complex missions.

Yet, we have so much more to do with respect to integrating our measurements into mainstream atmospheric research.

BAMS: What are some challenges to doing more to integrate UAS into research?
GdB: Primarily, our UAV research community is working to demonstrate the reliability and accuracy of our measurements and platforms.  This is critical to having them accepted in the community.  There are also some other challenges associated with airspace access and development of infrastructure to interface these observations in both mainstream research and operations.

BAMS: It seems like there’s been success in this mainstreamed usage of UAS.
GdB: Campaigns like LAPSE-RATE have paved the way for UAS to be more thoroughly included in larger field campaigns.  A nice example is the recent ATOMIC (Atlantic Tradewind Ocean–Atmosphere Mesoscale Interaction Campaign) and EUREC4A (Elucidating the role of clouds-circulation coupling in climate) field campaigns, where three different UAS teams were involved and UAS were operated alongside manned research aircraft and in support of a much larger effort.

BAMS: How did you become interested in unmanned aviation?
GdB: In 2011, I worked with a small group on a review article about our knowledge of mixed-phase clouds in Arctic environments.  We took a good look at critical observational deficiencies, and I began to realize that many of the gaps involved a lack of in situ information, quantities that I thought could be measured by small platforms. This sent me down the road of investigating whether UAS could offer the necessary insight.
Saildrone's Science at the Air–Sea Interface

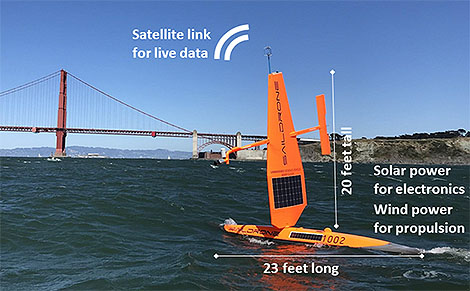
The Saildrone vehicle returning to San Francisco on 11 Jun 2018. The wind anemometer is visible at the top of the wing and solar panels are on both the wing and the vehicle hull. Image credit: Saildrone/Gentemann.
The Saildrone vehicle returning to San Francisco on June 11, 2018. The wind anemometer is visible at the top of the wing and solar panels are on both the wing and the vehicle hull. Image credit: Saildrone/Gentemann.

 
You’ve heard of drones in the air, but how about on the ocean’s surface? Enter Saildrone: A new wind and solar powered ocean-observing platform that carries a sophisticated suite of scientific sensors to observe air–sea fluxes. Looking like a large windsurfer without the surfer, the sailing drone glides autonomously at 2–8 kts. along the surface of uninhabited oceans on missions as long as 12 months, sampling key variables in the marine environment.
In a recent paper published in the Bulletin of the American Meteorological Society, author Chelle Gentemann and her colleagues explain that from April 11 to June 11, 2018, Saildrone cruised on a 60-day round trip from San Francisco down the coast to Mexico’s Guadelupe Island to establish the accuracy of its new measurements. These were made to validate air–sea fluxes, sea surface temperatures, and wind vectors derived by satellites. The automated surface vehicle also studied upwelling dynamics, river plumes, and the air–sea interactions of both frontal and diurnal warming regions on this deployment—meaning Saildrone’s versatile array of instruments got a workout not only above surface but just below it as well, in the water along the hull.

BAMS asked a few questions of the authors to gain insight into their research as well as their backgrounds. A sampling of answers are below:

Chelle Gentemann
Chelle Gentemann

BAMSWhat would you like readers to learn from your article?

Chelle Gentemann, Farallon Institute: New measurement approaches are always being developed, allowing for new approaches to science. Understanding a dataset’s characteristics and uncertainties is important to have confidence in derived results.
BAMSHow did you become interested in working with Saildrone?
Gentemann: The ocean is a challenging environment to work in: it can be beautiful but dangerous, and gathering ship observations can require long absences from your family.  I learned about Saildrones in 2016 and wanted to see how an autonomous vehicle might be able to gather data at the air–sea interface and adapt sampling to changing conditions.  There are some questions that are hard to get at from existing remote sensing and in situ datasets; I thought that if these vehicles are able to collect high-quality data, they could be useful for science.
BAMSHow have you followed up on this experiment? 
Gentemann: We sent two more [Saildrones] to the Arctic last Summer (2019) and are planning for two more in 2021.  There are few in situ observations in the Arctic Ocean because of the seasonal ice cover, so sending Saildrones up there for the summer has allowed us to sample temperature and salinity fronts during a record heat wave.
Sebastien de Halleux, Saildrone, Inc.: I believe we are on the cusp of a new golden age in oceanography, as a wave of new enabling technologies is making planetary-scale in situ observations technically and economically feasible. The fact that Saildrones are zero-emission is a big bonus as we try to reduce our carbon footprint. I am excited to engage further with the science community to explore new ways of using this technology and developing tools to further the value of the data collected for the benefit of humanity.
BAMSWhat got you initially interested in oceanography?
de Halleux: Having had the opportunity to sail across the Pacific several times, I developed a strong interest in learning more about the 70% of the planet covered by water—only to realize that the challenge of collecting data is formidable over such a vast domain. Being exposed to  the amazing power of satellites to produce large-scale remote sensing datasets was only tempered by the realization of their challenges with fine features, land proximity, and of course the need to connect them to subsurface phenomena. This is how we began to explore the intersection of science, robotics, and big data with the goal to help enable new insights. Yet we are only at the beginning of an amazing journey.
BAMS: What surprises/surprised you the most about Saildrone’s capabilities?
Peter Minnett, Univ. of Miami, Florida: The ability to reprogram the vehicles in real time to focus on sampling and resampling interesting surface features. The quality of the measurements is impressive.
Saildrones are currently deployed around the world. In June 2019 , there were three circumnavigating Antarctica, six in the U.S. Arctic, seven surveying fish stock off the U.S. West Coast and two in Norway, four surveying the tropical Pacific, and one conducting a multibeam bathymetry survey in the Gulf of Mexico. In 2020, Saildrone, Inc. has deployed fleets in Europe, the Arctic, the tropical Pacific, along the West Coast, the Gulf of Mexico, the Atlantic, the Caribbean, and Antarctica. NOAA and NASA-funded Saildrone data are distributed openly and publicly.

Saildrone’s Science at the Air–Sea Interface

The Saildrone vehicle returning to San Francisco on 11 Jun 2018. The wind anemometer is visible at the top of the wing and solar panels are on both the wing and the vehicle hull. Image credit: Saildrone/Gentemann.
The Saildrone vehicle returning to San Francisco on June 11, 2018. The wind anemometer is visible at the top of the wing and solar panels are on both the wing and the vehicle hull. Image credit: Saildrone/Gentemann.


You’ve heard of drones in the air, but how about on the ocean’s surface? Enter Saildrone: A new wind and solar powered ocean-observing platform that carries a sophisticated suite of scientific sensors to observe air–sea fluxes. Looking like a large windsurfer without the surfer, the sailing drone glides autonomously at 2–8 kts. along the surface of uninhabited oceans on missions as long as 12 months, sampling key variables in the marine environment.

In a recent paper published in the Bulletin of the American Meteorological Society, author Chelle Gentemann and her colleagues explain that from April 11 to June 11, 2018, Saildrone cruised on a 60-day round trip from San Francisco down the coast to Mexico’s Guadelupe Island to establish the accuracy of its new measurements. These were made to validate air–sea fluxes, sea surface temperatures, and wind vectors derived by satellites. The automated surface vehicle also studied upwelling dynamics, river plumes, and the air–sea interactions of both frontal and diurnal warming regions on this deployment—meaning Saildrone’s versatile array of instruments got a workout not only above surface but just below it as well, in the water along the hull.

BAMS asked a few questions of the authors to gain insight into their research as well as their backgrounds. A sampling of answers are below:

Chelle Gentemann
Chelle Gentemann

BAMSWhat would you like readers to learn from your article?

Chelle Gentemann, Farallon Institute: New measurement approaches are always being developed, allowing for new approaches to science. Understanding a dataset’s characteristics and uncertainties is important to have confidence in derived results.

BAMSHow did you become interested in working with Saildrone?

Gentemann: The ocean is a challenging environment to work in: it can be beautiful but dangerous, and gathering ship observations can require long absences from your family.  I learned about Saildrones in 2016 and wanted to see how an autonomous vehicle might be able to gather data at the air–sea interface and adapt sampling to changing conditions.  There are some questions that are hard to get at from existing remote sensing and in situ datasets; I thought that if these vehicles are able to collect high-quality data, they could be useful for science.

BAMSHow have you followed up on this experiment? 

Gentemann: We sent two more [Saildrones] to the Arctic last Summer (2019) and are planning for two more in 2021.  There are few in situ observations in the Arctic Ocean because of the seasonal ice cover, so sending Saildrones up there for the summer has allowed us to sample temperature and salinity fronts during a record heat wave.

Sebastien de Halleux, Saildrone, Inc.: I believe we are on the cusp of a new golden age in oceanography, as a wave of new enabling technologies is making planetary-scale in situ observations technically and economically feasible. The fact that Saildrones are zero-emission is a big bonus as we try to reduce our carbon footprint. I am excited to engage further with the science community to explore new ways of using this technology and developing tools to further the value of the data collected for the benefit of humanity.

BAMSWhat got you initially interested in oceanography?

de Halleux: Having had the opportunity to sail across the Pacific several times, I developed a strong interest in learning more about the 70% of the planet covered by water—only to realize that the challenge of collecting data is formidable over such a vast domain. Being exposed to  the amazing power of satellites to produce large-scale remote sensing datasets was only tempered by the realization of their challenges with fine features, land proximity, and of course the need to connect them to subsurface phenomena. This is how we began to explore the intersection of science, robotics, and big data with the goal to help enable new insights. Yet we are only at the beginning of an amazing journey.

BAMS: What surprises/surprised you the most about Saildrone’s capabilities?

Peter Minnett, Univ. of Miami, Florida: The ability to reprogram the vehicles in real time to focus on sampling and resampling interesting surface features. The quality of the measurements is impressive.

Saildrones are currently deployed around the world. In June 2019 , there were three circumnavigating Antarctica, six in the U.S. Arctic, seven surveying fish stock off the U.S. West Coast and two in Norway, four surveying the tropical Pacific, and one conducting a multibeam bathymetry survey in the Gulf of Mexico. In 2020, Saildrone, Inc. has deployed fleets in Europe, the Arctic, the tropical Pacific, along the West Coast, the Gulf of Mexico, the Atlantic, the Caribbean, and Antarctica. NOAA and NASA-funded Saildrone data are distributed openly and publicly.

July 4 Fireworks: Spectacular on Weather Radar, Too

Many of us will not be seeing fireworks this Independence Day, due to coronavirus restrictions and local ordinances. But one way to make up for not seeing festive explosions of color and fire in person this year might be to see what they look like…on weather radar.

Willow fireworks 2.3 s after burst. The three smaller bursts are at earlier stages of development. The one in the upper-right corner is at 270 m above ground.
Willow fireworks 2.3 s after burst. The three smaller bursts are at earlier stages of development. The one in the upper-right corner is at 270 m above ground, the highest of the bursts in the study.


In “Fireworks on Weather Radar and Camera,” published recently in the Bulletin of the AMS (BAMS), Dusan Zrnic (National Severe Storms Laboratory) and his colleagues looked at Fourth of July fireworks in Norman, Oklahoma, and Fort Worth, Texas, using reflectivity data and the dual-pol capability on finer resolution radar, which could discern meteor sizes from the explosions.

The three types of radars were: NSSL’s research (3-cm wavelength) dual-polarization radar, the Terminal Doppler Weather Radar (TDWR) that operates in single polarization at a 5-cm wavelength from the Oklahoma City airport, and NWS Doppler radar in both Norman and Fort Worth. To complement the radar, video was taken of the shows.

In Norman, they found bursts were typically 100 to 200 m above ground and a few of them spread to 200 m in diameter. Some of the meteors fell at 22 m s-1, or about the fall speed of large hail. The Fort Worth fireworks were often much larger, and reflectivity  could cover an area about 800 m to more than 2,000 m across–four times as big as in Norman. The peak reflectivity signals in Fort Worth were also greater.

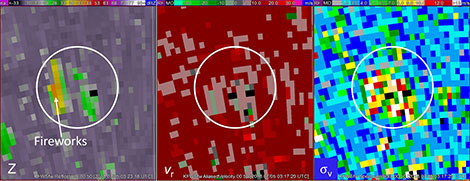
Fields of reflectivity Z (in dBZ), Doppler velocity υr (in m s−1), and Doppler spectrum width συ (in m s−1). The diameter of the white circle is 3.5 km. The data are from the operational WSR-88D over the Dallas–Fort Worth metro area. The arrow points to the patch caused by the fireworks. The patch to the right is caused by reflections off buildings.


In polarimetric radar views of the Norman fireworks, the pyrotechnics signals blended with those from living things like insects, birds or bats. In the Fort Worth case, the backscatter differential phase and the differential reflectivity were in the range of giant hail.

We asked Dr. Zrnic to help us understand his motivations for this work.

How did you get started in observational studies with weather radar?

I have a degree in electrical engineering and was interested in applying my knowledge of random signals to useful purposes. I received a postdoctoral position at the National Severe Storms Laboratory, where in 1973 they had collected data from a violent tornado in Union City, Oklahoma, to gauge its maximum rotational speed. It was about 15 years ahead of any similar collection elsewhere. Upon my arrival I was given the opportunity to work on determining the Doppler spectra of the tornado. That was how I ended up comparing simulated to observed spectra. We observed a reflectivity maximum at a certain radial distance—a “doughnut” type profile that we posited was caused by drops with size and rotational speed for which the centrifugal and centripetal forces were in equilibrium. The rest is history.

What would you like readers to learn from this article?

Operational, polarimetric radars detect fireworks. Also, by comparing reflectivity at three wavelengths we can roughly estimate the dominant size of “stars” of fireworks.

Was this a surprise?

We expected that the polarimetric variables would detect the bursts, but we were surprised by the high values of reflectivities: 47 dBZ from large metropolitan displays versus 39 dBZ for small municipal fireworks as in Norman. These high reflectivity values can bias rainfall measurements unless they are eliminated from further processing.

Why study fireworks on radar?

Initially we were trying to identify onsets and locations of fires and explosions. We found we could do this using  historic WSR-88D data, but not very well. Then my co-author Valery Melnikov suggested that fireworks could be a proxy for these events and this turned out to be true.  The obvious advantage is that the exact place and time of fireworks detonation is known, making it is easy to locate a mobile radar in a favorable position to obtain key data.

What else surprised you?

The highest fall speeds of about 22 m s-1 exceeded our expectations. We also did not realize how transient the returns are; a firework can be seen by eye for up to several seconds and after that it turns into ash, which is not detectable by radar.

What was the biggest challenge you encountered?

We were hoping we might be able to observe the dispersion of Doppler velocities in the Doppler spectra and collected such data. Unfortunately, we lost these data. Another first for us was to learn how to use software for displaying visual images; once we learned, it became a matter of time to do the analysis. Also, to develop the backscattering model of “stars” required extensive literature search. There is no information about the refractive index of “stars” so we had to look up the composition of these and estimate the values for mixtures of three ingredients. The good thing is that the results are not very sensitive to a range of possible values.

Fireworks on radar may be quieter, but the paper shows that—on polarimentric displays—they’re just as colorful. When your local fireworks shows finally return, the authors advise, “using smart phones, the public can observe radar images and the real thing at the same time.”

Making Sure No Tornado Damage Is Too Small

Planetary, synoptic, meso-alpha, meso-beta, local, and more—there are atmospheric scales aplenty discussed at AMS meetings. Enter microtopography, a once-rare word increasingly appearing in the mix in research (for example, here and here).
The word is also coming up as researchers are getting new tools to examine the interaction of tornadoes with their immediate surroundings. Microtopography looks like a potential factor in tornadic damage and in the tornadoes themselves, according to an AMS Annual Meeting presentation by Melissa Wagner (Arizona State Univ.) and Robert Doe (Univ. of Liverpool), who are working on this research with Aaron Johnson (National Weather Service) and Randy Cerveny (Arizona State Univ). Their findings relate tornado damage imagery to small changes in local topography thanks to the use of unmanned aerial systems (UASs).
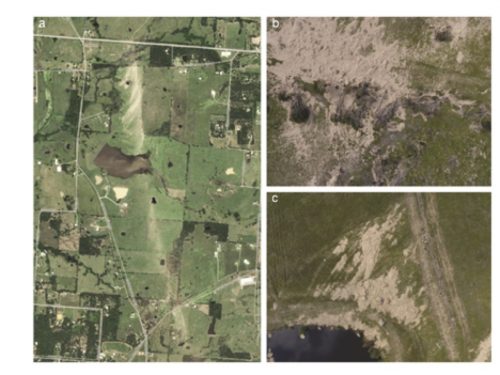
Microtopographic interactions of tornadic winds were captured in their UAS imagery. Here’s the 5-meter resolution RapidEye satellite imaging of a 30 April 2017 Canton, Texas, tornado path (panel a) versus higher-resolution UAS imaging:
UAS damage figure 1
 
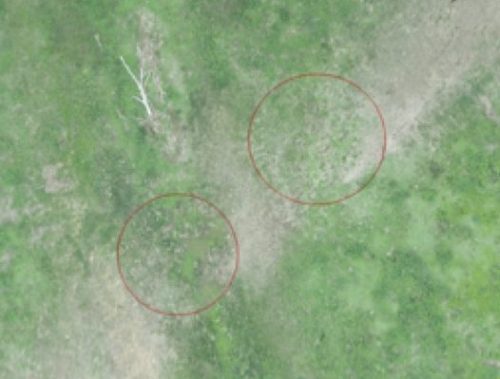
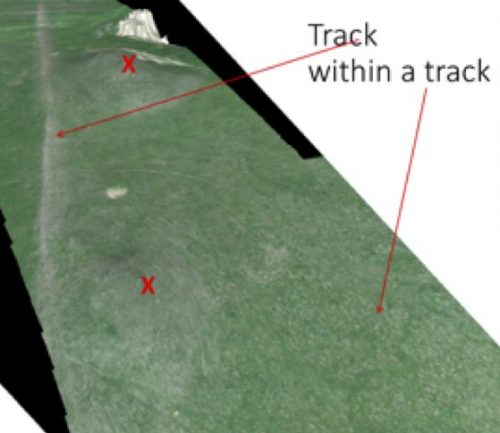
The UAS surveys show that tornadic winds interact with sunken gullies, which appear as unscarred, green breaks (circled in red) in the track of browned damaged vegetation:
UAS damage fig. 3
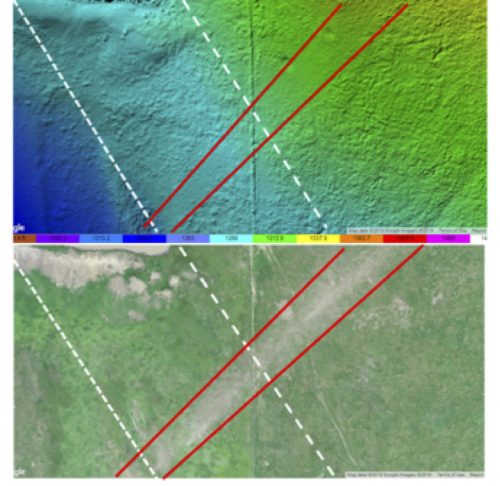
Erosion and scour are limited within the depressed surfaces of the gullies compared to either side. In another section of the track, track width increases with an elevation gain of approximately 74 feet, as shown in a digital elevation model and 2.5 cm resolution UAS imagery:
UAS damage 3+
The advent of unmanned aerial vehicles (UAVs) has opened new windows on tornado damage tracks. Decades ago, damage surveys took a big leap forward with airplane-based photography that provided a perspective difficult to achieve on the ground. Satellites also can provide a rapid overview but in relatively low resolution. UASs fly at 400 feet—and are still limited to line-of-sight control and the logistics of coordinating with local emergency and relief efforts, regulatory and legal limitations, not to mention still-improving battery technology.
However, UASs provide a stable, reliable aerial platform that benefits from high-resolution imaging and can discern features on the order of centimeters across. Wagner and colleagues were using three vehicles with a combined multispectral imaging capability that is especially useful in detecting changes in the health of vegetation. As a result their methods are being tested primarily in rural, often inaccessible areas of damage.
UAS technologies thus can capture evidence of multi-vortex tornadoes in undeveloped or otherwise remote, vegetated land. The image below shows a swath with enhanced surface scour over two hills (marked X). The arrow on the right identifies speckled white surface erosion, part of the main tornado wedge. Such imagery explains why, among other research purposes, Wagner and Doe are developing the use of UASs in defining tracks and refining intensity-scale estimates.
UAS damage Figure 4

Cruising the Ocean’s Surface Microlayer

Oceans are deep, and they are integral to the climate system. But the exchanges between ocean and atmosphere that preoccupy many scientists are not in the depths but instead in the shallowest of shallow layers.
A lot happens in the topmost millimeter of the ocean, a film of liquid called the “sea-surface microlayer that is, in many ways, a distinct realm. At this scale, exchanges with the atmosphere are more about diffusion, conduction, and viscosity than turbulence. But the layer is small and difficult to observe undisturbed and over sufficient areas. As a result, “it has been widely ignored in the past,” according to a new paper by Mariana Ribas-Ribas and colleagues in the Journal of Atmospheric and Oceanic Technology.
Nonetheless, Ribas-Ribas and her team, based in Germany, looked for a new way to skim across and sample the critical top 100 micrometers (one tenth of a millimeter) of the ocean. This surface microlayer (SML) “plays a central role in a range of global biogeochemical and climate-related processes.” However, Ribas-Ribas et al. add,

The SML often has remained in a distinct research niche, primarily because it was thought that it did not exist in typical oceanic conditions; furthermore, it is challenging to collect representative SML samples under natural conditions.

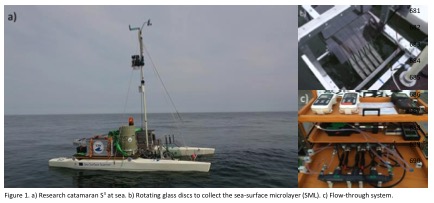
In their paper (now in early online release), the authors report on their solution to observing is a newly outfitted remote-controlled catamaran. A set of rotating glass discs with holes scoops up water samples. Pictured below are the catamaran and (at left, top) the glass discs mounted between the hulls and (bottom left) the flow-through system.
catamaran
Catamarans are not new to this research, but they were generally towed behind other vessels and subject to wake effects or were specialized. The new Sea Surface Scanner (S3) takes advantage of better remote control and power supply technology and can pack multiple sampling and sensors and controls onto one platform. Tests in the Baltic Sea last year showed the ability of S3 to track responses of organisms in the surface microlayer to ocean fronts, upwelling areas, and rainfall. The biological processes in turn affect critical geochemical processes like exchanges of gases and production of aerosols for the atmosphere.
The technology may be a fresh start for research looking in depth at the shallowest of layers. See the journal article for more details on the S3 and its performance in field tests.
 

Great bursting balloons, Batman!

Ever wonder what happens to weather balloons as they reach their peak altitude and can’t take the low pressure anymore? They pop, right? Nope. They shatter! Shred! Explode!
This video shows the unique way a weather balloon bursts at about 30,000 m.

Credit: Patrick Cullis (NOAA/CIRES)
The full explanation and several stills to show the explosion in spectacular “stop-action” are in an upcoming issue of BAMS. For members, the BAMS digital edition with its new multimedia capabilities will show the article with both the stills and an embedded video.

Protecting Scientific Use of the Spectrum

by Ya’el Seid-Green, AMS Policy Program
There has been much talk recently about the Federal Communications Commission (FCC) proceedings to sell the radio frequencies of 1675-1680 MHz, currently used for GOES data transmission, on the open market. A comment period on the proposal closes June 21st. More information can be found here.
The radio spectrum is a limited resource of great value both within and beyond our scientific community. The weather, water, and climate community uses radio spectrum to conduct scientific research, collect observations, and transmit data that contribute to oceanic, atmospheric, and hydrologic research, models, products, and services. Spectrum is also used to support mobile broadband networks, a sector with enormous growth potential and value for the United States economy.
The scientific community uses the radio spectrum in three distinct ways:

  • Passive remote sensing: Measuring the natural radio emissions of the environment and space (receiver only). Example: GPM Microwave Imager on the Global Precipitation Measurement Mission Core Spacecraft
  • Active remote sensing: Emitting radio waves and measuring the return emissions (transmitter and receiver). Example: Cloud Profiling Radar on CloudSat
  • Data transmission: Transmitting data from satellites and ground-observation stations. Example: GOES VARiable (GVAR) service on the GOES system satellites

Observations are made using ground-based, airborne, and space-based platforms to determine wind profiles, rainfall estimates, wave heights, and ocean current direction, among others. Further information on active and passive sensing instruments is available here: https://earthdata.nasa.gov/user-resources/remote-sensors.
With the advent and rapid growth of mobile commercial technologies, interference on and competition for the radio spectrum has increased. The signals of commercial terrestrial users of spectrum are often much stronger than the signals being measured or transmitted by the weather, water, and climate communities. This can cause radio frequency interference (RFI) that degrades or entirely destroys the data being collected and transmitted for scientific and operational uses.
In addition, there is pressure for federal agencies to relocate off certain spectrum bands to free up additional space for commercial users. In 2010, President Obama set a target of freeing up 500 MHz of spectrum for wireless broadband services. (See also, the Report to the President: Realizing the Full Potential of Government-Held Spectrum to Spur Economic Growth, available here.) The potential benefits to the U.S. economy from freeing up spectrum for commercial use are considerable. Mobile broadband is a rapidly growing segment of the economy, and in 2015 the FCC auctioned off the frequencies of 1695-1710, 1755-1780, and 2155-2180 MHz (collectively the “AWS-3” bands) for mobile telecommunication use for a combined $44.9 billion.
There are several challenges in understanding spectrum allocation policy. First, several different agencies are responsible for allocating and regulating spectrum: the International Telecommunications Union (ITU), within the U.N., allocates spectrum internationally; the National Telecommunications and Information Administration (NTIA) manages Federal use of the spectrum; and the Federal Communications Commission (FCC) manages non-Federal use of the spectrum. This bifurcated regulatory system can make decision-making and management of spectrum use challenging.
Second, given the diverse and complex sources of data that go into weather, water, and climate products, it is often hard for end users to understand how radio spectrum management issues may impact the products and services they rely on for creating value-added products or for making management decisions (see the joint letter sent to the FCC by the AMS and National Weather Association). Finally, it is often difficult to determine the value of scientific and operational uses of the spectrum. Because of this valuation problem, there is concern that earth science uses of the spectrum are not being taken fully into account in spectrum management decisions (see the National Research Council report, A Strategy for Active Remote Sensing Amid Increased Demand for Radio Spectrum).
Although the FCC proceedings regarding 1675-1780 MHz have received the most attention in our community recently, issues around spectrum allocation and management are only going in grow in scope and frequency as pressure on the spectrum increases. An AMS Ad Hoc Committee is working to update the AMS Statement on radio frequency allocations, and there are several bills under consideration in Congress that focus on spectrum management concerns. As a community, we must be prepared to communicate the importance of spectrum for earth observations, science, and services, and the resulting societal applications. We need to be actively engaged in exploring management strategies, policy options, and technology innovations that will allow the nation and the world to gain the maximum benefit from our use of the radio spectrum.
 

Moving Forward, Again, on a National Network of Networks

by James Stalker, President & CEO, RESPR, Inc.
Since my last blog in The Front Page a little over a year ago about the effort to form a National Network of Networks, many changes have taken place.
First, the AMS NNoN ad hoc Committee completed its final report in 2013, which is available on the AMS website at http://ametsoc.org/boardpges/cwce/docs/NoN/2013-06-01-NNoN-Final-Report.pdf. A short summary article will appear in the Bulletin of the American Meteorological Society this fall.
While these are welcome developments, the network of networks initiative almost came to a screeching halt except for the work of the Weather and Climate Enterprise Commissioner, Matt Parker, who didn’t want it to go away. Matt asked me to chair the new Nationwide Network of Networks (NNoN) effort going forward. At that time, as the NNoN R&D/Testbeds Working Group chair for the previous three years, I was prepared for the seemingly inevitable end of the NNoN effort, but refused to accept it.
So, here we are now with renewed enthusiasm for the new NNoN initiative taking shape within a full fledged AMS NNoN Committee, under the AMS Board on Strategic Topics (BEST). Previous participants, particularly John Lasley, and the past NNoN ad hoc Committee chair, George Frederick, pooled together a committee of more than 30 people to resume the effort.
For those of you who are not familiar with the NNoN initiative, it all got started when the National Research Council (NRC) report titled Observing the Weather and Climate From the Ground Up: A Nationwide Network of Networks came out in 2009. The AMS NNoN ad hoc Committee further reviewed the recommendations of the NRC report and produced the aforementioned report of its own.
The ad hoc committee produced six specific recommendations, but the first and most important one is to organize a stakeholders summit to gain weather and climate community-wide support for the NNoN effort. The renewed NNoN initiative is, in fact, considering this recommendation in stride. It will hold a couple of mini-summit meetings in 2013 and 2014, before the culminating stakeholders summit in 2015.
In this regard, a meeting is scheduled to take place in Boulder, Colorado, on Monday, August 12, the day before the AMS Summer Community Meeting begins. Members of the weather and climate enterprise community are urged to attend this mini-summit to learn about the new NNoN direction and provide critical input.
One of the key tweaks in the approach of the new NNoN is the bottom-up approach, as opposed to the top-down approach of the earlier efforts. In other words, new network members joining the NNoN are consulted for their input before recommendations are suggested specifically for that network member. Another key tweak is that the new NNoN Committee is going to actually help network members implement the network-specific recommendations. Implementation services will require funding, and the new NNoN is exploring many possible ways to secure such funding.
The new NNoN effort is supported by three working groups: 1) an Implementation Working Group, 2) an Outreach Working Group, and 3) an Advisory Working Group. These working groups comprise multiple teams to provide the benefits network members are looking for. The upcoming BAMS article will detail the new NNoN initiative, including the working groups and the teams that comprise them.
Also, for further information and for expressing your interest to join the effort as a committee member, get in touch with me at [email protected] or any of the three working group chairs (Greg Partt at [email protected]; John Lasley at [email protected]; Don Berchoff at [email protected]).

Budget Squeeze Spurs U.S. Weather Collaboration

by George Leopold, AMS Policy Program
The watchword for future federal weather efforts will be collaboration.
Budget sequestration has so far limited the options for program managers seeking ways to fund new observation platforms ranging from expensive satellites to ships and unmanned aircraft carrying weather sensors. For the U.S. military, which has taken the brunt of across-the-board spending cuts, a new weather satellite like the Defense Weather Follow-On System means fewer ships and planes.
The zero-sum budget process faced by federal agencies means that “if you want something, you have to give up something else,” says Robbie Hood, director of NOAA’s Unmanned Aircraft Systems program. “Our job is to look at all these new technologies” and identify the best option.
The Navy also is looking at unmanned aircraft along with new ship-based sensors as ways to monitor the lower atmosphere. The Navy’s weather requirements appear to mesh well with those of civilian agencies like NOAA.
The military services and civilian agencies such as NOAA are again attempting to share weather observation data as a way to stretch scarce dollars. Weather observing needs continue to dovetail across stakeholders as collaboration heats up among the services, civilian agencies and other entities. For example, the Army needs satellite data on conditions like soil moisture content when planning ground operations.
One area ripe for closer cooperation is ocean observations, an obvious focus for the Navy and a growing segment of weather observations for storm trackers and climate modelers. Leveraging emerging platforms like drones, unmanned boats and ship-based sensors could help fill part of the anticipated gap in satellite coverage of the Earth’s oceans. For the military, coverage gaps could result from either the failure of an Earth observation satellite, delays in launching the Defense Weather Follow-On System or the fact that U.S. weather satellites tend to target the coasts.
NOAA’s Hood said her office is working with other agencies to synch up new weather observation requirements. She noted that using unmanned aircraft for applications like monitoring Arctic sea ice, for example, is similar in many ways to military reconnaissance missions.
NOAA has purchased used Puma AE unmanned aircraft from the Army at bargain prices and will hand launch them from U.S. Coast Guard ships on test flights later this year. The unmanned aircraft have been used extensively by the Army to “see over the next hill.” The Puma AE has a 9.2-foot wingspan, weighs 13 pounds and can remain aloft for up to two hours.
Hood said monitoring Arctic sea ice using sensor platforms like the Puma is an ideal way to promote interagency collaboration given “our commonality of interests.” Continuing budget constraints mean unmanned aircraft outfitted with the appropriate weather sensors and navigation aids are the most cost-effective way to reach critical but remote areas like the Arctic, she added.
While NOAA is investing in Pumas, NASA’s weather drone fleet includes two high-flying, long-endurance Global Hawks purchased from the Air Force.  (NASA operates the unmanned aircraft and NOAA provides most of the sensor payloads.) Meanwhile, the Energy Department is working on new weather sensor systems that could be flown on drones operated by other agencies.
The acquisition strategy of civilian agencies like NOAA and NASA also seeks to leverage the U.S. military’s long experience flying unmanned aircraft. Not only are used drones cheaper, they require less testing. Hence, NOAA and NASA drones will help monitor melting Arctic sea ice this summer as part of the Marginal Ice Zone Observations and Process Experiment. The experiment focuses on targeted observations to gain a better understanding of local conditions like sea surface temperature and salinity during summer melts.
The Navy and NOAA could also collaborate on tracking ocean surface vector winds, Hood said. “There a lot of small, joint efforts designed to keep things moving” despite tight budgets, she added.
The tough U.S. job market, especially for returning veterans, might also be addressed if interagency collaboration expands. Hood said civilian agencies looking for drone operators could recruit veterans with experience flying Global Hawks in combat.