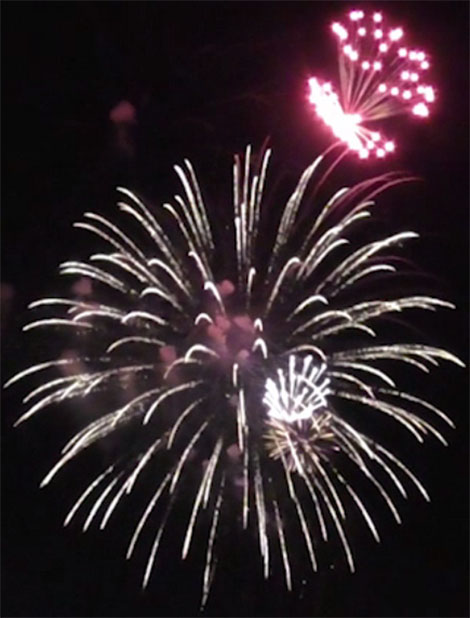
Many of us will not be seeing fireworks this Independence Day, due to coronavirus restrictions and local ordinances. But one way to make up for not seeing festive explosions of color and fire in person this year might be to see what they look like…on weather radar.
In “Fireworks on Weather Radar and Camera,” published recently in the Bulletin of the AMS (BAMS), Dusan Zrnic (National Severe Storms Laboratory) and his colleagues looked at Fourth of July fireworks in Norman, Oklahoma, and Fort Worth, Texas, using reflectivity data and the dual-pol capability on finer resolution radar, which could discern meteor sizes from the explosions.
The three types of radars were: NSSL’s research (3-cm wavelength) dual-polarization radar, the Terminal Doppler Weather Radar (TDWR) that operates in single polarization at a 5-cm wavelength from the Oklahoma City airport, and NWS Doppler radar in both Norman and Fort Worth. To complement the radar, video was taken of the shows.
In Norman, they found bursts were typically 100 to 200 m above ground and a few of them spread to 200 m in diameter. Some of the meteors fell at 22 m s-1, or about the fall speed of large hail. The Fort Worth fireworks were often much larger, and reflectivity could cover an area about 800 m to more than 2,000 m across–four times as big as in Norman. The peak reflectivity signals in Fort Worth were also greater.
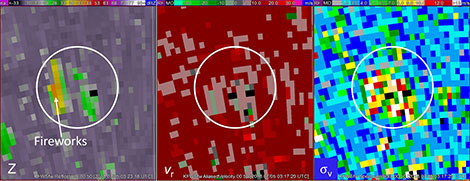
In polarimetric radar views of the Norman fireworks, the pyrotechnics signals blended with those from living things like insects, birds or bats. In the Fort Worth case, the backscatter differential phase and the differential reflectivity were in the range of giant hail.
We asked Dr. Zrnic to help us understand his motivations for this work.
How did you get started in observational studies with weather radar?
I have a degree in electrical engineering and was interested in applying my knowledge of random signals to useful purposes. I received a postdoctoral position at the National Severe Storms Laboratory, where in 1973 they had collected data from a violent tornado in Union City, Oklahoma, to gauge its maximum rotational speed. It was about 15 years ahead of any similar collection elsewhere. Upon my arrival I was given the opportunity to work on determining the Doppler spectra of the tornado. That was how I ended up comparing simulated to observed spectra. We observed a reflectivity maximum at a certain radial distance—a “doughnut” type profile that we posited was caused by drops with size and rotational speed for which the centrifugal and centripetal forces were in equilibrium. The rest is history.
What would you like readers to learn from this article?
Operational, polarimetric radars detect fireworks. Also, by comparing reflectivity at three wavelengths we can roughly estimate the dominant size of “stars” of fireworks.
Was this a surprise?
We expected that the polarimetric variables would detect the bursts, but we were surprised by the high values of reflectivities: 47 dBZ from large metropolitan displays versus 39 dBZ for small municipal fireworks as in Norman. These high reflectivity values can bias rainfall measurements unless they are eliminated from further processing.
Why study fireworks on radar?
Initially we were trying to identify onsets and locations of fires and explosions. We found we could do this using historic WSR-88D data, but not very well. Then my co-author Valery Melnikov suggested that fireworks could be a proxy for these events and this turned out to be true. The obvious advantage is that the exact place and time of fireworks detonation is known, making it is easy to locate a mobile radar in a favorable position to obtain key data.
What else surprised you?
The highest fall speeds of about 22 m s-1 exceeded our expectations. We also did not realize how transient the returns are; a firework can be seen by eye for up to several seconds and after that it turns into ash, which is not detectable by radar.
What was the biggest challenge you encountered?
We were hoping we might be able to observe the dispersion of Doppler velocities in the Doppler spectra and collected such data. Unfortunately, we lost these data. Another first for us was to learn how to use software for displaying visual images; once we learned, it became a matter of time to do the analysis. Also, to develop the backscattering model of “stars” required extensive literature search. There is no information about the refractive index of “stars” so we had to look up the composition of these and estimate the values for mixtures of three ingredients. The good thing is that the results are not very sensitive to a range of possible values.
Fireworks on radar may be quieter, but the paper shows that—on polarimentric displays—they’re just as colorful. When your local fireworks shows finally return, the authors advise, “using smart phones, the public can observe radar images and the real thing at the same time.”