An Anticipated Increase in Earth's Strongest Storms

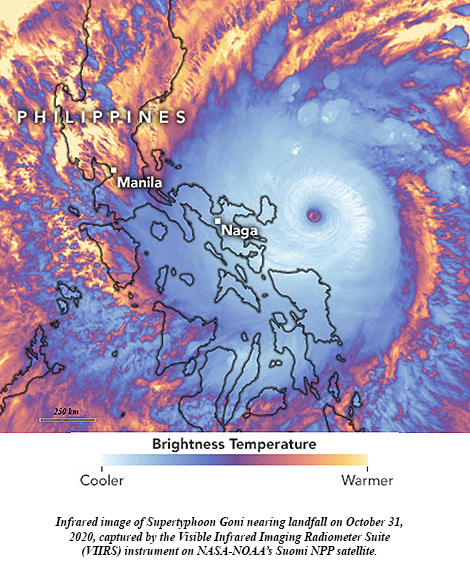
GoniA little more than two weeks ago, Supertyphoon Goni blasted ashore in the Philippines with top sustained winds of 195 mph, becoming the strongest landfalling tropical cyclone on record. It topped STY Haiyan’s 190 mph land strike just seven years ago. With Hurricane Iota in the Caribbean explosively intensifying 100 mph in under 24 hours to reach Category 5 intensity Monday, it set a new record of five consecutive years of Cat 5 hurricanes in the North Atlantic tropical cyclone basin. Among the seven catastrophic hurricanes, starting with Matthew in 2016, were Dorian and Irma, packing 185 mph and 180 mph steady winds, respectively, with peak gusts well over 200 mph.
Goni is the latest formidable example of an increasing trend in tropical cyclone intensity. While Goni established a new landfall wind intensity record, Iota and other recent major hurricanes Eta, Zeta, and Delta set or challenged records for most intense hurricanes so late in the season.
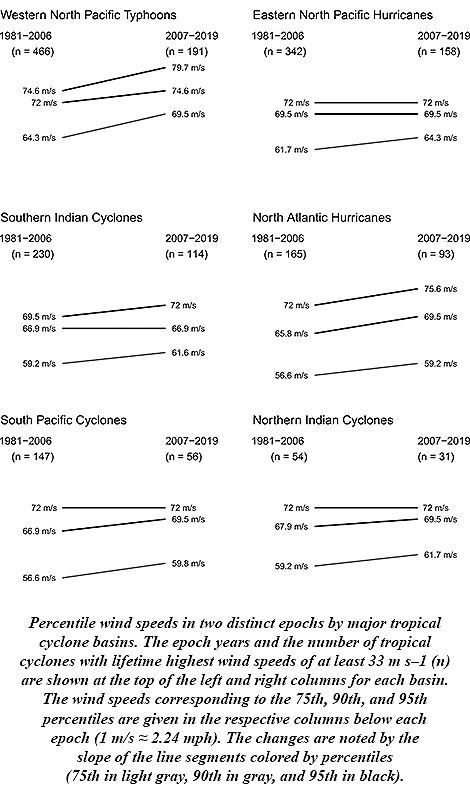
PercentilesJames Elsner of Florida State University says this is to be expected. His research stated in 2008 that there was an upward trend in the intensity of the most intense tropical cyclones. Rising ocean temperatures, as theory predicted, were driving the trend. And with oceans continuing to warm along with Earth’s climate since then, Elsner anticipated the continuing upward trend. New research published in the Bulletin of the American Meteorological Society confirms his prediction, finding that another 3.5 to 4.5 percent increase in intensity has occurred with the strongest tropical cyclones during the period 2007-19.
Globally, all basins show upward trends, Elsner says, with the North Atlantic and Western North Pacific revealing the steepest and most consistent upticks.

An Anticipated Increase in Earth’s Strongest Storms

GoniA little more than two weeks ago, Supertyphoon Goni blasted ashore in the Philippines with top sustained winds of 195 mph, becoming the strongest landfalling tropical cyclone on record. It topped STY Haiyan’s 190 mph land strike just seven years ago. With Hurricane Iota in the Caribbean explosively intensifying 100 mph in under 24 hours to reach Category 5 intensity Monday, it set a new record of five consecutive years of Cat 5 hurricanes in the North Atlantic tropical cyclone basin. Among the seven catastrophic hurricanes, starting with Matthew in 2016, were Dorian and Irma, packing 185 mph and 180 mph steady winds, respectively, with peak gusts well over 200 mph.

Goni is the latest formidable example of an increasing trend in tropical cyclone intensity. While Goni established a new landfall wind intensity record, Iota and other recent major hurricanes Eta, Zeta, and Delta set or challenged records for most intense hurricanes so late in the season.

PercentilesJames Elsner of Florida State University says this is to be expected. His research stated in 2008 that there was an upward trend in the intensity of the most intense tropical cyclones. Rising ocean temperatures, as theory predicted, were driving the trend. And with oceans continuing to warm along with Earth’s climate since then, Elsner anticipated the continuing upward trend. New research published in the Bulletin of the American Meteorological Society confirms his prediction, finding that another 3.5 to 4.5 percent increase in intensity has occurred with the strongest tropical cyclones during the period 2007-19.

Globally, all basins show upward trends, Elsner says, with the North Atlantic and Western North Pacific revealing the steepest and most consistent upticks.

We May Be Able to Further Improve Hurricane Track Forecasts After All

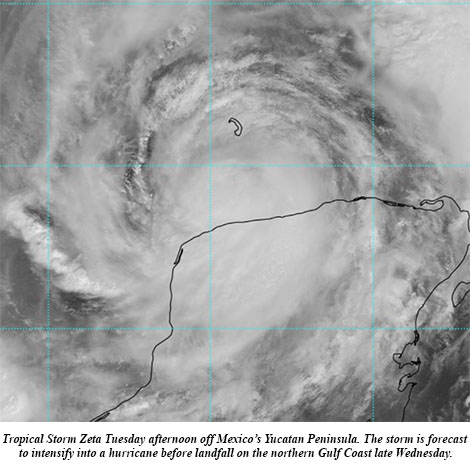
ZetaZeta blossomed into the 11th hurricane of this hyperactive season Monday and its forecast track takes it ashore on the Gulf Coast by midweek. The National Hurricane Center (NHC) on Monday said computer models had become more tightly clustered with the forecast in the Gulf, “resulting in an increase in track-forecast confidence,” and Hurricane Zeta is expected to become the United States’ record 11th storm landfall in a single season.

Such confidence is a reflection that NHC’s tropical storm and hurricane track forecasts, which go out 5 days, have substantially improved in the last 25 years. But, a 2018 essay in the Bulletin of the American Meteorological Society (BAMS) found that such improvements in track forecasts have slowed, raising concern about making them any better and extending them out beyond 5 days with any skill. While that study suggested improvements may have reached a limit, new research also published in BAMS finds a way to further refine them in the coming decades. Using a different interpretation of track position errors than the earlier article, the research moves the predictability limit for tropical cyclones out a day per decade to 6-8 days in the next 10-30 years.

Late Season Hurricanes Bring Research Opportunities, Too

After a veritable flurry of storms in the Atlantic since August, the basin has gone quiet following the landfalls of Tropical Storm Beta in Texas, and Post-Tropical Storm Teddy in Nova Scotia. But late-season storms are quite common in the Atlantic, and as this hyperactive hurricane season combines with confirmed La Niña conditions, this year it seems almost like an expectation. And that means people on the coast need to stay alert to what’s going on in the atmosphere, but it also means there’s still promise for additional hurricane research this year.

Recent Octobers have seen a couple of very intense and even catastrophic hurricanes develop and make landfall. The last big one was Hurricane Michael, which slammed the Florida Panhandle in 2018. In 2016, Hurricane Matthew roared to life in the Caribbean, reaching Category 5 intensity on the Saffir-Simpson scale before crashing into Hispaniola as a Cat. 4, and then menacing the Florida coast for days and eventually swirling into the Carolinas.

Matthew turned out to be a late-season success for NOAA’s Sensing Hazards with Operational Unmanned Technology (SHOUT) project.  SHOUT evaluated the ability of observations taken by the high-altitude, unmanned Global Hawk aircraft to improve forecasts of high-impact weather events, which are “one of the most critically needed capabilities of weather services around the world,” write lead author Gary Wick and his colleagues in their article on SHOUT in the Bulletin of the American Meteorological Society.

NASA’s Global Hawk flew 15 missions sampling Hurricane Matthew and 5 other tropical cyclones as well as 3 winter storms in 2015 and 2016. Instrumented with GPS dropwindsondes and remote sensors, Global Hawk’s data were examined in real time by forecasters, assimilated in operational weather prediction models, and applied to data impact studies, demonstrating positive results.

BAMS asked Wick a few questions about his work and SHOUT in particular (for the full answers, see the print or digital edition of the magazine):

BAMS: What would you like readers to learn from your article?

Gary Wick: The primary message we would like to convey is that Global Hawk can provide highly useful observations of high-impact weather events that would be very difficult to obtain with any other
existing aircraft or observing system.  It was possible to consistently see the potential for forecast benefit across a wide range of models.

Gary_Wick-and-Global_HawkBAMS: How did you get into this focus on improving operational hurricane forecasts with unmanned aircraft?
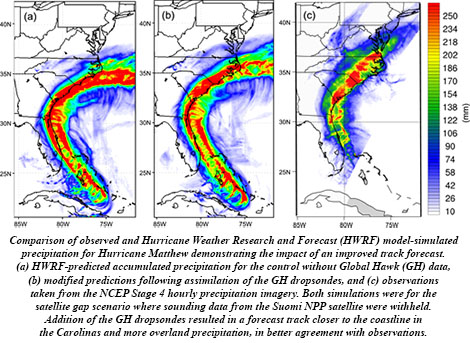
GW: I was fortunate to have participated in both the NASA-led Genesis and Rapid Intensification (GRIP) and Hurricane and Severe Storm Sentinel (HS3) campaigns and was able to observe the potential application of the Global Hawk to tropical cyclone research.  The distinct goals of those campaigns, however, didn’t allow for a real focus on the operational hurricane forecasting problem.  We in the NOAA UAS Program were extremely excited when support from the Disaster Relief Act of 2013 gave us the opportunity to conduct a dedicated campaign to examine the impact of observations from the Global Hawk on forecasts of high-impact weather.

BAMS: What got you initially interested in meteorology?

GW: My path to this project was really quite indirect.  My interests growing up really centered around planes, due in part to living close to the old Denver airport.  As a kid, I would frequently ride my bicycle out to the end of the runway and watch planes take off and land.  These interests led me to study Aerospace Engineering as an undergraduate where I just happened to take a class one year in environmental aerodynamics taught by a scientist from a predecessor of my current NOAA laboratory.  This class introduced me to remote sensing and I ended up pursuing graduate studies centered primarily around satellite-based remote sensing.  The work with UAS in general and this project in particular allowed me to come full circle, in a sense, combining my many interests in aircraft, remote sensing, and weather.

BAMS: What surprised you the most in the SHOUT project?

GW: As someone whose personal work hadn’t centered around atmospheric models, assimilation, and weather forecasting, it was surprising to me early on how providing weather models with more, high quality, direct observations wouldn’t necessarily improve the resulting forecasts and, in some cases, could actually degrade them.  One might naively think that better data could only lead to a better final product.  After gaining an appreciation of how challenging it is to achieve meaningful forecast improvements through addition of any data to our current observing and assimilation systems, I was
very pleasantly surprised that it does appear that the highly unique observations enabled by the Global Hawk still have the potential to help us improve our forecasts of high-impact weather events.

BAMS: What was the biggest challenge you encountered in the experiment?

GW: As with seemingly any field project, our biggest challenge was probably obtaining the weather events we were hoping to study during the necessarily limited duration of the campaign.  Through the multiple years of the GRIP, HS3, and SHOUT campaigns, the Global Hawk developed almost a reputation as a “hurricane repellent” due to the limited number of storms during the experimental periods.  Perhaps the most interesting storm sampled during the SHOUT campaign, Hurricane Matthew in 2016, actually occurred after the scheduled end of the experiment.  Fortunately, we were able to extend the campaign and collect some very valuable additional observations.

Matthew_GHBAMS: What’s next? How will you follow up?
GW: Several additional studies are underway to better evaluate the impact of all the different observations collected in different and the most recent models. NOAA is still working to evaluate and increase the number of UAS observations (particularly from smaller platforms) to help conduct our mission.

Hurricane Sally’s Extreme Flood Potential

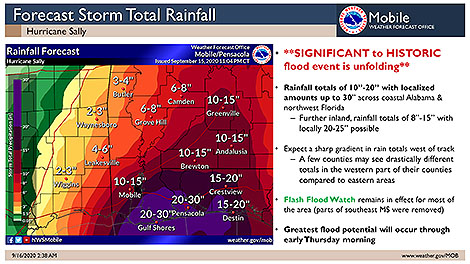
Hurricane Sally is inching ashore in southeast Alabama Wednesday morning and has started to flood parts of the central Gulf Coast with an expected 1-2 feet of rain, maybe more. With that much rain forecast, it seems likely to join other recent catastrophic flood disasters Harvey (2017) and Florence (2018) in ushering in a new era of rainier storms at landfall that bring with them an extreme rain and flooding threat.

Sally_rainfall-3

Recent research by NOAA’s Tom Knutson and a team of tropical weather and climate experts in the March Bulletin of the American Meteorological Society and blogged about here determined with medium-to-high confidence that more and more hurricanes in our future warming world will be wetter at landfall.

And with more wetter storms on the way, better communication about these potentially deadly impacts from copious rainfall is needed. Another BAMS article we blogged about addressed this by creating an Intuitive Metric for Deadly Tropical Cyclone Rains. Its authors designed the new tool—the extreme rainfall multiplier (ERM)—to easily understand the magnitude of life-threatening extreme rain events.

Co-author James Kossin explained to BAMS:

Water presents a much greater hazard in a hurricane than wind does, but the Saffir-Simpson categories are based on wind-speed alone. Salt-water hazards along and near the coast are caused by storm surge. Coastal residents are warned about these hazards and are provided with evacuation plans. Fresh-water flooding from extreme hurricane rainfall, however, can happen inland away from evacuation zones, and pose the greatest threat to life and property in these areas where people tend to shelter-in-place. Compound hazards such as dam failures and land-slides in mountainous regions pose additional significant threats. In this case, effective warnings and communication of the threats to inland populations is paramount to reduce mortality. This work strives to present a tool for providing warnings based on people’s past experience, which gives them a familiar reference point from which to assess their risk and make informed decisions.

Lead author Christopher Bosma:

We started out this project focused on analyzing the catastrophic and record-breaking rainfall associated with Hurricane Harvey. But, as we started to finish our analysis of that system, just a year later, Hurricane Florence brought devastating and torrential rainfall to the Carolinas, which forced us to go back and revisit some of our initial analysis. The fact that multiple major storms happened in quick succession grabbed a lot of headlines, but, from a research and scientific perspective, it also provided a chance to note how the messaging used to describe these systems had changed (or not) and think of other ways to use the metric we had developed.

ERM is not yet operational, but that is the researchers’ goal, to “convey effective warnings to people about fresh-water flooding threats,” Kossin says.

Hurricane Sally is one such extreme rainfall flood threat, with “significant to historic flooding” likely, the National Weather Service says.

Hurricane Sally's Extreme Flood Potential

Hurricane Sally is inching ashore in southeast Alabama Wednesday morning and has started to flood parts of the central Gulf Coast with an expected 1-2 feet of rain, maybe more. With that much rain forecast, it seems likely to join other recent catastrophic flood disasters Harvey (2017) and Florence (2018) in ushering in a new era of rainier storms at landfall that bring with them an extreme rain and flooding threat.
Sally_rainfall-3
Recent research by NOAA’s Tom Knutson and a team of tropical weather and climate experts in the March Bulletin of the American Meteorological Society and blogged about here determined with medium-to-high confidence that more and more hurricanes in our future warming world will be wetter at landfall.
And with more wetter storms on the way, better communication about these potentially deadly impacts from copious rainfall is needed. Another BAMS article we blogged about addressed this by creating an Intuitive Metric for Deadly Tropical Cyclone Rains. Its authors designed the new tool—the extreme rainfall multiplier (ERM)—to easily understand the magnitude of life-threatening extreme rain events.
Co-author James Kossin explained to BAMS:

Water presents a much greater hazard in a hurricane than wind does, but the Saffir-Simpson categories are based on wind-speed alone. Salt-water hazards along and near the coast are caused by storm surge. Coastal residents are warned about these hazards and are provided with evacuation plans. Fresh-water flooding from extreme hurricane rainfall, however, can happen inland away from evacuation zones, and pose the greatest threat to life and property in these areas where people tend to shelter-in-place. Compound hazards such as dam failures and land-slides in mountainous regions pose additional significant threats. In this case, effective warnings and communication of the threats to inland populations is paramount to reduce mortality. This work strives to present a tool for providing warnings based on people’s past experience, which gives them a familiar reference point from which to assess their risk and make informed decisions.

Lead author Christopher Bosma:

We started out this project focused on analyzing the catastrophic and record-breaking rainfall associated with Hurricane Harvey. But, as we started to finish our analysis of that system, just a year later, Hurricane Florence brought devastating and torrential rainfall to the Carolinas, which forced us to go back and revisit some of our initial analysis. The fact that multiple major storms happened in quick succession grabbed a lot of headlines, but, from a research and scientific perspective, it also provided a chance to note how the messaging used to describe these systems had changed (or not) and think of other ways to use the metric we had developed.

ERM is not yet operational, but that is the researchers’ goal, to “convey effective warnings to people about fresh-water flooding threats,” Kossin says.
Hurricane Sally is one such extreme rainfall flood threat, with “significant to historic flooding” likely, the National Weather Service says.

The Forecast for Huge Numbers of Hurricanes in 2020: Not a "New Normal"

Thursday NOAA updated its forecast to an “extremely active” Atlantic hurricane season. That has some news outlets linking the  19-25 predicted named storms to Earth’s future—even warmer—global climate. The future looks like it will indeed bring high levels of overall “activity” due to the intense, damaging hurricanes of a warming world (regardless of whether the frequency of storms overall changes). And, of course, settling into a new “norm” isn’t going to happen while warming is ongoing. But the huge number of storms forming? That’s a lot of what the public takes away from the forecast, and that profusion of named storms is not projected to be characteristic of seasons to come.
As we blogged here in May, recent research published in the Bulletin of the American Meteorological Society finds there’s no evidence to support an increasing trend in tropical cyclone frequency.
NOAA-2020-outlook-update2In that assessment of the current literature, Tom Knutson (NOAA) and other top tropical experts reviewed a number of peer-reviewed studies and determined that a majority found the numbers of named storms actually decrease in climate projections as we move deeper into this century. But there was no consensus among the authors to either support or refute those studies since their research also showed that “there is no clear observational evidence for a detectable human influence on historical global TC frequency.”
Their assessment did find that we can expect stronger and wetter hurricanes in our warming world and, notably, a possible uptick in the number of intense (Category 4 and 5) hurricanes. It’s these storms that have Knutson and his colleagues most concerned since a majority of hurricane damage is done by the big ones. Their increase is alarming even if the number of storms goes down.
Notable with this week’s forecast update is a prediction close to record territory. “We’ve never forecast up to 25 named storms” before—more than twice a season’s typical 12—noted Jerry Bell, lead seasonal hurricane forecaster at NOAA’s Climate Prediction Center. He went on to say there will be “more, stronger, and longer-lived storms than average” in the Atlantic Basin, which includes the Caribbean Sea and Gulf 0f Mexico. In an average season there are six hurricanes,  and three of those grow into major hurricanes.

The Forecast for Huge Numbers of Hurricanes in 2020: Not a “New Normal”

Thursday NOAA updated its forecast to an “extremely active” Atlantic hurricane season. That has some news outlets linking the  19-25 predicted named storms to Earth’s future—even warmer—global climate. The future looks like it will indeed bring high levels of overall “activity” due to the intense, damaging hurricanes of a warming world (regardless of whether the frequency of storms overall changes). And, of course, settling into a new “norm” isn’t going to happen while warming is ongoing. But the huge number of storms forming? That’s a lot of what the public takes away from the forecast, and that profusion of named storms is not projected to be characteristic of seasons to come.

As we blogged here in May, recent research published in the Bulletin of the American Meteorological Society finds there’s no evidence to support an increasing trend in tropical cyclone frequency.

NOAA-2020-outlook-update2In that assessment of the current literature, Tom Knutson (NOAA) and other top tropical experts reviewed a number of peer-reviewed studies and determined that a majority found the numbers of named storms actually decrease in climate projections as we move deeper into this century. But there was no consensus among the authors to either support or refute those studies since their research also showed that “there is no clear observational evidence for a detectable human influence on historical global TC frequency.”

Their assessment did find that we can expect stronger and wetter hurricanes in our warming world and, notably, a possible uptick in the number of intense (Category 4 and 5) hurricanes. It’s these storms that have Knutson and his colleagues most concerned since a majority of hurricane damage is done by the big ones. Their increase is alarming even if the number of storms goes down.

Notable with this week’s forecast update is a prediction close to record territory. “We’ve never forecast up to 25 named storms” before—more than twice a season’s typical 12—noted Jerry Bell, lead seasonal hurricane forecaster at NOAA’s Climate Prediction Center. He went on to say there will be “more, stronger, and longer-lived storms than average” in the Atlantic Basin, which includes the Caribbean Sea and Gulf 0f Mexico. In an average season there are six hurricanes,  and three of those grow into major hurricanes.

Isaias' Forecast Rains, Evaluated Through the New ERM Perspective

Tropical Storm Isaias is soaking the Mid-Atlantic states with what is expected to be three times as much rain as is typical for the area. Today’s heaviest tropical showers could trigger potentially deadly flash floods.
The projection is the finding of a new Intuitive Metric for Deadly Tropical Cyclone Rains, which we blogged about on The Front Page in June. The extreme rainfall multiplier (ERM) used the quantitative precipitation forecast (QPF) from the Storm Prediction Center last night to generate an ERM forecast for Isaias.
Isaias
“Since Isaias is a fast-moving storm (currently moving NNE at 23 mph), the heaviest rain is forecast to fall with[in] a 24-hour period today (Aug 4)”, wrote the study’s lead author, Christopher Bosma, a Ph.D. student at the University of Wisconsin-Madison, in a-pre-dawn e-mail. “Peak rainfall totals are projected to be just over 6 inches (approx. 150 mm), mostly in a narrow region just south of the DC Metro [area].”
In contrast, the region’s heaviest single-day, 2-year rainfall event is a bit more than 50 mm. Bosma uses that comparison in generating an ERM around 2.86 (152 mm / 53 mm). Rainfall may exceed the projections, but that gives a rough idea of how the storm compares to others in residents’ recent memory.
According to the study, which was published in the Bulletin of the American Meteorological Society in May, the average value of an ERM in U.S. landfalling hurricanes and tropical storms is 2.0. ERMs can hindcast the severity of precipitation for such storms, like 2017’s Hurricane Harvey. Harvey deluged Texas with as much as 60 inches of rain and reached an ERM of 6.4—the highest calculated.
Those having lived in the D.C. area in the early 2000s might recall a tropical storm that Bosma says is comparable to Isaias: Isabel. After landfall in eastern North Carolina as a Cat. 2 hurricane the morning of September 18, 2003, it barreled north-northwest through the Mid-Atlantic delivering flooding rains and damaging winds that night.
“Isabel was also a fast mover at landfall, and was responsible for similar one-day rain totals of just over 6 inches, based on CPC-Unified gauge-based gridded data,” Bosma wrote.” The peak ERM for Isabel was 2.8. One thing to note from Isabel is that localized rainfall totals were higher in some spots, particularly in the mountains of Virginia, highlighting the threat of localized flash flooding that might also be present today with Isaias.”
Isabel
Indeed, flash flood warnings were issued all across the interior Mid-Atlantic this morning. This was despite drought conditions in parts of the area.
Bosma and colleagues Daniel Wright (UW-Madison), J. Marshall Shepherd (University of Georgia), et al., created the ERM metric to focus on the deadly hazard of extreme tropical cyclone rainfall. Getting word out about the threat using only the wind-based Saffir-Simpson Scale “was a problem brought to light with Hurricanes Harvey and Florence,” Shepherd says.
Wright also in an e-mail last night stated that for Isaias in and around Washington, D.C., it’s “a fairly large amount of rain, though certainly not unprecedented for the region.”
Recurrence

Isaias’ Forecast Rains, Evaluated Through the New ERM Perspective

Tropical Storm Isaias is soaking the Mid-Atlantic states with what is expected to be three times as much rain as is typical for the area. Today’s heaviest tropical showers could trigger potentially deadly flash floods.

The projection is the finding of a new Intuitive Metric for Deadly Tropical Cyclone Rains, which we blogged about on The Front Page in June. The extreme rainfall multiplier (ERM) used the quantitative precipitation forecast (QPF) from the Storm Prediction Center last night to generate an ERM forecast for Isaias.

Isaias

“Since Isaias is a fast-moving storm (currently moving NNE at 23 mph), the heaviest rain is forecast to fall with[in] a 24-hour period today (Aug 4)”, wrote the study’s lead author, Christopher Bosma, a Ph.D. student at the University of Wisconsin-Madison, in a-pre-dawn e-mail. “Peak rainfall totals are projected to be just over 6 inches (approx. 150 mm), mostly in a narrow region just south of the DC Metro [area].”

In contrast, the region’s heaviest single-day, 2-year rainfall event is a bit more than 50 mm. Bosma uses that comparison in generating an ERM around 2.86 (152 mm / 53 mm). Rainfall may exceed the projections, but that gives a rough idea of how the storm compares to others in residents’ recent memory.

According to the study, which was published in the Bulletin of the American Meteorological Society in May, the average value of an ERM in U.S. landfalling hurricanes and tropical storms is 2.0. ERMs can hindcast the severity of precipitation for such storms, like 2017’s Hurricane Harvey. Harvey deluged Texas with as much as 60 inches of rain and reached an ERM of 6.4—the highest calculated.

Those having lived in the D.C. area in the early 2000s might recall a tropical storm that Bosma says is comparable to Isaias: Isabel. After landfall in eastern North Carolina as a Cat. 2 hurricane the morning of September 18, 2003, it barreled north-northwest through the Mid-Atlantic delivering flooding rains and damaging winds that night.

“Isabel was also a fast mover at landfall, and was responsible for similar one-day rain totals of just over 6 inches, based on CPC-Unified gauge-based gridded data,” Bosma wrote.” The peak ERM for Isabel was 2.8. One thing to note from Isabel is that localized rainfall totals were higher in some spots, particularly in the mountains of Virginia, highlighting the threat of localized flash flooding that might also be present today with Isaias.”

Isabel

Indeed, flash flood warnings were issued all across the interior Mid-Atlantic this morning. This was despite drought conditions in parts of the area.

Bosma and colleagues Daniel Wright (UW-Madison), J. Marshall Shepherd (University of Georgia), et al., created the ERM metric to focus on the deadly hazard of extreme tropical cyclone rainfall. Getting word out about the threat using only the wind-based Saffir-Simpson Scale “was a problem brought to light with Hurricanes Harvey and Florence,” Shepherd says.

Wright also in an e-mail last night stated that for Isaias in and around Washington, D.C., it’s “a fairly large amount of rain, though certainly not unprecedented for the region.”

Recurrence