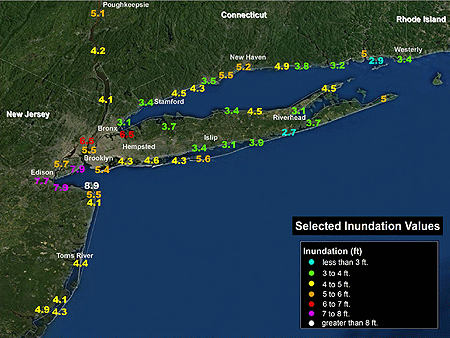
The National Hurricane Center released its post-storm report on Hurricane Sandy this week, confirming the many nuances of the late-season monster storm we already knew. Yet it’s the details, provided by scientists attuned to getting the minutiae right, that make the report an inviting read.
For starters, the NHC report confirms that Sandy wasn’t a hurricane at landfall. Its core convection collapsed as the center of the storm moved west of the warm waters of the Gulf Stream—the same warm waters that earlier on the day of landfall (October 29, 2012) cranked up Sandy’s winds to 100 mph as the center closed in on New Jersey. Cold air wrapping into Sandy’s center contributed to the collapsing convection, and this structural change transitioned Sandy from tropical to extratropical just 50 miles offshore of Atlantic City.
Post analysis of the storm’s intensity in the Caribbean also explains why NHC has now upgraded Sandy to a Category 3 “major” hurricane with 115 mph winds from Category 2, which at the time had been considered the peak classification prior to landfall in southeastern Cuba. The destruction wrought there, described as “especially severe,” included more than a quarter-million homes damaged and 17,000 sheared to pieces by the extreme winds. Gusts topped 110 mph before disabling the anemometer in Santiago de Cuba, the island nation’s second-largest city, and reached an incredible 165 mph at Gran Piedra (“Big Rock,” elev. 2,000 feet) in the national park east of the city. Sandy killed 11 people in Cuba, an unusually high number in a nation that has weathered numerous ferocious hurricanes with lesser loss of life. It was a testament to Sandy’s fury.
Additionally, the report describes changes proposed to NHC’s watch/warning criteria. If adopted, they will address limitations to the use of tropical storm and hurricane watches and warnings when tropical cycl0nes transition to extratropical (i.e., non-tropical or “post tropical”) storms. Facing the potential for Hurricane Sandy to make such a transition prior to striking the Northeast, NHC opted not to issue hurricane watches and warnings north of North Carolina because the transition would force NHC to discontinue them even though the threat for severe wind and tidal conditions remained, which “would cause an unacceptable level of confusion and disruption during critical periods of preparation that included evacuations.” The decision was widely criticized and cited as contributing to the large number of deaths due to storm surge flooding and falling trees in and around New York City.
The report has much more, including details about the record storm tides in New York City, New Jersey, and Connecticut, flooding rain in the mid-Atlantic states, and snow in the Appalachians, as well as a breakdown of U.S. deaths and an abundance of observations.
Town Hall Meeting on Sandy
Recordings of the the presentations made at the AMS Town Hall Meeting on Hurricane Sandy at the Annual Meeting in Austin are now available.
Hurricane Sandy Introduction
Tanja Fransen, NOAA/NWS, Glasgow, Montana
Introduction to Sandy and the Major Impacts
Louis W. Uccellini, NOAA/NWS/NCEP, Camp Springs, Maryland
Hurricane Sandy: Hurricane Wind and Storms Surge Impacts
Richard D. Knabb, NOAA/NWS/NHC, Miami, Florida
Post-Tropical Cyclone Sandy: Rain, Snow and Inland Wind Impacts
David Novak, NOAA/NWS/Hydrometeorological Prediction Center, College Park, Maryland
A Research-Community Perspective of the Life Cycle of Hurricane Sandy
Melvyn A. Shapiro, NCAR, Boulder, Colorado
Communicating the Threat to the Public through Broadcast Media
Bryan Norcross, The Weather Channel, Atlanta, Georgia
Following the Storm through Social Media
Jason Samenow, Washington Post, Washington, D.C.; and Andrew Freedman, Climate Central, New York, N.Y.
Storm Response in New York and New Jersey
Eric Holthaus, The Wall Street Journal, New York, N.Y.
hurricanes
Sandy at the AMS Meeting: A Study in Adaptation, An Opportunity to Participate
by Tanja Fransen, NOAA
Ninety-three. That is how many annual meetings the American Meteorological Society has hosted. Planning for an annual conference can take years, from selecting the location, securing the event center and hotels, to selecting the organizing committee. The organizing committee then decides upon a theme at least 15-18 months in advance. Individual conference organizers have their “calls for papers” ready nearly 14 months in advance. Presenters have to have their abstracts submitted nearly 5 months before the annual meeting.
So…what happens when you have an event that is the magnitude of Hurricane/Post-Tropical Storm Sandy after all the deadlines have passed? You adapt and overcome.
That is what happened this year. Even the Major Weather Impacts Conference, which has a later abstract deadline than most conferences, was finalized a week before Sandy become one of the most significant events in decades. Many individuals quickly realized the importance of including Sandy at the 2013 Annual Meeting, and a committee was organized. Emails started flying back and forth, discussions were occurring on message boards and social media, and ideas were flowing, to the tune of hundreds of emails, phone calls, and social media messages.
Trying not to conflict with other conferences where committees had spent over a year planning them, AMS recommended a Town Hall Session to introduce Sandy formally into the 2013 AMS meeting. And so it will be, 7:30 to 9:30 p.m. on Monday, January 7, in Ballroom E at the Austin Convention Center. Committee organizers received feedback from many sources, and in the end, decided that invited speakers would discuss the major impacts of Sandy, the scientific issues, the warnings process, and more. The list of speakers (below) is diverse, representing, for example, NOAA, NCAR, the Capital Weather Gang, the Wall Street Journal.
Over the next few months, as further discussion, research and assessments are conducted on the meteorology, climatology, communication, preparedness, response and recovery of the event, other opportunities will keep Sandy in the spotlight. That includes conferences from within the AMS, such as the 19th Conference on Atmospheric and Oceanic Fluid Dynamics from June 17-21, 2013, in Newport, Rhode Island, and the 41st Broadcast Meteorology Conference /2nd Conference on Weather Warnings and Communication being held from June 16-28, 2013, in Nashville, Tennessee, as well as the 2014 Annual AMS Meeting in Atlanta, Georgia, in February 2014. The theme for the 2014 Annual Meeting nicely encompasses Sandy in “Extreme Weather – Climate and the Built Environment: New perspectives, opportunities and tools.” Other groups, organizations and agencies will also keep those discussions in the forefront.
We know there will be many questions that people will have for the presenters in the Town Hall Meeting in Austin. With a short time frame to discuss them, attendees are asked to use Twitter to send the questions they have; the hashtag is #AMSSandy. (Also, in general follow #AMS2013 for tweeting related to the Annual Meeting.) Organizers will group the questions into categories, and ask the top 3-5 questions, depending on time, to the presenters.
Here’s the scheduled agenda at this time:
7:30 PM. Introduction to Sandy and the Major Impacts — Louis W. Uccellini, NOAA/NWS/NCEP, Camp Springs, MD
7:45 PM. Hurricane Sandy: Hurricane Wind and Storms Surge Impacts — Richard D. Knabb, The Weather Channel Companies, Atlanta, GA
8:00 PM. Post-Tropical Cyclone Sandy: Rain, Snow and Inland Wind Impacts — David Novak, NOAA/NWS/Hydrometeorological Prediction Center, College Park, MD
8:15 PM. A Research-Community Perspective of the Life Cycle of Hurricane Sandy — Melvyn A. Shapiro, NCAR, Boulder, CO
8:30 PM. Communicating the Threat to the Public through Broadcast Media — Bryan Norcross, The Weather Channel, Atlanta , GA
8:45 PM. Following the Storm through Social Media — Jason Samenow, Washington Post, Washington, DC; and A. Freedman
9:00 PM. Storm Response in New York and New Jersey — Eric Holthaus, The Wall Street Journal, New York, NY
9:15 PM: Q&A: Moderators will present 3-5 questions submitted through Twitter to the panelists.
The Silver Lining of Disaster
There aren’t many reasons to consider a volcanic eruption a positive event, but if results from recent research by Amato Evan of the University of Virginia are confirmed, residents of hurricane-prone areas, at least, may have a new reason to welcome volcanoes. Evan studied the effects of two major volcanic events–the 1982 discharge of El Chichón and Mount Pinatubo’s eruption in 1991–on Atlantic hurricane activity. He found that hurricane frequency and intensity both decreased by about 50% in the year following the eruptions, as compared to the year preceding the eruptions. Smaller decreases were still detected two and three years after the eruptions.
The finding is not entirely surprising. Major volcanic eruptions can expel large amounts of sulfur dioxide into the stratosphere; the gas then reacts with water to form sulfuric acid aerosols, which reflect light and absorb radiation, cooling tropical ocean waters while warming the lower stratosphere. The combination of these changes would be expected to dampen the frequency, duration, and power of hurricanes, which thrive on the temperature contrast between the sea surface and the atmosphere high above.
Evan’s study (subscription only) runs into complications that will need to be addressed before the volcano-hurricane link is accepted. For instance, both the El Chichón and Mount Pinatubo eruptions were also followed by strong El Niño events, which by themselves are expected to suppress hurricane activity. (On the other hand, some research suggests that El Niños can be caused by volcanic eruptions.) Further study of the dynamics in play is necessary.
Convincing people on the coasts that hurricanes themselves are a positive force in their lives may be a bit more difficult. At the annual Governor’s Hurricane Conference in Florida last week, however, attendees looked back at the 20-year legacy of 1992’s Hurricane Andrew with mixed feelings. While it is still the costliest disaster in the state’s history, the storm brought about many significant positive changes. For one, the state government revised emergency management funding so that each county could have a full-time emergency manager on staff. The institutionalization of emergency plans and outreach to residents has paid off repeatedly in subsequent hurricanes. Hurricane Andrew also led to stiffer enforcement of building codes and rethinking of the ways buildings must withstand high winds.
All in all, the silver lining of disaster isn’t great consolation, but the conference, like Evan’s research, gives hope for continued improvement in hurricane forecasting, preparedness, and response.
NOAA Appoints New Director for Hurricane Center
Rick Knabb has been named the new director of NOAA’s National Hurricane Center. He replaces outgoing director Bill Read and begins June 4, days after the official start of the six-month Atlantic hurricane season on June 1.
Well-known as The Weather Channel’s “hurricane expert” for the last two hurricane seasons, Knabb is returning to familiar territory. He was a senior hurricane specialist from 2005 to 2008, and the Center’s science operations officer beginning in 2001.

“I’m ready to reunite with the talented staff at the National Hurricane Center and to work with all of our partners to prepare everyone for the next hurricane,” said Knabb. “Personal preparedness will be critically important, including for my own family and home.”
Born just outside of Chicago, Knabb grew up in Coral Springs, Florida, near Fort Lauderdale, and in Katy, Texas in suburban Houston. He earned a bachelor’s degree in Atmospheric Science from Purdue University and holds a master’s degree and Ph.D. in Meteorology from Florida State University.
Knabb left the Hurricane Center in Miami and became deputy director of the Central Pacific Hurricane Center (CPHC) in Honolulu, Hawaii, for a year before arriving at The Weather Channel. The CPHC oversees tropical cyclone forecasts and warnings from 140° west longitude westward to the International Dateline, including all of the Hawaiian Islands.
A member of the AMS, Knabb also serves on the AMS Board for Operational Government Meteorologists. He has published numerous papers in AMS and other scientific journals and has given presentations on hurricanes and tropical weather at AMS and related conferences. His expertise in communicating has been honed these last two years at The Weather Channel.
“Rick personifies that calm, clear, and trusted voice that the nation has come to rely on,” says NOAA Administrator Jane Lubchenco. “Rick will also lead our hurricane center team and work closely with federal, state and local emergency management authorities to ensure the public is prepared to weather the storm.”
Video Whirls Thru Hyperactive Hurricane Season
NOAA recently posted its annual video compilation of the entire 2010 Atlantic hurricane season, and it’s impressive. Crammed into just under 5 fast-paced minutes, you’ll see 6 months of tropical and mid-latitude weather seamlessly wax, wane, dip, and swirl across your computer screen. It stars this year’s 19 named storms, from Alex to Tomas, and even a few Eastern Pacific whirls. Can you spot them all? (Occasional names following the organized cloud clusters will help you.)
NOAA’s Environmental Visualization Lab produced the video. You can view the larger version on YouTube (where the tiny storm names are easier to see).
An historical overview of the 2010 season is available from NOAA here.
For more detail, the National Hurricane Center has archived the season’s tropical cyclone advisories, and will eventually post summary reports of all of the year’s named hurricanes and tropical storms. New this year, you can view the individual storm tracks in Google Earth; from the summary reports page, click on the KMZ link after each storm name to launch Google Earth, and then interact by clicking a storm position to get specific advisory information. (What’s that you say? You don’t have Google Earth?? Well, just download it!)
A Slow Start, but Gaining Fast
Tropical Storm Lisa became the 12th named storm in the Atlantic Basin this week in what has suddenly become the active 2010 hurricane season that forecasters months ago had predicted. Nine of those twelve storms formed since August 21, with five of them becoming hurricanes. Before that, only one of the first three named storms (Alex) even reached hurricane strength. By contrast, 2005 (9 out of 28) and 2008 (6 out of 16) both had numerous storms form before August 20. Why the delay this year? According to a story in Newscientist.com, a mass of hot, dry air over the oceans stunted the formation of tropical storms. Scientists traced this dry air to a massive ridge of high pressure that sat for months over Europe and Asia, causing an intense heatwave in Russia and severe monsoon rains in Pakistan this summer that killed thousands of people. But just as mid-August arrived, when the typical height of Atlantic hurricane activity is imminent, things changed. As the Weather Underground’s Jeff Masters wrote in his blog on August 17:
Vertical instability, which was unusually low since late July, has now returned to near normal levels over the tropical Atlantic, though it remains quite low over the rest of the North Atlantic. Instability is measured as the difference in temperature between the surface and the top of the troposphere (the highest altitude that thunderstorm tops can penetrate to). If the surface is very warm and the top of the troposphere is cold, an unstable atmosphere results, which helps to enhance thunderstorm updrafts and promotes hurricane development. Since SSTs in the Atlantic were at record highs and upper tropospheric temperatures were several degrees cooler than average in July, enhancing instability, something else must have been going on to reduce instability. Dry air can act to reduce instability, and it appears that an unusually dry atmosphere, due to large-scale sinking over the Atlantic, was responsible for the lack of instability.
Not until the heat wave broke near the end of August did the tropical storms really begin to form in earnest, with four storms (Danielle, Earl, Fiona, and Gaston) arising just between August 21 and September 1. And spurred by those record-high SSTs mentioned by Masters, the 2010 season has not only produced 12 named storms and 6 hurricanes, but 5 major hurricanes–four of them Category 4–making that slow start seem like a distant memory. To put this season in historical perspective, there have been yearly averages of 14 named storms, 8 hurricanes, and 4 major hurricanes since the current active Atlantic hurricane period began in 1995. This season is just one major hurricane away from moving into a 7-way tie for 3rd-most major hurricanes in a season, topped only by the 7 major hurricanes in 1961 and 2005 and 8 in 1950 (lists of most active seasons in various categories can be found here).

How Much Was That Forecast Worth?
Despite the general good fortune that the storm stayed out at sea, there are plenty of grumblings about the cost of Hurricane Earl and more specifically the cost of preparing for it:
Last week’s storm was forecast to be the strongest to hit Long Island’s East End in nearly twenty years. And to handle possible outages, the Long Island Power Authority brought in 1,600 workers from out of state, at an estimated cost of $30 million. LIPA’s budget — already reeling from combating four major storms earlier this year — is now even further in the red.
(Fortunately, LIPA wisely understands the risks that Earl posed:
However, because the storm was supposed to hit such a wide area, LIPA says if it had to do it all over again, it still would’ve brought in those extra workers.)

And further north:
Airlines canceled dozens of flights into New England, and Amtrak suspended train service between New York and Boston….Massachusetts officials estimated that Cape Cod lost about 10 percent of its expected Labor Day weekend business, but were hopeful that last-minute vacationers would make up for it. Gov. Deval Patrick walked around Chatham on Saturday morning, proclaiming, “The sun is out and the Cape is open for business.”
So, as a palliative while people continue to grouse about paying the costs of meteorological uncertainties, read Mike Smith’s post about the savings this time when 450 miles of coastal warnings were issued compared to the much broader-brush (1,500 coastline miles warned) for Hurricane Floyd in 1999.
Instead of warning the entire East Coast as we had to during Floyd, the science of meteorology correctly identified that only the two areas (outer banks and far east Massachusetts) were at risk and warned accordingly. The forecast change in Earl’s direction of movement and rate of weakening were both remarkably good considering this forecast was two days out.
Taking NOAA’s calculations for evacuation costs per mile of coastline, and a reduction of 1,050 miles of warnings in similar situations, and do the math:
OK, now take those 1,050 miles and multiply them by a conservative figure of $700,000 in savings for each mile that correctly was not warned = $735 million dollars! ….And, when you figure in the value-added private sector hurricane forecasts issued by companies like WeatherData and its parent company AccuWeather, the savings grow further, perhaps approaching a billion dollars in total when the correct landfall forecast for Canada is factored in.
Clearly this depends on whether people actually evacuated based on the warnings, but the progress is clear, nonetheless, as are the positive benefits of recent improvements in track forecasts.
Inside Earl
NASA’s GRIP mission (Genesis and Rapid Intensification Processes) is sending aircraft into Hurricane Earl, coming up with some wonderful imagery from almost 20,000 meters above the ocean surface. Here’s how the eye looked from the Global Hawk unmanned aircraft at 9:05 a.m. Eastern, Thursday:

For more on GRIP, Earl, the Global Hawk, and the importance of having drones that can fly up to 26 hours in a single mission, this video interview with Jeff Halverson gives some answers with nice imagery: