Recent Trends in Tropical Cyclone Fatalities in the United States

Satellite photo of Hurricane Gonzalo (a ball of swirling clouds) over the Atlantic near Puerto Rico; other larger cloud systems are seen in the upper part of the photo, eclipsed by the curvature of the Earth in the top right. Photo taken by GOES East satellite at 1445Z on October 14, 2014. Photo credit: NOAA.

New data from the past ten years reveal increased prominence of freshwater floods and indirect fatalities in hurricane deaths

Guest post by Dr. Michael Brennan, Director, National Hurricane Center; Daniel Brown, Warning Coordination Meteorologist, National Hurricane Center; and Leah Pope, Hydrologist, Northwest River Forecast Center

The National Hurricane Center’s mission to “save lives and mitigate property loss” is not just achieved by issuing effective watches, warnings, and forecasts of tropical cyclones. We also spend a large portion of the “offseason” educating the public, emergency managers, and our media partners about the risks that tropical cyclones (TCs), including hurricanes, pose to life and property in the United States. Those include natural hazards such as storm surge, wind, and rip currents, and also includes dangerous conditions in the aftermath of a landfalling tropical cyclone, which may lead to “indirect” fatalities. These are deaths which are not directly due to the forces of the storm, but which would not otherwise have occurred. NHC routinely compiles and assesses TC-related information through vehicles such as our Tropical Cyclone Reports (TCRs). Data from the most recent decade reveal that fatality trends may be changing.  

Note:  The fatality data presented here do not include any fatalities from Hurricane Maria in Puerto Rico, since there was no specific, definitive cause provided for those deaths.

Direct Fatalities

Aerial photo of a peninsula/barrier island that has been breached by a storm surge. Sand, buildings, and other structures have been washed away or damaged, including visible broken lines of sandbags, a damaged bridge, damaged trees, and obliterated buildings; only one house appears to still be standing.
Storm surge damage from Hurricane Ike, Bolivar Peninsula, Texas, 2008. Photo credit: NOAA.

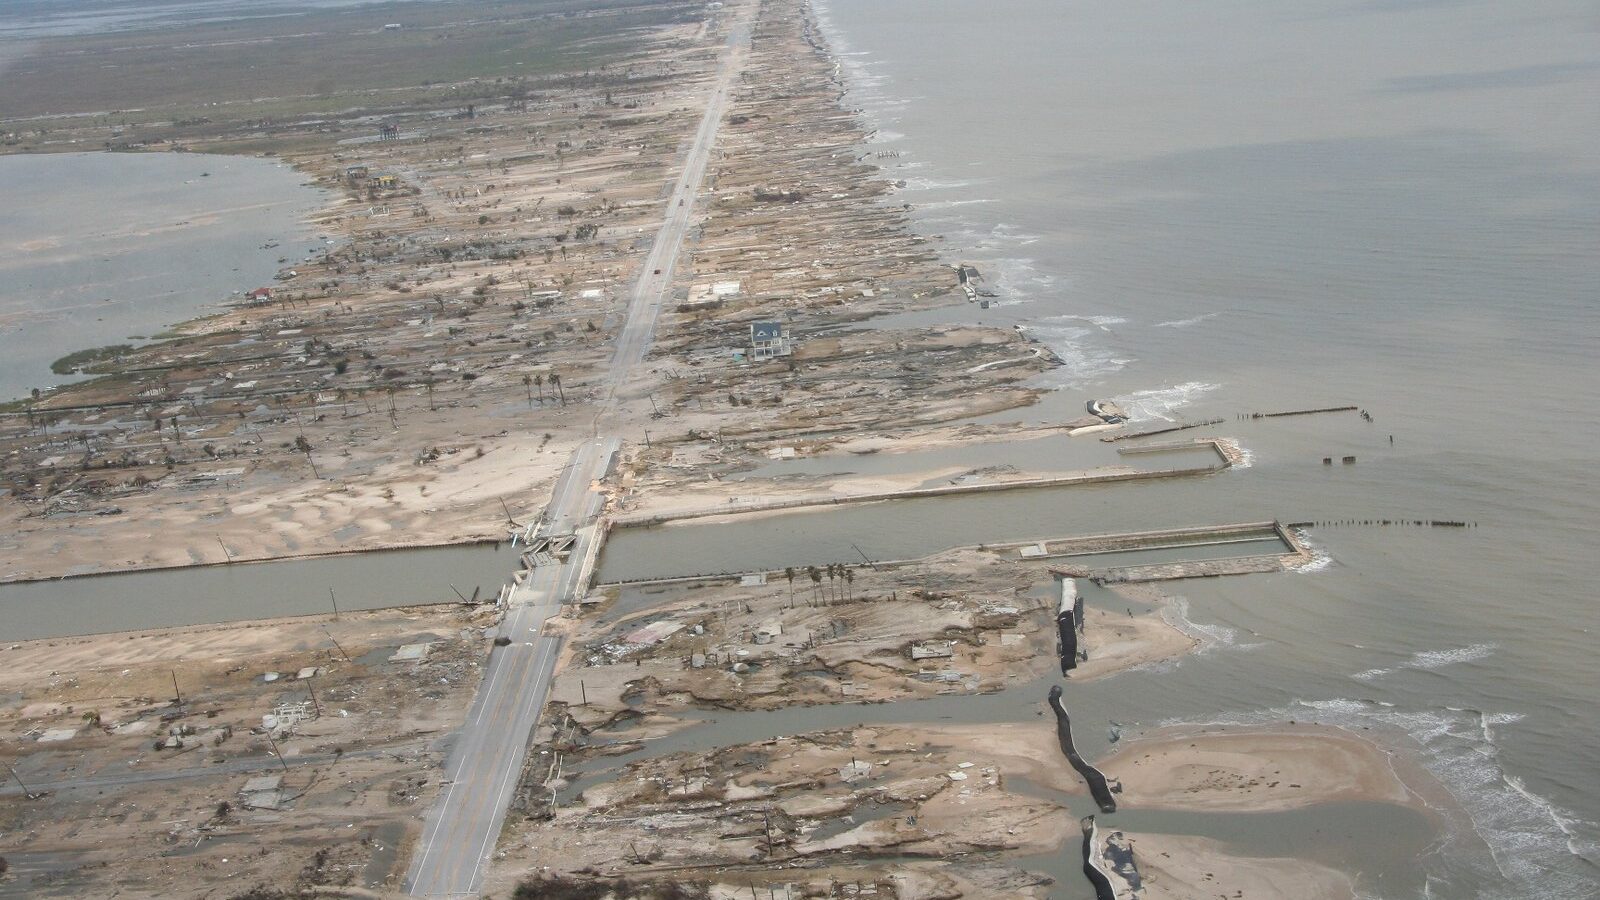
Previous studies by Rappaport (2014) and Rappaport and Blanchard (2016) summarized direct and indirect fatality data from Atlantic basin tropical cyclones in the United States for the 50-year period 1963–2012. During that period, nearly 9 out of 10 tropical cyclone-related direct deaths in the United States were due to water. Storm surge was responsible for nearly half (49%) of the direct deaths, and over one-quarter (27%) were due to rainfall-induced freshwater flooding.  

In response, the National Weather Service (NWS) and NHC worked to improve outreach, education, and communication of storm surge and rainfall hazards. We introduced new real-time storm surge maps in 2014, and in 2017 introduced a storm surge watch/warning that highlights the risk of life-threatening storm surge inundation. 

New Data Suggest Changing Trends

Since 2012, the United States has experienced 21 hurricane landfalls, including 8 major hurricanes, and more than 20 tropical storm landfalls. Eighteen of these hurricane landfalls, including all of the major hurricanes, occurred during 2017–22 after a relatively quiet period. Given the significant number of tropical cyclone landfalls in recent years, and increased deployment of warnings around the storm surge hazard, NHC examined and compared fatality data from the most recent 10-year period (2013–22) to the earlier studies.

Hazard % of direct fatalities from this cause
(1963–2012)
% of direct fatalities from this cause
(2013–2022)
Storm Surge49%11%
Freshwater Flooding27%57%
Wind8%12%
Surf/Rip Currents6%15%
Offshore Marine Incidents6%3%
Tornadoes3%2%
Other1%1%
Note: Due to rounding, numbers may not add up to 100%.

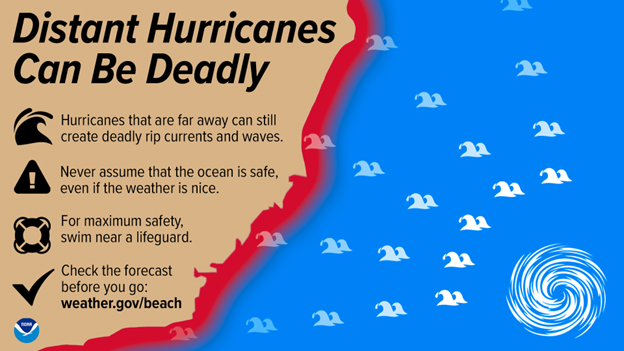
During the most recent 10-year period in the United States, about 57% of direct tropical cyclone deaths were due to drowning from freshwater (rainfall) flooding. Surf and rip current fatalities have become an increasing threat, making up about 15% of direct fatalities in the past decade. These fatalities often occur one or two at a time from distant storms hundreds of miles offshore. Florida, North Carolina, and New Jersey experienced the highest number of TC-related surf and rip current fatalities. Storm surge and wind-related deaths account for 11% and 12% of the direct fatalities, respectively.  

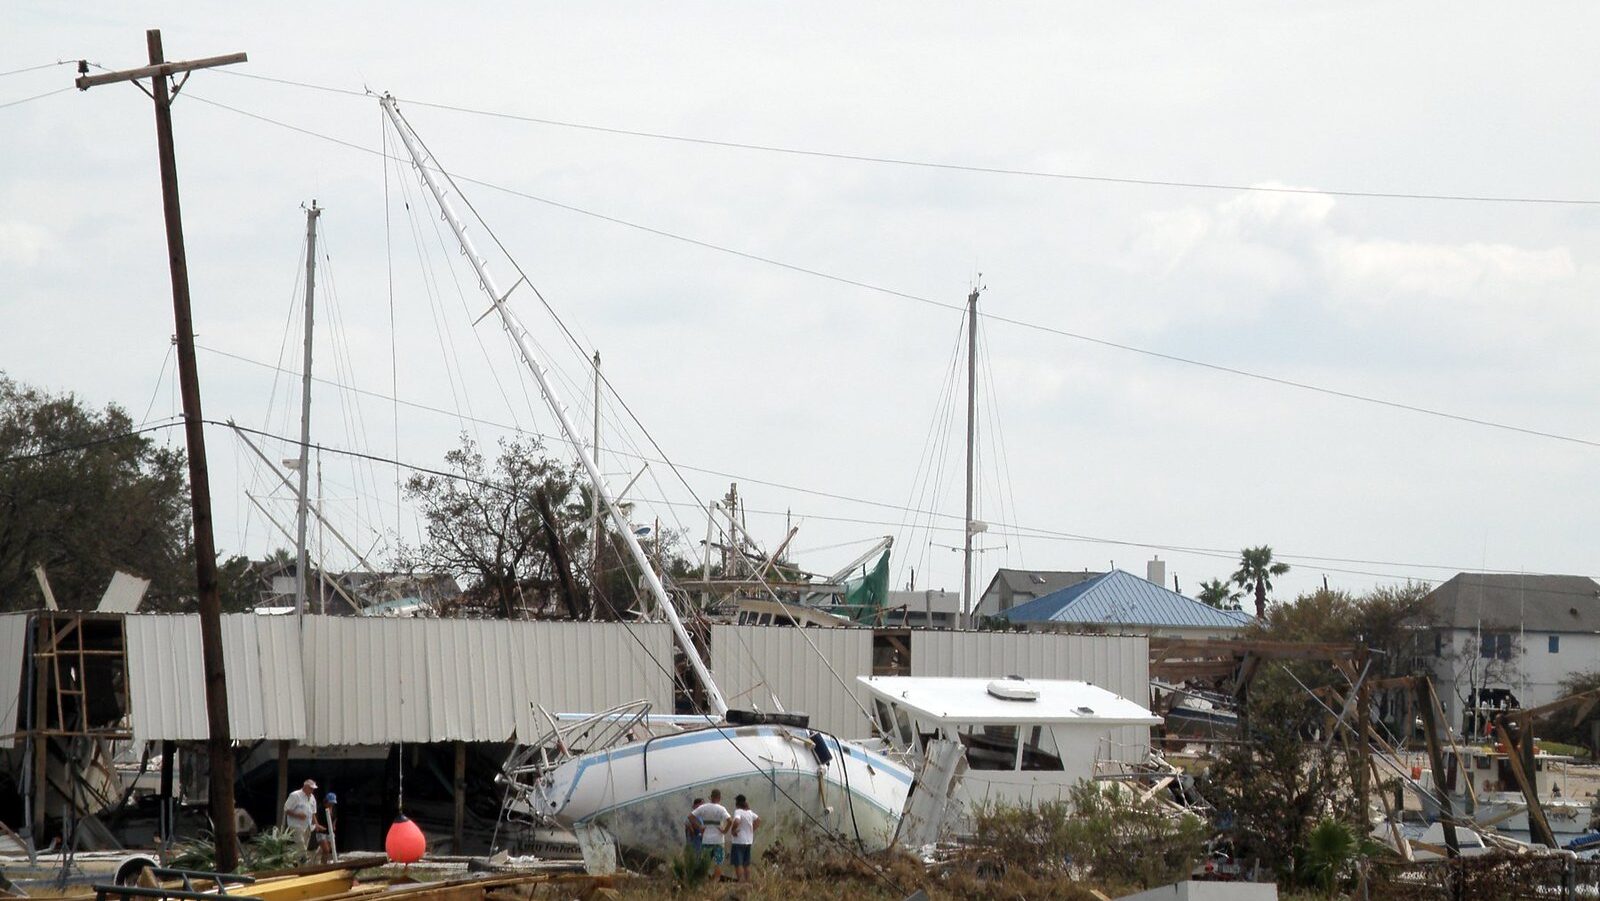
Every hurricane is different, however. Hurricane Harvey in 2017 had the largest number of direct deaths—68, 65 of which were due to freshwater flooding in Texas—in the past decade. Hurricane Ian (2022) was the second deadliest with 66 direct fatalities, 41 of which were due to storm surge in Florida. More than 65% of those who died from direct causes were men, with about 60% of the victims over the age of 60.

Indirect Causes

Image of a boat stranded on land, leaning against a wind-destroyed structure and a power line, amid other debris, including destroyed buildings and cars. Three people stand next to the boat observing the damage.
Aftermath of Hurricane Ike in Galveston, Texas, 2008. Photo credit: NOAA.

The recent study revealed that over the past 10 years there has been nearly an equal number of indirect deaths as direct fatalities. Indirect fatalities are due to a wide range of causes, including traffic accidents (16%), preparation/cleanup accidents (15%), carbon monoxide poisoning (12%), lack of medical care (11%), power problem/electrocution (11%), post-storm heat deaths (9%), unknown causes (9%), cardiac-related deaths (7%), and evacuation-related deaths (5%). 

The largest number of indirect deaths in the past decade occurred in association with Hurricanes Ian (90), Irma (82), Michael (43), Harvey (35), and Laura (34). Most (75%) of the indirect deaths are associated with major hurricane landfalls, which leave communities very vulnerable and often with long-duration, widespread power outages. More than half (57%) of the victims were over the age of 60. Younger victims tended to die in vehicle accidents; for older victims, medical-related issues, heat, evacuation, and other accidents were more likely causes of death.

Improving Warnings and Public Understanding

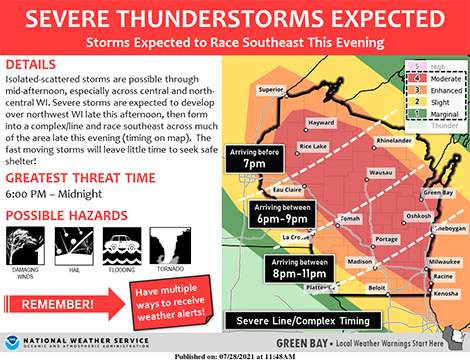
The results of these most recent studies have led the NWS and NHC to increase messaging on the hazards and causes of both direct and indirect fatalities. We continue to highlight rainfall flooding and storm surge risk through the Weather Prediction Center’s Excessive Rainfall Outlook, Flood Warnings from local NWS offices, and increased emphasis on the Storm Surge Warning. These warnings are the loudest “bells” that the NWS can ring during life-threatening flooding. We encourage our media and emergency management partners to work with us to encourage timely public response and personal preparedness ahead of these threats. 

Additionally, with the increased percentage of rip current fatalities associated with high surf and swells from distant hurricanes, the NWS has created new infographics to explain this deadly beach hazard, and is working on graphics to better highlight the threat in real time.

During the highly impactful 2020 hurricane season in the United States, there were more fatalities associated with carbon monoxide poisoning from the improper use of generators than there were from storm surge. After that season, NHC and the NWS developed infographics and worked with media and emergency management partners to highlight that threat. While it is difficult to determine the effectiveness of that messaging, it is encouraging to know that there were no carbon monoxide related-fatalities in the aftermath of Hurricane Ian in 2022 in Florida, despite its devastating impacts and widespread power outages in that state.   

NHC relies on relationships with media, emergency management partners, and the entire weather enterprise to help reach the public before, during, and after tropical cyclone threats. These efforts undoubtedly increase awareness, encourage preparation, and save lives. We hope to continue to improve our messaging and understanding of the threats and causes of injuries and fatalities to better meet our collective mission.  

Visit the National Hurricane Center online.

Header photo: Hurricane Gonzalo in the Atlantic. Photo taken by GOES East satellite at 1445Z on October 14, 2014. Photo credit: NOAA.

This post was invited based on a presentation given by Dr. Brennan at the 50th Conference on Broadcast Meteorology, which took place in Phoenix, Arizona, June 21–23, 2023. The conference was organized by the American Meteorological Society Board on Broadcast Meteorology and chaired by Danielle Breezy and Vanessa Alonso.

Derecho Possible in the Upper Midwest Today

Severe thunderstorms are expected to erupt late this afternoon in the upper Midwest and, according to the Storm Prediction Center (SPC), they could organize into a single, large bowing line capable of widespread damaging winds called a derecho tonight. Last summer a very destructive derecho blitzed Iowa with wind gusts over 100 mph.

SPC Convective Outlook

SPC’s Day 1 Convective Outlook has a large part of Wisconsin in a moderate risk of severe storms, with enhanced and slight risk areas surrounding it extending northwest into Minnesota and southeast into northwest Ohio. Supercell thunderstorms are expected to blossom across northern Minnesota late this afternoon with the threat of large to very large hail and tornadoes as well as damaging winds.

Storms then may grow into a derecho capable of producing a wide swath of wind gusts greater than 75 mph hurricane force as it races southeast across western and southern Wisconsin late today and overnight. Milwaukee is in its potential path and it’s possible the line may reach Chicago before it begins to weaken.
SPC has outlooked the moderate risk area with 45% odds of wind gusts exceeding 50 knots (58 mph), and surrounds that area with a 10 percent probability of wind gusts over 65 knots (74 mph) all the way into southwest Michigan and extreme northern Indiana.

While SPC notes in their morning discussion that there’s uncertainty how far southeast the danger will extend, “activity should expand into an MCS (mesoscale convective system) capable of severe gusts and tornadoes across … southern/eastern Wisconsin this evening, shifting into the southern Lake Michigan and lower Michigan vicinity tonight. A derecho may occur, with embedded channels of hurricane-force gusts.”

But just what exactly is a derecho? And can they be predicted? SPC notes in the same discussion, “Whether or not the timing/location of the upscale storm transition permits the event to be classified officially as a derecho in hindsight, there is strong concern it will have that kind of intense and destructive wind impact for at least a few hours.”

Defining Derechos Is Complicated–Even for Meteorologists, as we noted in a detailed blog post on The Front Page last summer after Iowa’s widespread and costly damaging wind event. They aren’t “inland hurricanes” as they are often described, the post explains, but they can mimic the type of widespread damage seen with hurricane winds.
In their midday Convective Outlook update, SPC cautions that while “most guidance suggests the MCS will weaken late tonight as it moves into a slightly less moist/unstable air mass over MI/IN/OH … if mesoscale organization is sufficiently high, the complex could persist longer than model depictions.”
Have multiple ways to get warnings Weather.gov

Mixed Job News for Early-Career Geoscientists

new survey by the American Geosciences Institute shows that recent graduates in the geosciences are finding employment at the same rates as before the COVID-19 pandemic, but a separate survey from Nature finds that amid tightening funding science postdocs are nervous about ongoing research as well as career opportunities.

The AGI survey covered graduates from the classes of 2018, 2019, and 2020, and found no “deviation from long-term employment trends of recent geoscience graduates.”

As of August 2020, 94% of geoscience graduates who earned their degree between 2014-2018 were employed, while 77% of graduates from 2019 and 44% of graduates from 2020 reported the same. For geoscience graduates who earned their degree this year, 16% of bachelor’s, 57% of master’s, and 91% of doctorates have secured employment.

For comparison, data from the 2013-2018 AGI Geoscience Exit Survey shows that 20% of geoscience graduates secured employment by the time they graduated. This data varied by degree level, with 12% of bachelor’s, 36% of master’s, and 56% of doctorates securing employment by the time they graduated. Only 1% of employed recent geoscience graduates lost their job since February 2020.

AGIfig1

While three-quarters of the still-unemployed graduates of the last three classes were still looking for jobs in the geosciences, half said they were instead, or additionally, now seeking employment outside the field. Of those seeking employment outside the field, more than 80% said this was due to lack of jobs in the geosciences, and about three-quarters felt they did not have sufficient training for the available jobs.

AGIfig22

The AGI employment statistics are provided by geoscience graduate job seekers, part of a series AGI is publishing on the effects of the pandemic in the geosciences. The Nature survey, by contrast, sampled views of postdocs worldwide and “paints a gloomy picture of job-loss fears, interrupted research, and anxiety about the future.” It finds that:

Eight out of ten postdoctoral researchers say that the global coronavirus pandemic has hampered their ability to conduct experiments or collect data. More than half are finding it harder to discuss their research ideas or share their work with their laboratory head or colleagues, and nearly two-thirds believe that the pandemic has negatively affected their career prospects.

The pandemic has shuttered or reduced the output of academic labs globally, slashed institutional budgets and threatened the availability of grants, fellowships and other postdoctoral funding sources. The fallout adds up to a major challenge for a group of junior researchers who were already grappling with limited funds, intense job competition and career uncertainties.

The Nature survey drew responses from 7,670 postdocs working in academia from mid-June through the end of July. Some respondents were selected for follow-up interviews, which “filled in an unsettled, precarious picture of postdoctoral research in the era of coronavirus.”

“The [pandemic] has compounded the pressures that postdocs were already under,” reported one of the interviewees, Hannah Wardill, a cancer researcher at the South Australian Health and Medical Research Institute in Adelaide.


Red Proverb at Morning, Meteorologists Take Warning

Sunset4_IMG_0813 copy

Weather proverbs can be useful indicators of real correlations observed over the centuries, but they can also show unwelcome persistence. The phenomenon is well known: for example, a December 1931 BAMS article referred to a Columbia University study that revealed most high school students had heard the proverb, “When squirrels gather an unusual supply of nuts, it indicates a severe winter”—and 61% of them believed it.

Efforts to confirm or debunk proverbs are also an old tradition. As recorded in the October 1896 Monthly Weather Review, members of the Meteorological Society of France discussed the merits of the popular proverb: ” When it rains on St. Medard’s day it will rain for forty days unless fine weather returns on the day of St. Bernabe.” They found no confirmation of the saying in their data.

In recommending W.J. Humphrey’s 1923 book sorting proverb fact from fiction, Robert deCourcy Ward of Harvard University wrote in BAMS,

There have been several such collections, but there have been practically no serious attempts to separate the “good” from the “bad” proverbs. Many proverbs are merely the relics of past superstitions. Many are useful in one climate and of no use in another land into which they have been imported. Most of our own proverbs came from Europe, or even still farther away, and do not fit into our climatic environment.

Along comes an unusually thorough verification study of Polish weather proverbs in the July 2020 issue of Weather, Climate and Society. Lead author Piotr Matczak (of the Adam Mickiewicz University in Poznań, Poland) and colleagues set their article in the context of the recent, increased interest in integrating traditional knowledge with scientific findings in order to enrich overall climate databases.

The authors searched through 1,940 sayings, mostly looking for if-then logical structure (such as “hot July leads to January frosts”) that suggested predictive power, and narrowed the list to 28 specific enough about temperature to be verified by decades of weather data from observing stations in and around Poland. In many cases, this meant turning subjective descriptions into quantitative categories. For instance, “If Saint Matthew (February 24) does not melt ice, peasants will long puff to warm their cold hands]” was recast as a test: the correlation of maximum air temperature on February 24 below 0°C to mean air temperature for the following two weeks below 0°C.

This proverb proved to be the most accurate of the bunch, fulfilling its predictions 83% of the time. The rest of the sayings were–not so much fantastical as just plain unhelpful. Only 16 of the 28 proverbs showed any forecast skill, and usually quite low skill, which wasn’t necessarily unexpected, since many of the proverbs were essentially extended range forecasts that wouldn’t have been skillful even with modern techniques. Three proverbs, like “If the Marek day (April 25) is threatening with the swelter the Boniface (May 14) freezes” never predicted accurately in the data record. Most of the time the predictive condition occurred, the predicted consequence did not occur (false alarm ratios for most proverbs greatly exceeded 50%).

Including the St. Matthew’s day prediction, only three verified more than 43% of the time: “When Zbigniew and Patrick (March 17) are freezing people’s ears, two more Sundays of winter freezing and snows,” and another for St. Matthew’s day: “If the Matthew day is warm there is a hope for spring.”

There were some interesting shifts in the proverbs’ success rate however that may warrant follow-up research. They did better earlier in the record than in later years, and better in eastern Poland and formerly Polish lands further east. Matczak et al. note,

following the Second World War, Poland was displaced by some 200 km westward, with the population displaced accordingly. Thus, the proverbs may refer to the climate of areas that are more eastward when compared with the current borders of Poland, that is, the areas nowadays in Belarus, Lithuania, and Ukraine.


AMS’s New Culture and Inclusion Cabinet

by Keith L. Seitter, CCM, AMS Executive Director

One of the AMS Core Values is: “We believe that a diverse, inclusive, and respectful community is essential for our science.”

AMS lives this value, which is articulated in the Centennial Update to the AMS Strategic Goals. We work to foster a culture that celebrates our diversity, strives for equity in all we do, and encourages inclusion across all activities so that everyone can experience a sense of belonging in the Society.

To formalize these efforts and provide a clearer path for providing resources toward them, the Council approved the creation of a new entity in AMS in fall 2019. At its meeting this past January, the Council approved the terms of reference for this new component of the Society’s structure and that Dr. Melissa Burt would serve as its first chair. This Culture and Inclusion Cabinet (CIC) has the following charge:

To accelerate the integration of a culture of inclusion, belonging, diversity, equity, and accessibility across the AMS and evaluate and assess progress towards culture and inclusion strategic goals within the Society. Meaningful integration into all areas and components of the AMS will require time and sustained effort. Fully integrating diversity, equity, inclusion, and belonging (DEIB) will result in an organizational culture that is accessible, advances science, serves society, and is responsive to social justice.

The Council designates this new body as a “Cabinet” to reinforce that it is not quite like any of the other entities making up the volunteer structure of the Society (council, commission, board, committee, task force, etc.). The CIC will play a unique role and therefore was given a unique name.

The CIC sits at the highest level of the organizational structure for AMS save the Council itself, to which it reports directly. Being at this level it can more readily ensure that issues of diversity, equity, inclusion, accessibility, social justice, and belonging are addressed throughout all AMS programs and activities.

The CIC does not replace any of the other components of the Society that work in these arenas—most notably the Board on Women and Minorities (BWM), which has a long record of addressing equity and inclusion issues in AMS. The BWM will continue to oversee specific programs aimed at diversity, equity, and inclusion, and will likely expand its role in AMS programs as the CIC helps integrate those efforts more broadly in the Society.

AMS has a strong record of addressing diversity and equity issues and a culture of inclusivity that other organizations could learn from. The creation of the CIC builds on those strengths and puts AMS in a position of leadership among scientific organizations in elevating these issues to the highest levels so that they can be threaded through every program in foundational ways.

For many of us, the sense of belonging in AMS is an important part of what makes the Society so special, and we want everyone in the community to feel that sense of belonging as an intrinsic aspect of the AMS culture. I am confident the new Culture and Inclusion Cabinet will take us there and will assist our entire community in creating an even more inclusive environment—strengthening our enterprise in the process.

AMS's New Culture and Inclusion Cabinet

by Keith L. Seitter, CCM, AMS Executive Director
One of the AMS Core Values is: “We believe that a diverse, inclusive, and respectful community is essential for our science.”
AMS lives this value, which is articulated in the Centennial Update to the AMS Strategic Goals. We work to foster a culture that celebrates our diversity, strives for equity in all we do, and encourages inclusion across all activities so that everyone can experience a sense of belonging in the Society.
To formalize these efforts and provide a clearer path for providing resources toward them, the Council approved the creation of a new entity in AMS in fall 2019. At its meeting this past January, the Council approved the terms of reference for this new component of the Society’s structure and that Dr. Melissa Burt would serve as its first chair. This Culture and Inclusion Cabinet (CIC) has the following charge:

To accelerate the integration of a culture of inclusion, belonging, diversity, equity, and accessibility across the AMS and evaluate and assess progress towards culture and inclusion strategic goals within the Society. Meaningful integration into all areas and components of the AMS will require time and sustained effort. Fully integrating diversity, equity, inclusion, and belonging (DEIB) will result in an organizational culture that is accessible, advances science, serves society, and is responsive to social justice.

The Council designates this new body as a “Cabinet” to reinforce that it is not quite like any of the other entities making up the volunteer structure of the Society (council, commission, board, committee, task force, etc.). The CIC will play a unique role and therefore was given a unique name.
The CIC sits at the highest level of the organizational structure for AMS save the Council itself, to which it reports directly. Being at this level it can more readily ensure that issues of diversity, equity, inclusion, accessibility, social justice, and belonging are addressed throughout all AMS programs and activities.
The CIC does not replace any of the other components of the Society that work in these arenas—most notably the Board on Women and Minorities (BWM), which has a long record of addressing equity and inclusion issues in AMS. The BWM will continue to oversee specific programs aimed at diversity, equity, and inclusion, and will likely expand its role in AMS programs as the CIC helps integrate those efforts more broadly in the Society.
AMS has a strong record of addressing diversity and equity issues and a culture of inclusivity that other organizations could learn from. The creation of the CIC builds on those strengths and puts AMS in a position of leadership among scientific organizations in elevating these issues to the highest levels so that they can be threaded through every program in foundational ways.
For many of us, the sense of belonging in AMS is an important part of what makes the Society so special, and we want everyone in the community to feel that sense of belonging as an intrinsic aspect of the AMS culture. I am confident the new Culture and Inclusion Cabinet will take us there and will assist our entire community in creating an even more inclusive environment—strengthening our enterprise in the process.

What a Launch!…and More GEMS to Follow

Nothing quite like watching lift-off…here’s the video sequence from Arianespace showing the flight of the rocket carrying South Korea’s GEMS satellite instrument into space earlier this week.

GEMS–the Geostationary Environment Monitoring Spectrometer–is a centerpiece of the Asian contribution to a triad of geostationary satellite missions watching air quality in some of the most pollution-prone urban centers of the world. The other similar missions to be launched are Sentinel-4 over Europe and TEMPO over North America.

GEMScoverage

The image above superimposes the field of view for each of the satellites over an image of nitrogen dioxide concentrations averaged over the 10 years 2005-2014 from the Ozone Mapping Instrument aboard NASA’s Aura satellite. Aura is part of the “afternoon-train” or A-train of international satellites focused on anthropogenic aerosols. But these satellites pass over any given spot on Earth the same time each day.

With GEMS, such information is now going to be 24/7 for Asia. As a geostationary eye on air quality, the new South Korean satellite watches meteorology and atmospheric chemistry continuously. In addition to GEMS, which uses spectrometers to track ozone, nitrogen dioxide, sulfur dioxide, aerosols, ultraviolet index, and other health-related factors in the atmosphere, the satellite includes meteorological and ocean color sensors. This gives a synergy to Earth observing at faster sampling rates and higher resolution over the region, advancing investigations of air pollution for a large portion of the world’s population.

The push for geostationary satellite monitoring of air quality that led to the launch of GEMS has been long in the making. In an article 8 years ago in BAMS, W.A. Lahoz explained that geostationary satellites give

an improved likelihood of cloud-free observations …with continuous observations of a particular location during at least part of the day. This “stare” capability …makes it very effective for the retrieval of the lowermost troposphere information for capturing the diurnal cycle in pollutants and emissions, and the import/export of pollutants or proxies for pollutants.

You can read more about the new capabilities in the BAMS article on GEMS by Jhoon Kim (Yonsei Univ.) and colleagues. The article, appropriately, posted online within an hour of the launch of the satellite.

BAMS cover outline 2
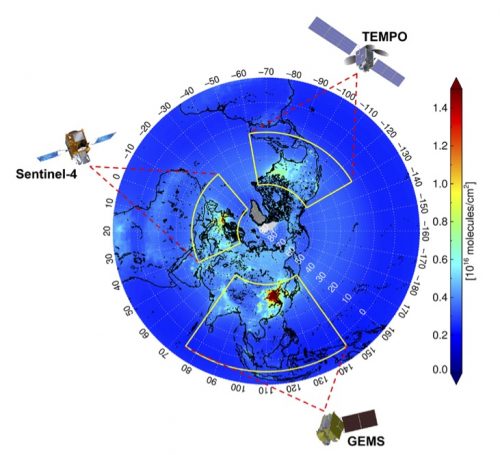
This is actually a twin launch: The GEMS article is among the first of the new-look BAMS in AMS Journals Online. You’ll find highly readable typefaces with a simple layout easier for scrolling on screen. You’ll also note that we’re starting to publish articles as soon as they’re ready for launch, rather than waiting for them to collect into issues in print.

Also about to launch into the mail is a whole new approach BAMS is taking to print as well. The magazine is much more dense with important and exciting new information. The printed features (mirrored as well in the digital edition for AMS members) are short, highly accessible versions of the peer-reviewed research articles. We’re expanding our focus on new and important articles to relay the authors’ thoughts—in their own words—about their work and the challenges they’re solving in their next articles as well. This blog and AMS social media will reflect such thought-provoking new BAMS content in all sorts of ways—for reading, listening, and watching.

So GEMS is our partner in launch: a new era of air quality monitoring for Asia is paired with a new era of communications for AMS. As they say in the media..stay tuned, more to follow!

What If: Hurricane Michael’s Extensive Wind Swath Would Devastate Houston, NWS says

“In summary, it’s going to be bad.”

That’s how Jeff Evans with the NWS in Houston/Galveston began Wednesday’s presentation, “What if Hurricane Michael Struck Houston? An Examination of Inland Wind Damage,” at the AMS 100th Annual Meeting in Boston.

He was boots on the ground after Hurricane Michael slammed the panhandle as a Category 5 with 160 mph winds on October 10, 2018, assisting the Tallahassee NWS office with surveying the widespread wind damage that extended well away from the coast. Because Michael was intensifying at landfall as well as accelerating, its extreme winds spread deep inland, across the panhandle and well into southwest and southern Georgia.

The Donalsonville, Georgia, airport northeast of Marianna, Florida, and about 90 miles inland, recorded a wind gust to 115 mph, while Marianna had a gust to 103 mph in Michael. Both as well as Blountstown, Georgia, suffered significant damage to structures as well as trees.

Track and power outage extent map from Hurricane Michael overlaying a map of Houston. What 95% of the Houston Metro area without power would equate to.

Evans overlaid maps of Michael’s track, wind swath, and areal power outages on Houston to show the extent of its damage potential. The entire Houston metro area with 7.1 million people would suffer; 6.9 million would lose power. And damage to homes and devastation to the landscape would mimic the widespread destruction he observed in the Florida panhandle and southern Georgia where entire forests were virtually flattened.

Evans said that as an NWS meteorologist responsible for warning the Houston area if such a scenario threatened he would have a lot of trouble following the standard hurricane mantra, “Run from the water, hide from the wind.”

Rice University in the Houston Metro area is about the same distance from the coast as Blountstown, Florida, which was blasted by Hurricane Michael.

“Telling people inland to stay put in such extreme wind conditions is not something I would want to do,” he says.

But, he adds, telling them to get out could prove just as deadly in the mass exodus.

“When you start talking about storms, such as Rita, with 130 mph winds or higher, it’s a spontaneous evacuation.” More than 50 people died just from the evacuation of Houston ahead of that storm, he says

It’s been 37 years since a storm brought a significant wind threat to the Houston area. Hurricane Alicia in 1983 was the last. Hurricane Harvey in 2017 was a widespread catastrophic flood event. Hurricane Ike in 2008 was primarily a surge storm.

“The population in and around Houston has doubled during that time,” Evans says. A 2015 American Community Survey showed more than 130,000 people in just Harris county who live in mobile homes, with thousands more in the surrounding counties.

He conducted the research to raise awareness of a “Michael-like” storm and the immense challenges it would represent.

What If: Hurricane Michael's Extensive Wind Swath Would Devastate Houston, NWS says

“In summary, it’s going to be bad.”
That’s how Jeff Evans with the NWS in Houston/Galveston began Wednesday’s presentation, “What if Hurricane Michael Struck Houston? An Examination of Inland Wind Damage,” at the AMS 100th Annual Meeting in Boston.
He was boots on the ground after Hurricane Michael slammed the panhandle as a Category 5 with 160 mph winds on October 10, 2018, assisting the Tallahassee NWS office with surveying the widespread wind damage that extended well away from the coast. Because Michael was intensifying at landfall as well as accelerating, its extreme winds spread deep inland, across the panhandle and well into southwest and southern Georgia.
The Donalsonville, Georgia, airport northeast of Marianna, Florida, and about 90 miles inland, recorded a wind gust to 115 mph, while Marianna had a gust to 103 mph in Michael. Both as well as Blountstown, Georgia, suffered significant damage to structures as well as trees.

Track and power outage extent map from Hurricane Michael overlaying a map of Houston. What 95% of the Houston Metro area without power would equate to.

Evans overlaid maps of Michael’s track, wind swath, and areal power outages on Houston to show the extent of its damage potential. The entire Houston metro area with 7.1 million people would suffer; 6.9 million would lose power. And damage to homes and devastation to the landscape would mimic the widespread destruction he observed in the Florida panhandle and southern Georgia where entire forests were virtually flattened.
Evans said that as an NWS meteorologist responsible for warning the Houston area if such a scenario threatened he would have a lot of trouble following the standard hurricane mantra, “Run from the water, hide from the wind.”
Rice University in the Houston Metro area is about the same distance from the coast as Blountstown, Florida, which was blasted by Hurricane Michael.

“Telling people inland to stay put in such extreme wind conditions is not something I would want to do,” he says.
But, he adds, telling them to get out could prove just as deadly in the mass exodus.
“When you start talking about storms, such as Rita, with 130 mph winds or higher, it’s a spontaneous evacuation.” More than 50 people died just from the evacuation of Houston ahead of that storm, he says
It’s been 37 years since a storm brought a significant wind threat to the Houston area. Hurricane Alicia in 1983 was the last. Hurricane Harvey in 2017 was a widespread catastrophic flood event. Hurricane Ike in 2008 was primarily a surge storm.
“The population in and around Houston has doubled during that time,” Evans says. A 2015 American Community Survey showed more than 130,000 people in just Harris county who live in mobile homes, with thousands more in the surrounding counties.
He conducted the research to raise awareness of a “Michael-like” storm and the immense challenges it would represent.

10-m Resolution Quarter-Trillion Gridpoint Tornadic Supercell Simulation Mesmerizes

An exceptionally high resolution simulation of a supercell thunderstorm fascinated conferees Tuesday at the AMS 100th Annual Meeting in Boston. Leigh Orf of the University of Wyoming presdented imagery and animations of the simulation that ran on the Blue Waters Supercomputer. With a 10 m grid spanning 11,200 X 11,200 X 2,000 (251 billion) grid volumes, the 270 TB subdomain contains the entire life cycle of the tornado, including 10 minutes prior to tornado formation.

Image created with VAPOR3 of a 10-m supercell simulation. (a) Volume rendered cyclonic vertical vorticiy, highlighting the 3D structure of the tornado shortly after formation.
Image created with VAPOR3 of a 10-m supercell simulation. (a) Volume rendered cyclonic vertical vorticity, highlighting the 3D structure of the tornado shortly after formation. The 2D surface field traces the maximum surface cyclonic vertical vorticity, providing a representation of the tornado’s path. The view is following the tornado’s path. (b) As in (a), but later in the simulation when the tornado exhibits a multiple vortex structure. (c) Volume rendered cloud mixing ratio, with parameters chosen to present a quasi-photorealistic view of the cloud field. The 2D surface field traces the minimum pressure found in the tornado’s path. (d)  As in (a) and (b), but a different, wider view and utilizing different opacity and color map choices. The vortex to the left, which merges with the tornado later in the simulation, is weaker than the nascent tornado as evidenced by the vortex’s more transparent and darker visual presentation and path.