[UPDATED] You’ve heard it before: The convergence of thousands of meteorologists at AMS Annual Meetings brings unusual weather to the host city. Spring-like warmth this weekend in this year’s host city of Boston is continuing this trend.
As of 2 pm ET Sunday, the temperature at Logan International Airport has climbed to at least 73 degrees, breaking the monthly record high of 72 for the city set on January 26, 1950. It smashed the daily record high 61 first established in 1913.
On Saturday, southwest winds gusting to nearly 50 mph drove the day’s high to 70 degrees, topping the daily record set in 1975 by 8 degrees.
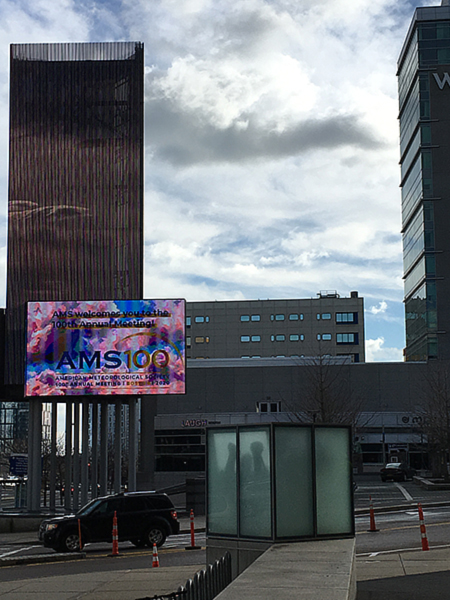
The marquee at the Boston Convention and Exhibition Center announces AMS100. The temperature was a record 69 degrees at the time.
Sunday’s temperature could go even higher—nearby Norwood was 74 at 2 pm—before a a north-south cold front halfway across Massachusetts and Connecticut plows through Boston mid afternoon, bringing an end to the record-setting January thaw. Behind the front blustery northwest winds 40 mph or more will quickly tumble temperatures into the 40s by evening and closer to normal levels overnight and Monday.
We’ve written about the Annual Meeting weather coincidences previously on the AMS blog, dispelling the pervasive myth that our meteorological convergence brings bad and even dangerous weather to the Annual Meeting host city.
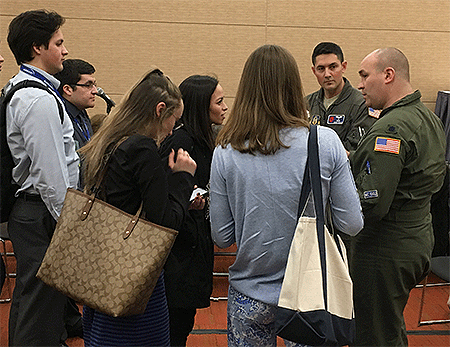
Saturday’s Student Conference at the AMS 100th Annual Meeting kicking off in Boston featured a series of Conversations with Professionals to gain insight into a variety of career choices, the work these professionals in our field currently do, and how they got where they are today. This year’s series, in which short introductions are followed by a Q and A session with students, included two meteorologists who fly into hurricanes with the Air Force 53rd Weather Reconnaissance Wing and another who helps c0-operate the Doppler on Wheels radar for tornado field research.
Below is a sampling of questions students asked Lt. Col. Ryan Rickert and Maj. Jeremy DeHart with the AF Hurricane Hunters as well as Karen Kosiba of the Center for Severe Weather Research. The answers have been edited for length and clarity.
Q (Hurricane Hunters): Can you tell us a little about your backgrounds in the Air Force?
A: (Lt. Col. Ryan Rickert) “Meteorology degrees, with active duty [13 years], go to a weather tech school to learn how to deal with military weather, and then pretty much start with your track—go to a main [Air Force] hub weather regional center to learn how to do big, broad forecasting, then … to a different place and forecast for an airfield so your supporting aircraft at the field. But there are different paths you can take: Science, modeling, Army support, Air Force support, many different ways that you can go.
A: (Maj. Jeremy DeHart) “Yeah, I agree. A lot of people think Air Force, military, and are like ‘Oh, I want to do research … it’s not really my cup of tea.’ but there are so many different tracks you can take, and you’re not going to get the breadth of experience you will in the Air Force doing the jobs we did while on active duty. I have a masters degree and they sent me to California for two years [while on active duty], and I was a full-time student and was paid full-time to go to school. And they’ll do that for your Ph.D., go teach at the Air Force Academy … so don’t be scared off by [military] operations.
Lt. Col. Ryan Rickert (r) and Major Jeremy DeHart at Saturday’s Conversations with Professionals series.
Q (Hurricane Hunters): How do you adjust when a hurricane is rapidly intensifying?
A: (Maj. Jeremy DeHart) You’re always adjusting, because it’s never what you exactly expected. We maintain a pressure altitude of 10,000 feet flying into and through the eye of a hurricane. By the time you’re in the eye, in the stronger storms you’re down to 8,000 feet. In Hurricane Wilma, which set a low pressure record, they were flying at 5,000 feet because they didn’t expect it to be that strong, and by the time they got [in the eye] it had bottomed out and the plane flying a 5,000-foot pressure … was down to about a thousand feet and had to pull up.”
A: (Lt. Col. Ryan Rickert) “We don’t do that anymore. We now go in higher. … When we’re briefing we’re changing things. And even in the execution of the mission we constantly have to adjust. … Constantly changing our pattern if there’s a really intense area [of convection] that doesn’t look [on radar] like it’s safe to go through.
Q (Hurricane Hunters): What do you do in the off-season?
A: (Maj. Jeremy DeHart) “We go to a lot of airshows.”
A: (Lt. Col. Ryan Rickert) “We give talks at conferences, promote what we do, find out what kinds of new instruments we want to put on our airplane, things like that.”
A: (Maj. Jeremy DeHart) “A lot of people don’t realize we have a winter storm requirement as well. … We’ll fly a synoptic pattern and just pepper a big storm with [dropwindsondes]. We’ll fly higher, like 30,000 feet or so, and just carpetbomb the whole thing with instruments.”
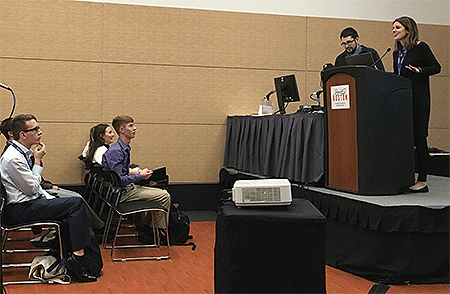
Q (Tornado Research): What made you target research versus academia on your career path?
A: (Karen Kosiba) “Sometimes when you’re deep in academia you don’t think there’s anything outside academia. I was getting ready to graduate and I had done tons of field research but also applied for jobs in academia, in government … and I got many of those jobs. So I picked what I liked. But even if you don’t know what you’re doing you visualize that you’ll try a little of everything. … When I first started working with the Doppler on Wheels I thought I was going to be a technician … but I started to enjoy some different things and it just ended up this way. Just because you get a bachelor’s, a master’s, a Ph.D., an associate degree—whatever you’re getting your degree in—doesn’t mean you can’t do different jobs.”
Karen Kosiba, with the Center for Severe Weather Research, answers students’ questions Saturday at the AMS 100th Annual Meeting.
Q (Tornado Research): Can you elaborate a little on graduate school and how you learned how to write grants?
A: (Karen Kosiba) “For those of you in graduate school, or going to graduate school, you usually work with a professor, and they’re trying to get grants, too. My professor said ‘Hey, you want to write a grant proposal?’ and I was like ‘Sure, let’s write a grant proposal.’ And you don’t really know much about how to write them in graduate school. You can just wing it, or you can have a good mentor, like I did. You know, [as an aside] you think your mentor should be someone exactly like you, and even though you can have someone who likes the same stuff as you, it can be advantageous to find a person who can help you meet your career goals. Someone who understands what you want to do and who you want to be.”
Q (Tornado Research): Do you have any advice for recent graduates who are interested in project-based research rather than forecasting? It seems like a lot of people just take the first thing out there, often university helper.
A: (Karen Kosiba) It’s true. But I think there are more opportunities out there than just waking up and taking those first opportunities. In my case not only did I shop for a mentor but also an advisor who could help me out in the field. Big universities often have big field projects, and they don’t always advertise them as well as they should. It can be tricky to get out and get that experience. But places like NCAR have programs getting [their] people out to do field projects. And the University of Wyoming, NSSL, will have projects going in and out. They’re out there and sometimes you have to do a bit of work to find them. Even if one professor doesn’t have anything, they might know someone who just got funded for a project. And once you’re in them take some responsibilities on … and become an active crew member and contributor to the project.
The Wind Speed Estimation (WSE) standards committee–jointly supported by AMS and the American Society of Civil Engineers–is holding its 9th meeting this week in conjunction with an NSF-funded Tornado Hazard Wind Assessment and ReducTion Symposium (THWARTS) at the University of Illinois in Champaign-Urbana.
The WSE committee began in 2014 to develop standards for an improved process to estimate extreme storm winds. Currently, NWS and private post-storm damage surveys use the EF-Scale and treefall pattern analysis, real-time radar and in situ observations, remote sensing, and forensic investigations. The WSE committee includes a data archival team as well as an international working group to broaden the scope of the standard. (Click here for more information about the committee.)
This is the second joint meeting of WSE/THWARTS and will focus on sharing the latest findings on the multidisciplinary aspects of severe local storms, including the fields of meteorology, wind science and engineering, structural engineering, social science, and policy. A flyer about the symposium with basic information is available online.
Keynote speaker for THWARTS will be Erik Rasmussen. He was the field coordinator of the first of the VORTEX projects in 1994-1995 and a lead principal investigator for VORTEX2 from 2009-2010 and VORTEX-SE from 2016-2017. He currently consults with NOAA’s National Severe Storms Laboratory and the Cooperative Institute for Meteorological Satellite Studies.
The WSE meeting begins after the final session of THWARTS. The meeting is the first step toward a request for public comment on WSE, likely next year.
by Bob Henson,AMS Councilor and Chair, AMS Committee on Environmental Stewardship (ACES)
Those of us involved with climate change in our professional lives—researchers, educators, authors, students—often feel the need to “walk the walk” in a demonstrable way. AMS is one of the world’s premier organizations involved with peer-reviewed research on our changing atmosphere, so it’s only fitting that the Society is finding ways to demonstrate its environmental bona fides in its own operations. For example, AMS has been a leader this past decade in working toward “green meetings.” An upcoming BAMS article will feature some green-meeting highlights, and a summary can also be found in the “About AMS” section of the AMS website.
Just in time for the Society’s 100th birthday, AMS has now ensured that the electricity supply in its offices in Boston and Washington, D.C., is effectively 100% renewable. The Boston shift involved working with the nonprofit Green Energy Consumers Alliance (GECA), a spinoff of Massachusetts Energy that works to maximize the use of renewables in the state’s electricity supply.
AMS recently finalized a renewable two-year agreement (retroactive to January 2019) to purchase Class I renewable energy certificates (RECs) from GECA. These certificates are equal to the full amount of electricity consumed at the AMS buildings at 44 and 45 Beacon Street. Each certificate mandates the production of one megawatt hour of renewable energy, documenting where, how, and when the energy (in this case, wind energy) was produced. In 2019, energy providers in Massachusetts were required to purchase in-state Class I RECs for 14% of all electricity they generate, a percentage that goes up each year by 1%. When entities such as AMS also purchase Massachusetts Class I RECs, it further stimulates the market for clean energy. In other words, Massachusetts Class I RECs don’t simply buy green energy that is already government-mandated; they actually promote the creation of new green-energy supplies within the state.
AMS Controller Joe Boyd worked with the AMS Committee on Environmental Stewardship (ACES) to research options for renewable energy at the Boston building and shepherded the final agreement with GECA.
“Given the Society’s strong commitment to environmental issues, it was natural that we include 100% renewable electricity sourcing to our efforts to maintain a small carbon footprint,” says AMS Executive Director Keith Seitter.
In Washington, AMS leases office space within the headquarters of the American Association for the Advancement of Science at 1200 New York Avenue NW. This building’s electrical supply is also effectively 100% renewable, via RECs that are purchased through a Constellation New Energy contract for transmission and generation. (The RECs do not include electric distribution, and the building also uses a small amount of natural gas.)
“ACES continuously strives to promote the Society’s environmentally progressive standards, complementing the research and efforts of AMS members. Thanks to felicitous timing, the Society is celebrating its transition to 100% renewable energy on its 100th anniversary,” says incoming 2020 ACES Chair C. Todd Rhodes (Coastal Carolina University).
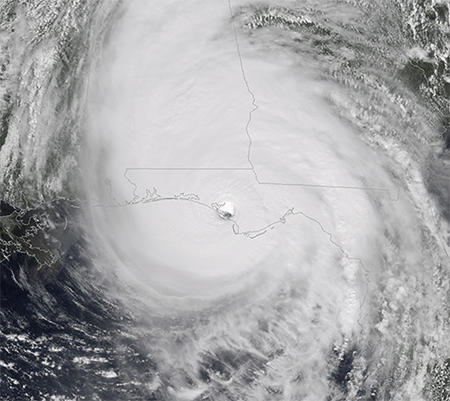
2018’s devastating Hurricane Michael struck the Florida panhandle at Mexico Beach and Tyndall Air Force Base in October at Category 5 intensity with 160 mph winds, the National Hurricane Center announced Friday. That’s 5 mph higher than Michael’s wind estimate of 155 mph at the time of landfall.
GOES-16 Pseudo-color image or Hurricane Michael at 1730 UTC October 10, 2018. (Image courtesy: NOAA NESDIS)
In its post-storm tropical cyclone report, released the same day, NHC stated it culled an abundance of wind data measurements not available in real-time to add the 5 mph to Michael’s wind intensity. The data came from aircraft reconnaissance, ground observations, satellite intensity estimates, surface pressures, and Doppler radar velocities from Eglin Air Force Base and the NWS in Tallahassee. The report goes in-depth with the data, explaining the observations and identifying those that were believable—a 152 knot (175 mph) aircraft wind measurement at 8,000 feet in the southeast eyewall that yields a surface wind of 137 knots (158 mph)—versus those that were suspect—a 152 knot (175 mph) surface wind measured by the stepped frequency microwave radiometer (SFMR) instrument aboard a different aircraft, deemed too high based on experience with such intense winds in hurricanes Irma, Jose, and Maria in 2017.
The upgrade makes Michael only the fourth Category 5 hurricane to hit the United States, joining a small, elite group of monster landfalling storms that include Hurricane Andrew (1992, 165 mph winds), Hurricane Camille (1969, 175 mph winds), and the Labor Day Hurricane (1935, 185 mph winds). Andrew plowed into South Florida, Camille landed on the Mississippi coast, and the Labor Day Hurricane devastated the Florida Keys.
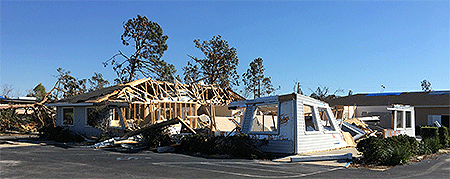
A realty building destroyed by Hurricane Michael’s winds on the east side of Panama City, Florida. (Photo courtesy: Chris Cappella [AMS])
Hurricane Michael roared ashore on October 10 as the strongest hurricane on record to strike the Florida Panhandle, with a storm surge around 14 feet above ground level, destroying Mexico Beach and much of Tyndall AFB, while tearing apart homes and businesses in Callaway, just inland, as well as in the eastern side of Panama City. Sixteen people died directly from the hurricane due to storm surge flooding and the intense winds, which blew down entire forests in the panhandle and destroyed crops across southern Georgia. Wind damage extended into the Carolinas.
Very few surface observations of the hurricane’s intense winds were made at landfall. The highest gust was 139 mph measured by an anemometer at Tyndall AFB before it failed. Two coastal monitoring program towers measured 129 mph and 125 mph, substantially lower than the upgraded wind speed at landfall. One of the towers was knocked over before the peak winds struck, and the other was outside the hurricane’s core. NHC notes that the sites “were likely not optimally located to sample the maximum winds, which is typical during landfalling hurricanes.”
The largest biographical study to date of TV meteorologists shows some disturbing disadvantages for women in the profession. You can hear Alexandra Cranford, the author of that study, discuss the study on the latest episode of our podcast, AMS on the Air.
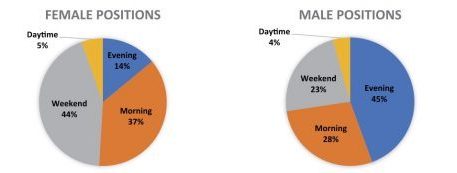
Cranford, who is an AMS Certified Broadcaster with WWL-TV in New Orleans, made an exhaustive survey of online information for more than 2,000 weathercasters. She focused on the relation between her colleagues’ professional status and education. The results, which formed the basis of her BAMS article, show women meteorologists have made gains on local TV, yet are not proportionately well represented in the most prominent and prized positions on local stations.
For example, women are much more likely to be on TV during daytime, mornings, and weekends, than on prime time slots:
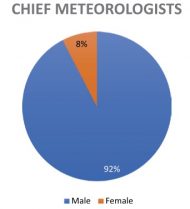
And they are far less likely to be chief meteorologist for their station:
In the podcast interview, she speculates on some of the reasons for these findings.
Perhaps when a hiring manager is interviewing a man versus a woman as a weathercaster, they are looking at slightly different criteria….Another thing is, maybe women are choosing for some reason…perhaps to work maybe weekends and mornings. Maybe women are staying away from those chief positions for some reason. I have no idea if this is the case—I’m just throwing out ideas here—but…possibly due to family reasons or personal preference. That could maybe be another thing.
Also, women may choose to exit the industry earlier in their careers, so that leaves a pool of mainly older, more experienced, mainly males to fill those chief spots, which are typically filled by an older, more experienced person.
And then, one of the reviewers of my study brought my attention to the effect that all of us think about—but how much of a real effect might it have?—the effects of criticisms of consultants and social media and so forth. We all know about the internet trolls. Anyone who works as a TV weathercaster, I’m sure has gotten emails from viewers….That’s a very real thing too. There is research that suggests maybe that’s a bit worse for females versus males. Maybe that can play a role as well.
Listen to the whole interview on the AMS website or on your favorite podcast app.
Most of us can barely imagine the experience AMS Fellow Ada Monzón went through to warn–and then come to the aid of–her fellow citizens in Puerto Rico during Hurricane Maria of 2017. On the latest episode of our podcast, AMS on the Air, the award-winning broadcast meteorologist for WIPR-TV tells BAMS Senior Editor Chris Cappella,
With Maria, I was really scared. All of us have special circumstances right?…in our families. My mother is, almost, all the time in bed and my cousins are sick. They have to be with me; I have to contend with my problems, right? Because I was working. So you have to consider all these factors in all the decisions and all of the things are going through your head while maintaining the right attitude and being calm for the benefit of the rest of the island.
Listen from the AMS website or your favorite podcast app as Monzón talks in depth about the personal and professional challenges of the hurricane–and a situation that in many varieties AMS members eventually must face: Warning your own neighbors, communities, and audiences of impending disaster as its bears down on your own families and homes.
Then check out her keynote to the 2019 AMS Student Conference in Phoenix this January. Monzón explains how she turned the storm she calls “hell” into a “transformative experience” for herself and for her renowned science education museum programs for Puerto Ricans.
How fast can an airliner go? Monday night a Virgin Atlantic Boeing 787-9 reached 801 m.p.h. en route from Los Angeles to London. Matthew Cappucci of the Washington Post reported the jet reached this amazing speed—a record for the Boeing 787-9 and probably the highest speed for a non-supersonic commercial flight—while cruising at 35,000 feet over the central Pennsylvania.
Clearly the plane was hurled along by an intense jet streak; Cappucci showed a sounding at 250 mb—a level nearly as high as the plane—that night over Long Island: the jet stream was moving at 231 m.p.h. This is what pushed the aircraft more than 200 m.p.h. beyond its top airspeed. (The plane’s record speed was relative to the ground, not the swiftly moving air around it.) The Post article states that the sounding “sets the record for the fastest 250-millibar wind speed ever recorded over New York and, probably, the country.”
This raises the other question of speed: just how fast can a jet stream go? It turns out the question is not so easy to answer. To find out, we e-mailed an experienced weather records sleuth, Arizona State University’s Randy Cerveny, who is the World Meteorological Organization’s rapporteur of weather and climate extremes. Cerveny replied,
I had set up a WMO committee this past summer to look into that very question—the strongest tropospheric winds (and so the strongest winds recorded on the planet). As we started to look at the data, we found that by far the strongest tropospheric winds are found east of Japan in the Pacific and normally occur right at this time of the year. They are associated with the normal area when polar and subtropical jets merge. The second area of max tropospheric winds are over New Hampshire and has the same thing happen—polar and subtropical jets merge. BUT unfortunately we ran into serious problems with the quality of extreme tropospheric wind measurements. My experts say that right now the quality of the data for those upper air extreme winds is not good enough to support an investigation for global fastest tropospheric winds. So we are not investigating that record until (and if) NCEI and other groups can establish a viable record for an extreme. We have seen data (again, not good to accept) that has winds in excess of 133 m/s or 297 miles per hour. It is likely that some of those values ARE good but we are still quality-controlling the radiosonde extreme dataset.
With that in mind, we dug into the AMS journals archive and found a February 1955 Journal of Meteorology article by Herbert Riehl, F. A. Berry, and H. Maynard detailing research flights into the jet stream over the Mid-Atlantic states. They record one case of a 240-knot jet stream (276 m.p.h.) and another of 210 knots (241 m.p.h.), each representing averages over 28 miles of flight path.
These can’t be counted as definitive—Riehl et al. emphasized the difficulties of their measurement process. And Cerveny emphasizes that, “No measurement that we have seen at extreme values has been judged of sufficient quality to warrant a full evaluation at this time.”
So for now, just sit back and enjoy the flight.
Today’s poster sessions starting at 4 p.m. will full of mysterious images. This is your opportunity to ask the researchers what the pictures are all about.
In the case of Morristown-Beard School sophomore Kim Magnotta’s poster (103) today, the question may be simply, what are pictures of sand doing at a meteorology conference?
There’s a good reason, of course, so go ahead and ask.
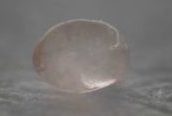
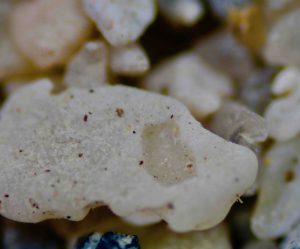
Magnotta jumped into microphotography hoping to capture images of snowflakes falling on Northern New Jersey. Starting her work during summer vacation, finding snow was difficult. Collecting samples from the Jersey Shore, she started photographing sand. It was also much easier perfecting her technique using subjects that did not melt. The first example shown above is primarily quartz and feldspar from Sandy Hook, NJ, including several uniquely large grains.
Focusing on individual sand grains, Kim was fascinated by the variety that exists in this world. She began to send out requests for sand from around the world. Added to her personal samples from Sandy Hook, NJ, were sand from Florida, New Zealand, the Dominican Republic, and other exotic locations. Kim was greatly encouraged by the support she received.
The variety of sand was instructive: New Zealand sand, for example, the second sample above, was from Rings Beach. It was notably glassy, with yellows, purples, and pinks. The next sample below, from Venice, Florida’s prime location on the Gulf Coast, is quartz mingled with fragments of fossils and crushed shells.
Throughout this process, Kim has been creatively reactive to her changing situation. As she presents in the poster session of the Symposium on Education, this has ultimately been an exercise in experimental design and development. Kim has learned how to adapt when the original plans did not work out and begun to network with a larger community.
She says,
At beginning of the sand and snowflake study, I hoped to obtain a few clear pictures of individual sand grains and snowflakes. Shortly after the study began, I became interested in learning about the different minerals that compose sand.
Currently, I have taken over 200 pictures of sand grains from over 35 different locations. This project has blossomed from a hobby into a passion.
Continuing her work, Kim would love for people to come see her at her poster to share ideas about how best to analyze the sand she has collected and to consult about techniques to catch and photograph snowflakes.
Another good reason to spend time wondering at the pictures in the poster conference. One final incentive, a biogenic sand sample from the Dominican Republic, where pink hues set it apart from U.S. East Coast sand.
Today’s poster sessions starting at 4 p.m. will full of mysterious images. This is your opportunity to ask the researchers what the pictures are all about.
In the case of Morristown-Beard School sophomore Kim Magnotta’s poster (103) today, the question may be simply, what are pictures of sand doing at a meteorology conference?
There’s a good reason, of course, so go ahead and ask.
Magnotta jumped into microphotography hoping to capture images of snowflakes falling on Northern New Jersey. Starting her work during summer vacation, finding snow was difficult. Collecting samples from the Jersey Shore, she started photographing sand. It was also much easier perfecting her technique using subjects that did not melt. The first example shown above is primarily quartz and feldspar from Sandy Hook, NJ, including several uniquely large grains.
Focusing on individual sand grains, Kim was fascinated by the variety that exists in this world. She began to send out requests for sand from around the world. Added to her personal samples from Sandy Hook, NJ, were sand from Florida, New Zealand, the Dominican Republic, and other exotic locations. Kim was greatly encouraged by the support she received.
The variety of sand was instructive: New Zealand sand, for example, the second sample above, was from Rings Beach. It was notably glassy, with yellows, purples, and pinks. The next sample below, from Venice, Florida’s prime location on the Gulf Coast, is quartz mingled with fragments of fossils and crushed shells.
Throughout this process, Kim has been creatively reactive to her changing situation. As she presents in the poster session of the Symposium on Education, this has ultimately been an exercise in experimental design and development. Kim has learned how to adapt when the original plans did not work out and begun to network with a larger community.
She says,
At beginning of the sand and snowflake study, I hoped to obtain a few clear pictures of individual sand grains and snowflakes. Shortly after the study began, I became interested in learning about the different minerals that compose sand.
Currently, I have taken over 200 pictures of sand grains from over 35 different locations. This project has blossomed from a hobby into a passion.
Continuing her work, Kim would love for people to come see her at her poster to share ideas about how best to analyze the sand she has collected and to consult about techniques to catch and photograph snowflakes.
Another good reason to spend time wondering at the pictures in the poster conference. One final incentive, a biogenic sand sample from the Dominican Republic, where pink hues set it apart from U.S. East Coast sand.