A Few Takeaways from the “State of the Climate in 2022”

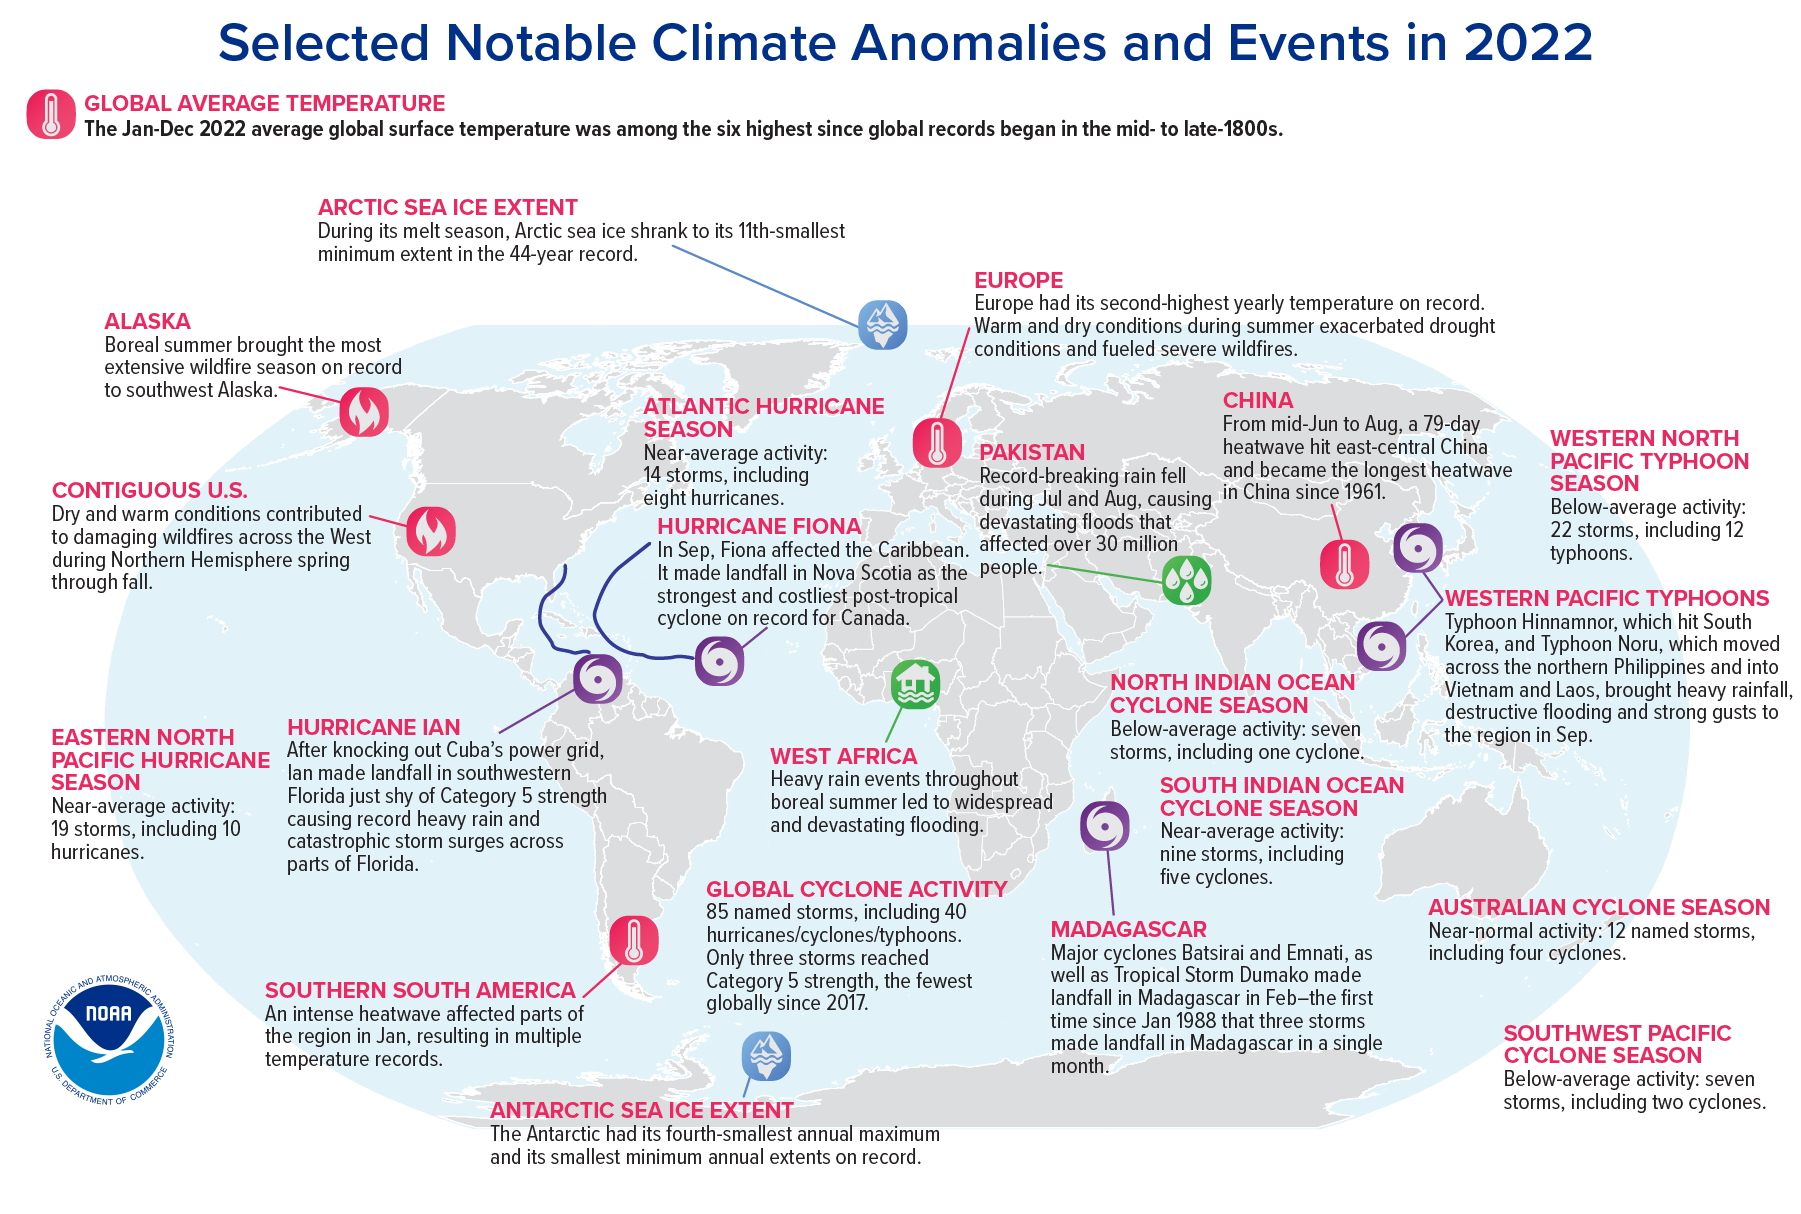
Map of significant global weather and climate anomalies and events of 2022.

Record-high greenhouse gases, sea levels, monsoons, and droughts—and a volcanic vapor injection

By Michael Alexander, Lead, Atmosphere Ocean Processes and Predictability (AOPP) Division, NOAA, and BAMS Special Editor for Climate

The annual NOAA/AMS State of the Climate report has just been released, with a comprehensive global look at the climate in 2022. Produced by the NOAA National Centers for Environmental Information (NCEI) and the American Meteorological Society, the State of the Climate Report maps out the complex, interconnected climate phenomena affecting all parts of the globe. It also charts global progress in observing and understanding our climate system. 570 scientists from 60 countries contributed to this year’s report, including a rigorous peer review, making it a truly global endeavor. 

As the senior editor on this project, I wanted to share with you a few highlights. Click here to read the full report, published as a supplement to the Bulletin of the American Meteorological Society.

New record-highs for atmospheric greenhouse gases CO2, methane, and nitrous oxide.

It was yet another record-setting year for atmospheric carbon dioxide and other greenhouse gases. 2022 saw an average concentration of 417.1 ± 0.1 ppm for atmospheric CO2; methane and nitrous oxide also reached record highs. 
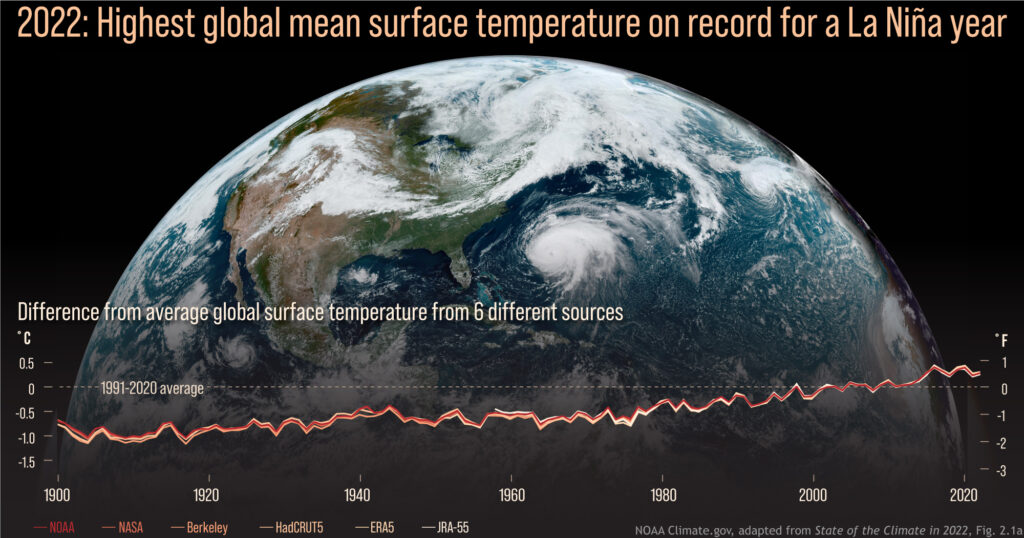
Graphs of yearly global surface temperature compared to the 1991-2020 average for each year from 1900 to 2022, from 6 data records, overlaid on a GOES-16 satellite image from September 22, 2022.  Image credit: NOAA Climate.gov.

Warmest La Niña year on record.

Despite being in the typically cooler La Niña phase of ENSO, 2022 was among the six warmest years on record, and was the warmest La Niña year ever recorded. Summer heat waves left annual temperatures at near-record highs in Europe, China, the Arctic, and Antarctica (parts of Europe set daily or seasonal heat records), and New Zealand experienced its warmest year ever. High-pressure “heat domes” helped elevate local temperatures in many areas, including parts of North America and Europe. 

Record-high global mean sea level and ocean heat.

Global mean sea level reached 101.2mm above 1993 levels, setting a new record for the 11th year in a row. 2022 also saw record-high global ocean heat content (as measured to 2000 meters below the surface), although La Niña moderated sea-surface temperatures.
Image credit: NOAA

Complex climate picture.

Global warming trends continued apace, but of course numerous large-scale climate patterns complicated the picture. In 2022 we saw the first “triple-dip” La Niña event (third consecutive La Niña year) of the 21st century. The Indian Ocean Dipole had one of its strongest negative events since 1982, which led to increased temperatures and precipitation in the eastern Indian Ocean. Along with La Niña, this contributed to record-breaking monsoon rains in Pakistan that caused massive flooding and one of the world’s costliest natural disasters. We also had a positive-phase winter and summer North Atlantic Oscillation affecting weather in parts of the Northern Hemisphere. 

A bad year for drought.

For the first time ever, in August 2022, 6.2% of the global land surface experienced extreme drought in the same month, and 29% of global land experienced at least moderate drought. Record-breaking droughts continued in equatorial East Africa and central Chile. Meanwhile, parts of Europe experienced one of their worst droughts in history, and China’s Yangtze River reached record-low levels.

Warmth and high precipitation at the poles.

2022 was the firth-warmest year recorded for the Arctic, and precipitation was at its third-highest level since 1950. The trend toward loss of multi-year sea ice continued. Meanwhile, Antarctic weather stations recorded their second-warmest year ever, including a heatwave event that collapsed the Conger Ice Shelf, and two new all-time record lows in sea-ice extent and area set in February. On the other hand, record snow/icefall due to atmospheric rivers led to the continent’s highest recorded snow/ice accumulation since 1993.
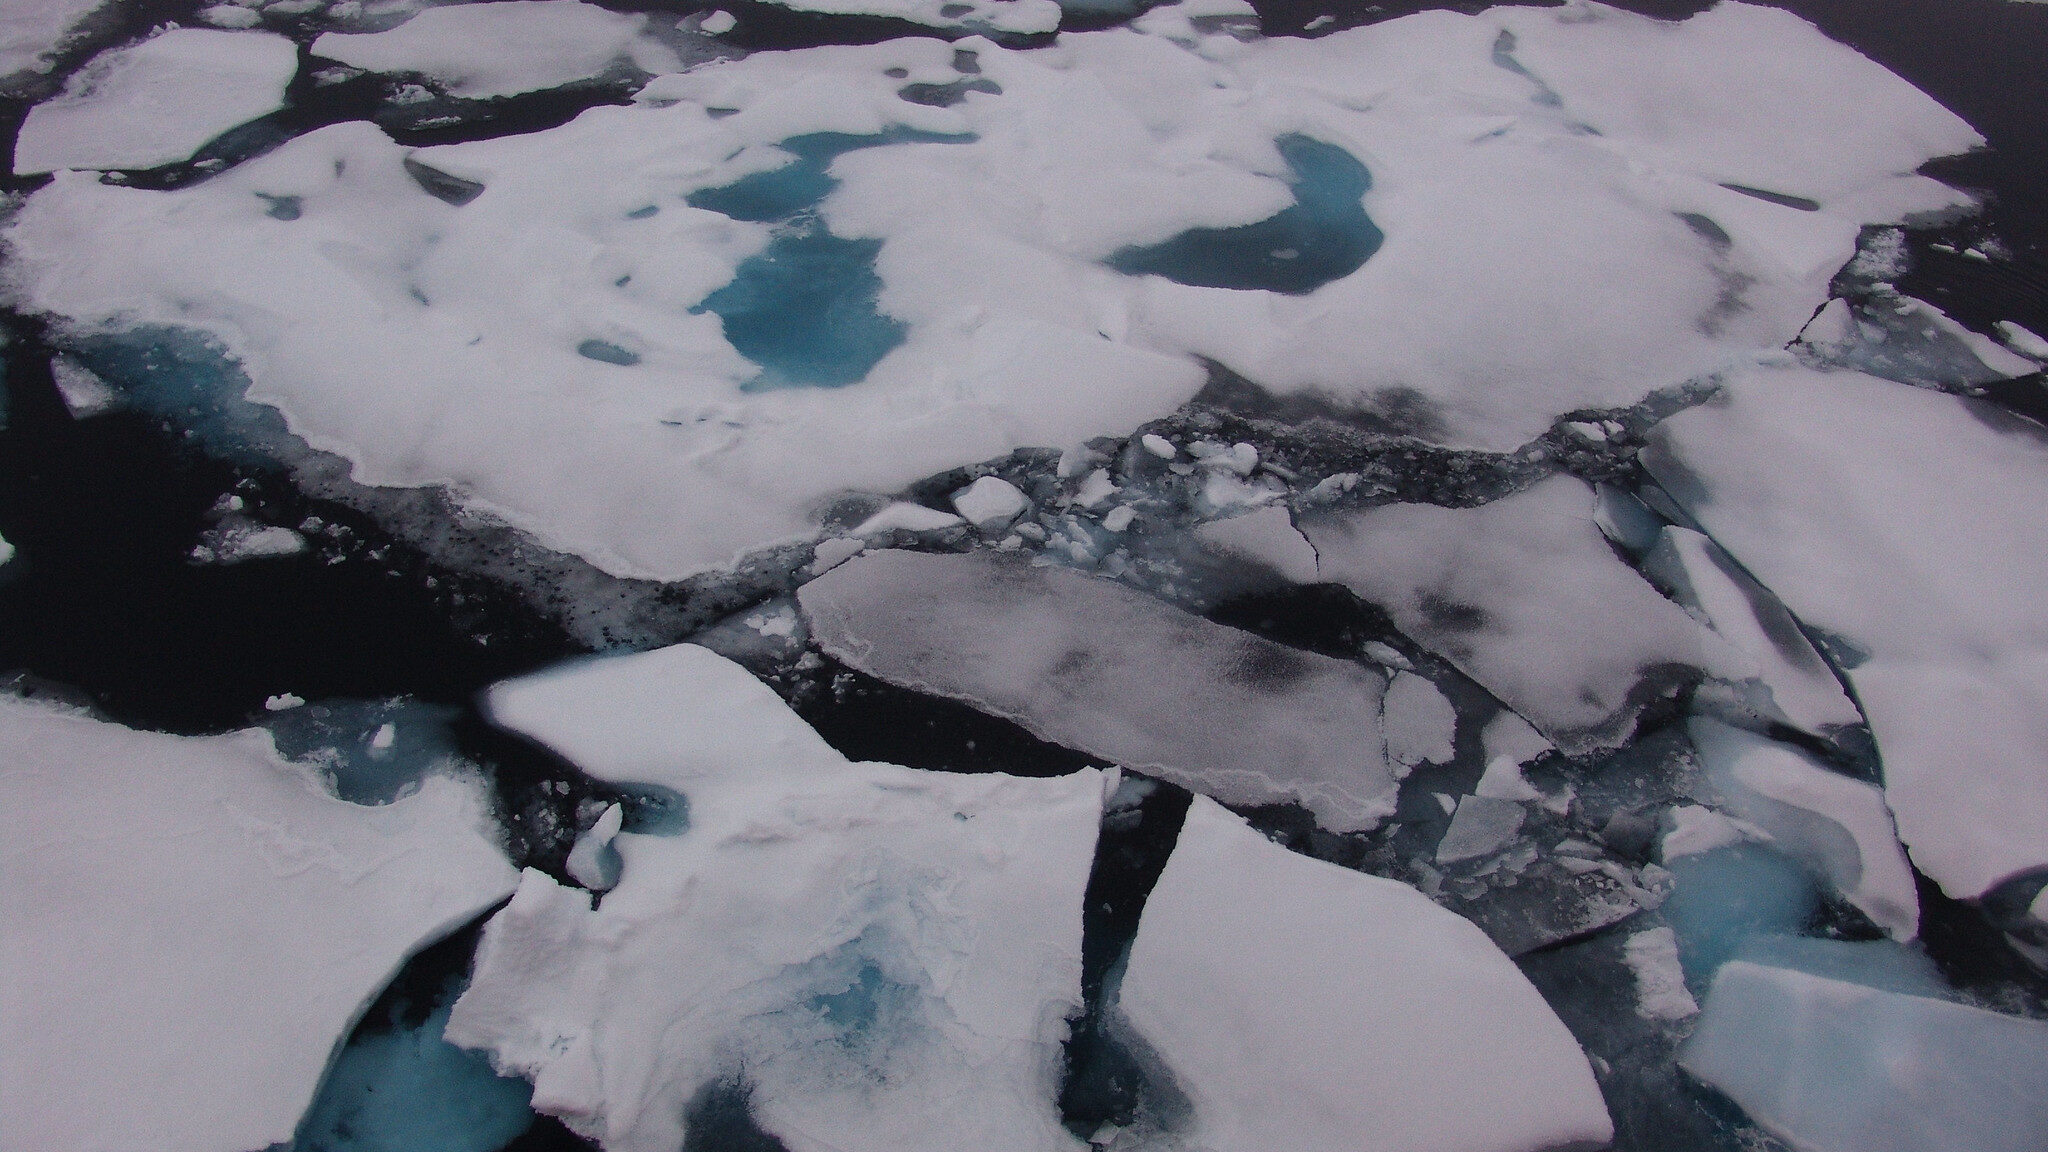
Image credit: NOAA

Notable storms: Ian and Fiona.

85 named tropical cyclones were observed across all ocean basins, an approximately average number. Although there were only three Category 5 storms, and the lowest recorded global accumulated cyclone energy, the year produced Hurricane Ian, the third-costliest disaster in U.S. history, as well as Hurricane Fiona, Atlantic Canada’s most destructive cyclone.

Massive volcanic injection of atmospheric water vapor.

The Hunga Tonga-Hunga Ha’apai submarine volcano in the South Pacific injected a water plume into the atmosphere of unprecedented magnitude (146+/-5 Terragrams, about 10% of the stratosphere’s total water) and height (reaching into the mesosphere). We don’t yet know what, if any, long-term effects this will have on the global climate, although the increase in water vapor has interfered with some earth system observations. 

The full report is a comprehensive and fascinating analysis of our climate system in the previous calendar year. I urge you to read it and communicate your own takeaways from the State of the Climate in 2022. You can read the press release here.

Infographic at top: World map showing locations of significant climate anomalies and events in 2022. Credit: NOAA.
A Chat with the Iceman

Thorsten Markus, on sea ice in Antarctica.

By Maureen Moses, AMS Education Program
I hope you all had a good Earth Science Week last week! The theme was “Careers in the Earth Sciences,” and the AMS Education Program participated in a twitter chat with NASA Polar Scientist Thorsten Markus, who admits that as a high schooler in Germany science wasn’t his passion, but becoming a musician was. Now head of NASA Goddard’s Cryospheric Science Lab, Dr. Markus makes measurements of ice thickness in Antarctica.
Chat participants included a whole classroom full of eighth graders. Dr. Markus had plenty of advice on how a future polar scientist with an adventuresome streak can make a splash in a cool field! Here are some of the questions he fielded–edited and excerpted from the full chat archived on Twitter:

I’m here with 25 8th grade Earth Science students and one student would like to know what the day to day duties are as a polar scientist.
It’s extremely playful — playing with lots and lots of satellite data and learning something new every day.
Do you get to travel to cool places or are you processing data in an office?
Oh man, yes. I used to go to the Arctic and Antarctic and also flew over them in helicopters and planes.
What was your favorite experience in the field as a scientist?
Seeing the penguins coming out of the water and then standing right next to us. Fantastic!
When you decided becoming a rock star might not happen, why did you choose physics over math for a major?
Physics is pretty much applied Math — you deal with everyday problems… and actually learn how to solve some.
Which class helped you the most to get where you are today?
Maybe Math, but the arts fostered my creativity, for thinking outside the box
What level math did you have to go to? (for the future polar scientists out there). THX for the response!
I have a Ph.D. in physics, which involves a lot of math — but there’s also chemistry, biology and geography.
What is the difference between glacier ice data and sea ice data… Do they tell different stories?
Very different. Glacier ice is fresh water from mountains or ice sheets whereas sea ice is frozen ocean.
Are they affected differently by climate change?
Glaciers are balanced by snowfall and temperature, while with sea ice, also ocean properties play a big role.
So sea ice is inherently more volatile/variable?
I’d like to say sea ice is more complex, but then the ice sheet people might get angry 😉
What is/will be the impact of disappearing ice sheet on the global climate?
Melting of the ice sheets will increase sea level and affect ocean circulation because of the fresh water influx.
When can we expect to see Antartica’s ice retreating because of climate change. If it keeps stable or increasing, what can be made of that?
The Arctic and Antarctica are two different systems and global warming does not mean it warms uniformly everywhere.
What do you say to people who claim there’s a “debate” about climate change?
I don’t think there’s a “debate” about whether there’s climate change. The debate is by how much we’re responsible for it.
How good are the current models in predicting Arctic and Antarctic ice response to the climate warming?
I think the models are remarkable — certainly not perfect, but what prediction is perfect?
What climate data scares you the most (has the greatest implication for scary future events)?
The global ocean circulation, because it shows that things we do to the Chesapeake Bay may affect far away places.
Does any of the research you do tell us anything about other sheets of ice in cosmos?
As a matter of fact, I was involved in research about the Jupiter icy moons. So yes, there are analogies.
Who do you regard as your inspiration?
It was Keith Richards, now it’s the balance of the earth system… isn’t it remarkable how it all works together?
 

They Still Make Them Like They Used To

This summer, the Catlin Arctic Survey team became the first explorers to ever take ocean water samples at the North Pole. The three-person team covered 500 miles over 2 1/2 months in their expedition across sea ice off the coast of Greenland. On the way they were met with numerous obstacles: a persistent southerly drift that regularly pushed them backward, strong headwinds, ice cracks opening under their tent, dangerously thin ice, and areas of open water they had to swim across.

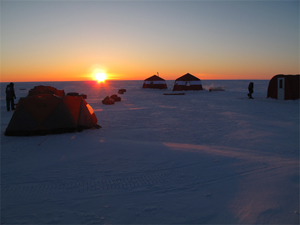
The Catlin camp

They persisted through it all, measuring ice thickness, drilling ice cores, and collecting water samples (see the video below) and plankton data. They hope their research will provide insight into the effects of carbon dioxide on local marine life and Arctic Ocean acidification.
The heartiness of the Catlin team reminds us of the rich history of polar exploration in the name of meteorology. Historian Roger Turner of the University of Pennsylvania gave a fascinating presentation at the AMS Annual Meeting in Atlanta about the origins of the tradition, spotlighting the group of young Scandinavian meteorologists who studied under Vilhelm Bjerknes in Bergen, Norway. They were vital contributors to numerous Arctic expeditions in the 1920s.
This first wave of Bergen School meteorologists was well-suited to polar exploration, where they contributed their familiarity with the Far North conditions as well as their new understanding of upper-air dynamics. But Turner argues that their affinity for outdoors activities–particularly in the harsh conditions of the Arctic–also set them apart from others in their generation and, by implication, from the desk-bound meteorologists today.
We think those hardy meteorological pioneers of yesteryear would appreciate the intrepid scientific spirit of the Catlin team.