Record-high greenhouse gases, sea levels, monsoons, and droughts—and a volcanic vapor injection
By Michael Alexander, Lead, Atmosphere Ocean Processes and Predictability (AOPP) Division, NOAA, and BAMS Special Editor for Climate
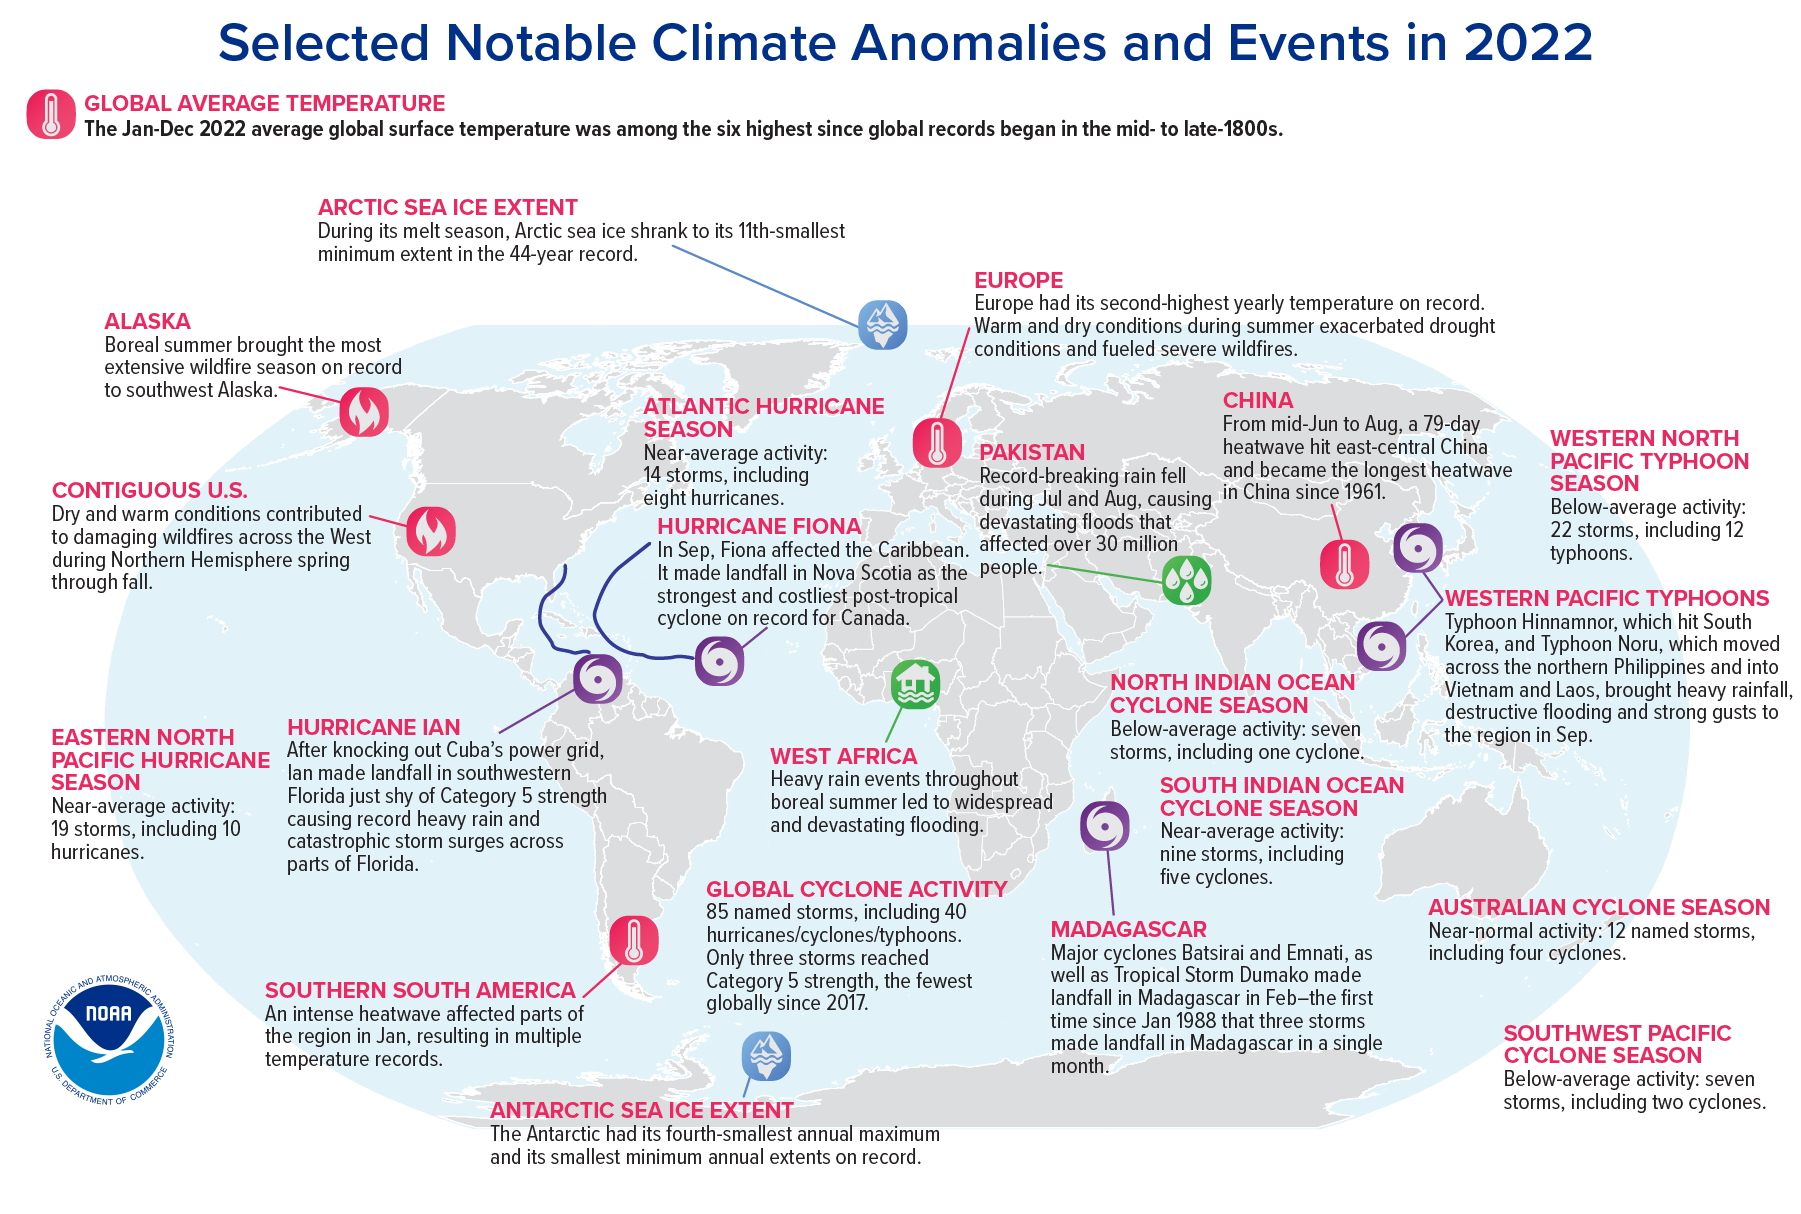
The annual NOAA/AMS State of the Climate report has just been released, with a comprehensive global look at the climate in 2022. Produced by the NOAA National Centers for Environmental Information (NCEI) and the American Meteorological Society, the State of the Climate Report maps out the complex, interconnected climate phenomena affecting all parts of the globe. It also charts global progress in observing and understanding our climate system. 570 scientists from 60 countries contributed to this year’s report, including a rigorous peer review, making it a truly global endeavor.
As the senior editor on this project, I wanted to share with you a few highlights. Click here to read the full report, published as a supplement to the Bulletin of the American Meteorological Society.
New record-highs for atmospheric greenhouse gases CO2, methane, and nitrous oxide.
It was yet another record-setting year for atmospheric carbon dioxide and other greenhouse gases. 2022 saw an average concentration of 417.1 ± 0.1 ppm for atmospheric CO2; methane and nitrous oxide also reached record highs.
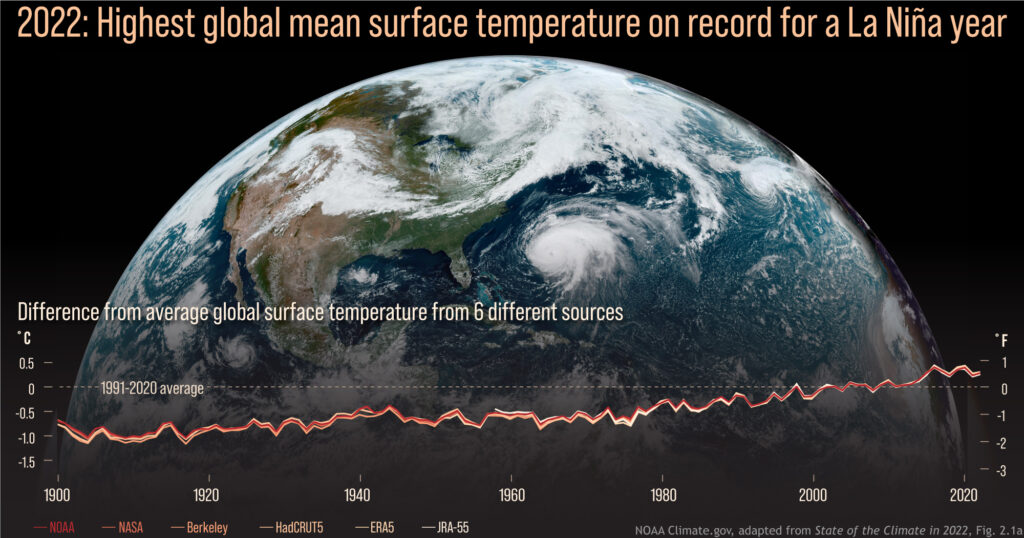
Graphs of yearly global surface temperature compared to the 1991-2020 average for each year from 1900 to 2022, from 6 data records, overlaid on a GOES-16 satellite image from September 22, 2022. Image credit: NOAA Climate.gov.
Warmest La Niña year on record.
Despite being in the typically cooler La Niña phase of ENSO, 2022 was among the six warmest years on record, and was the warmest La Niña year ever recorded. Summer heat waves left annual temperatures at near-record highs in Europe, China, the Arctic, and Antarctica (parts of Europe set daily or seasonal heat records), and New Zealand experienced its warmest year ever. High-pressure “heat domes” helped elevate local temperatures in many areas, including parts of North America and Europe.
Record-high global mean sea level and ocean heat.
Global mean sea level reached 101.2mm above 1993 levels, setting a new record for the 11th year in a row. 2022 also saw record-high global ocean heat content (as measured to 2000 meters below the surface), although La Niña moderated sea-surface temperatures.
Image credit: NOAA
Complex climate picture.
Global warming trends continued apace, but of course numerous large-scale climate patterns complicated the picture. In 2022 we saw the first “triple-dip” La Niña event (third consecutive La Niña year) of the 21st century. The Indian Ocean Dipole had one of its strongest negative events since 1982, which led to increased temperatures and precipitation in the eastern Indian Ocean. Along with La Niña, this contributed to record-breaking monsoon rains in Pakistan that caused massive flooding and one of the world’s costliest natural disasters. We also had a positive-phase winter and summer North Atlantic Oscillation affecting weather in parts of the Northern Hemisphere.
A bad year for drought.
For the first time ever, in August 2022, 6.2% of the global land surface experienced extreme drought in the same month, and 29% of global land experienced at least moderate drought. Record-breaking droughts continued in equatorial East Africa and central Chile. Meanwhile, parts of Europe experienced one of their worst droughts in history, and China’s Yangtze River reached record-low levels.
Warmth and high precipitation at the poles.
2022 was the firth-warmest year recorded for the Arctic, and precipitation was at its third-highest level since 1950. The trend toward loss of multi-year sea ice continued. Meanwhile, Antarctic weather stations recorded their second-warmest year ever, including a heatwave event that collapsed the Conger Ice Shelf, and two new all-time record lows in sea-ice extent and area set in February. On the other hand, record snow/icefall due to atmospheric rivers led to the continent’s highest recorded snow/ice accumulation since 1993.
Image credit: NOAA
Notable storms: Ian and Fiona.
85 named tropical cyclones were observed across all ocean basins, an approximately average number. Although there were only three Category 5 storms, and the lowest recorded global accumulated cyclone energy, the year produced Hurricane Ian, the third-costliest disaster in U.S. history, as well as Hurricane Fiona, Atlantic Canada’s most destructive cyclone.
Massive volcanic injection of atmospheric water vapor.
The Hunga Tonga-Hunga Ha’apai submarine volcano in the South Pacific injected a water plume into the atmosphere of unprecedented magnitude (146+/-5 Terragrams, about 10% of the stratosphere’s total water) and height (reaching into the mesosphere). We don’t yet know what, if any, long-term effects this will have on the global climate, although the increase in water vapor has interfered with some earth system observations.
The full report is a comprehensive and fascinating analysis of our climate system in the previous calendar year. I urge you to read it and communicate your own takeaways from the State of the Climate in 2022. You can read the press release here.
Infographic at top: World map showing locations of significant climate anomalies and events in 2022. Credit: NOAA.
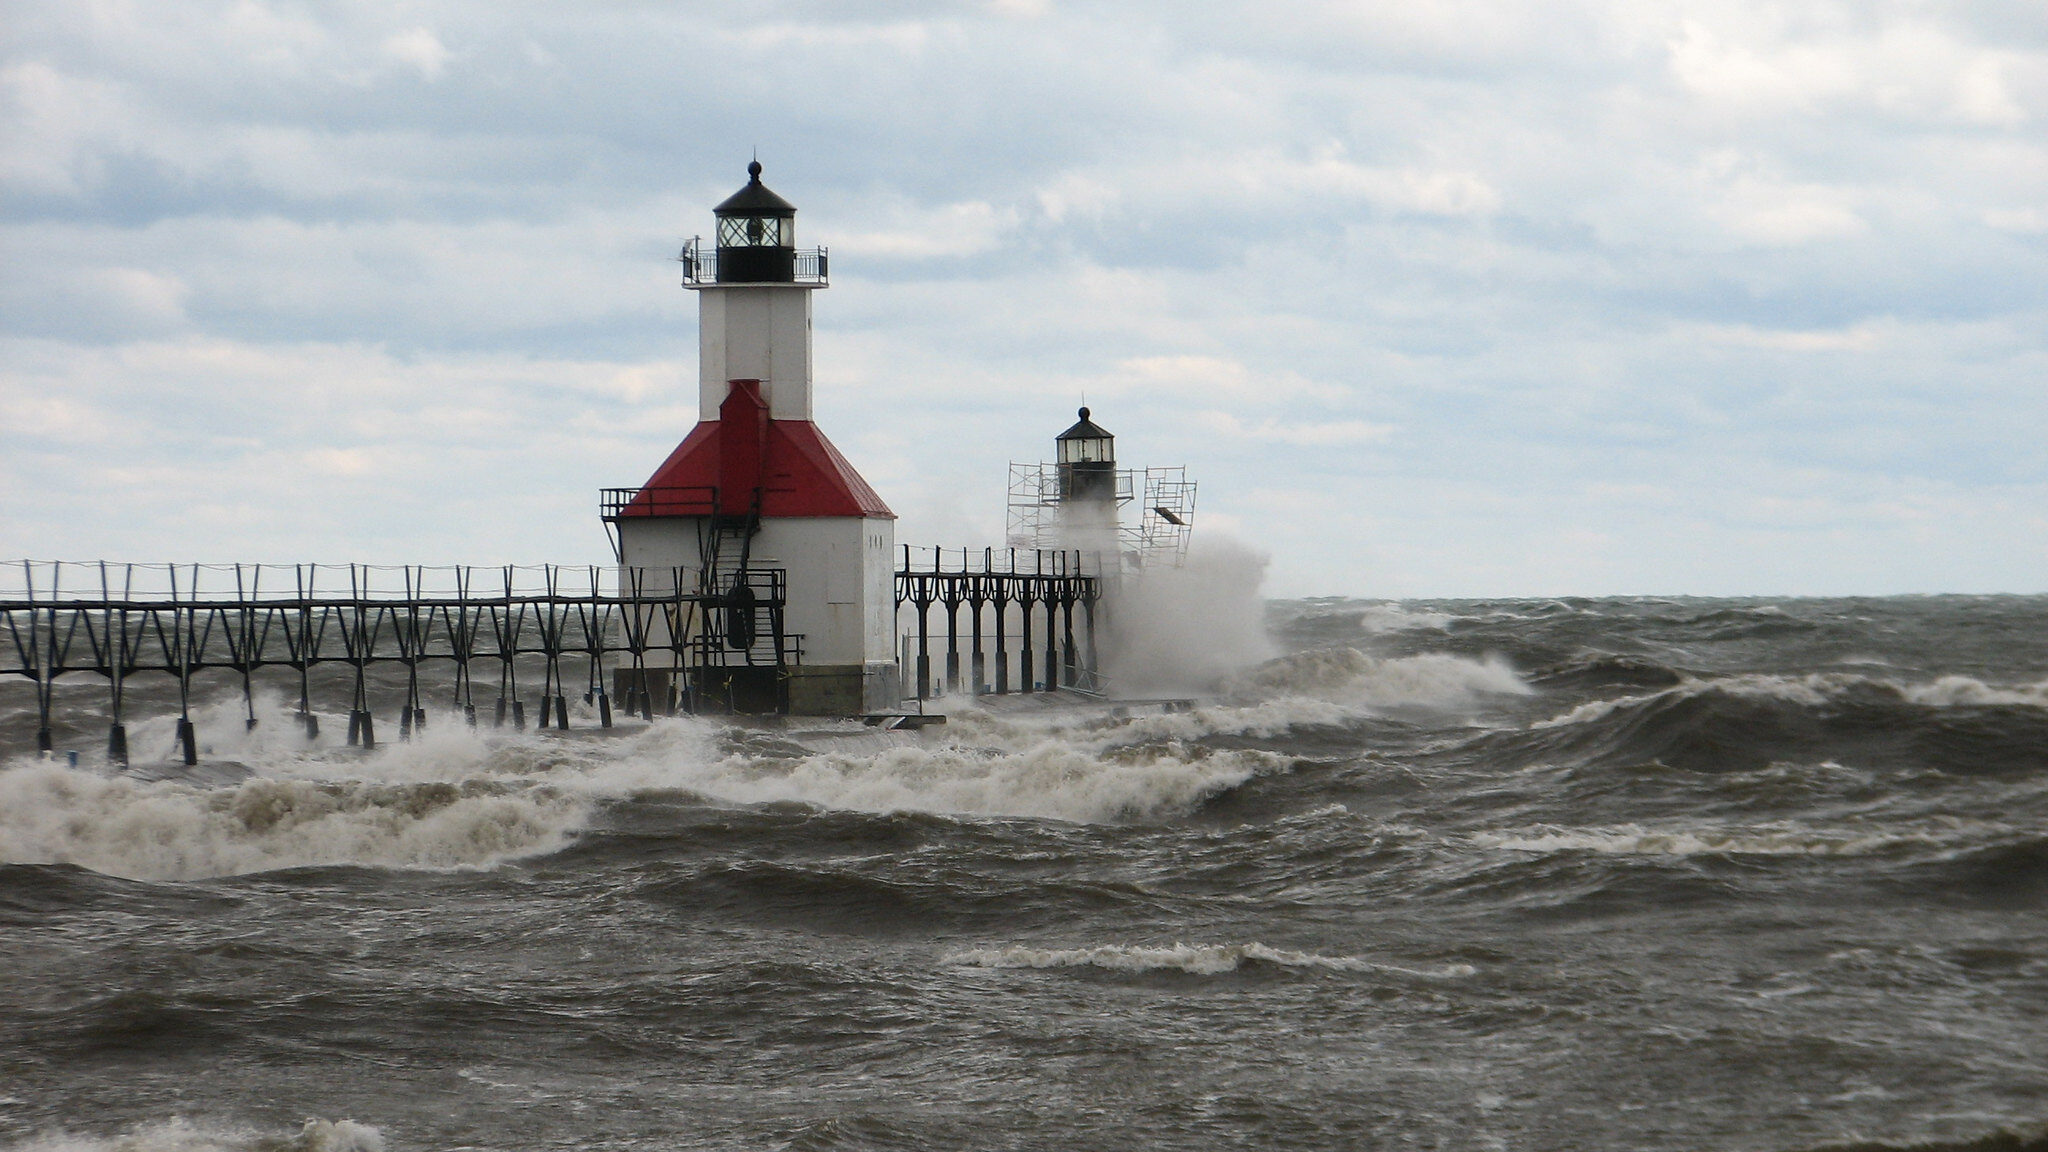
Derechos are less common than Midwestern tornadoes, but occur almost every year in that region as well as other parts of the United States. Yet they remain exotic and mystifying. Even to meteorologists.
The reason appears to lie in the complex way the long-lived windstorms form. Derechos are often incorrectly referred to as inland hurricanes; their damaging winds can reach hurricane force, but they are straight-line in nature, rather than circulating around a common center. When people suffer, though, they can be forgiven for using the wrong windstorm term. By definition derechos have to meet specific criteria, such as causing damage continuously or intermittently in a lengthy line of at least 400 miles that’s at least 60 miles wide. But just like hurricanes, they come in a variety of intensities.
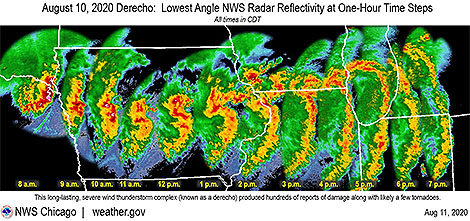
Last week’s derecho, roaring 750 miles from eastern Nebraska across Iowa, Illinois and Indiana, was particularly ferocious with winds in multiple swaths across Iowa gusting to over 100 mph. The National Weather Service found damage to an apartment complex in Cedar Rapids, Iowa, consistent with wind gusts of an astonishing 130-140 mph. But even these extreme winds and the severe damage they wrought don’t tell the whole story of the variation in these windy storms with the seemingly odd name.
The AMS Glossary of Meteorology states: “The term derecho derives from a Spanish word that can be interpreted as “straight ahead” or “direct” and was chosen to discriminate between wind damage caused by tornadoes, which have rotating flow, from straight-line winds.” It defines derechos as widespread convectively induced straight-line windstorms.
Two Very Different Derechos: Base reflectivity composite radar data for (a) 2056 UTC 4 Apr 2011 and (b) 2234 UTC 29 Jun 2012, with surface observations plotted using conventional station plot format. Convective system in (a) is composed of a series of loosely connected, largely linear bands with low-amplitude LEWPs, whereas that in (b) consists of a single, intense arc of storms with a well-defined bow echo. Animated radar and satellite imagery for these events may be viewed at http://spc.noaa.gov/misc/AbtDerechos/casepages/apr042011page.htm and http://spc.noaa.gov/misc/AbtDerechos/casepages/jun292012page.htm.
This updated definition was the work of a team of meteorologists about five years ago who compared different straight-line windstorms—all meeting the damage criteria of derechos at the time but clearly having different mechanisms driving them. Their published paper in the Bulletin of the American Meteorological Society was “A Proposed Revision to the Definition of ‘Derecho’.” With it, the authors made the case to improve the definition of derecho to make it more physically based and more closely mirror other definable meteorological terms such as tornadoes, extratropical cyclones, and cirrus clouds.
While the paper had a positive effect among the meteorological community, a web search still turns up different definitions of derecho among meteorological websites, including within the NWS.
We asked the lead author of the BAMS paper, Stephen Corfidi (NOAA NWS, CIMMS, University of Oklahoma), for his thoughts on last week’s Midwestern derecho, to put it in perspective and also to help explain the reasons behind the difficulty with meteorologists not only defining but using the meteorological term differently.
BAMS: Was last week’s Midwest fast-moving line of severe thunderstorms with damaging winds a derecho? If so, did it fit the Glossary definition of a derecho?
Stephen Corfidi: Last Tuesday’s Midwest wind storm met the AMS Glossary definition of a derecho. Most significantly, it satisfied the criterion for the presence of “one or more sustained bow echoes with mesoscale vortices and/or rear-inflow jets.” A large mesoscale vortex, located on the north end of the larger-scale bow-shaped convective system from central Iowa to Lake Michigan, appears to have been associated with some of the strongest and longest-duration surface winds that accompanied the event. While the swath of organized damaging winds was not particularly long (on the order of 500 miles (800 km)) in comparison to some past events, the length well exceeded the somewhat flexible 400-mile (~ 650 km) cut-off used to distinguish derecho storms.
BAMS: Among derechos, how does this one rank?
SC: The Iowa-Illinois storm is certainly one of the most memorable of 2020—a year that already has seen other noteworthy events (e.g., those in Colorado, the Dakotas, and Pennsylvania in June). What made the Iowa-Illinois event especially noteworthy was the sizable number of reliably-observed significant surface gusts. There were numerous reports in excess of 80 mph (35 meters/second), and incidental evidence that some locations experienced speeds greater than 100 mph (45 m/s). The strong winds—likely enhanced by the presence of the mesoscale vortex—in some places persisted for more than 30 minutes. The vortex to some extent resembled the “warm-core” (hurricane-like) circulation that formed within the Kansas-Missouri-Illinois derecho of 8 May 2009.
BAMS: What made this one stand out?
SC: The duration of the storm’s high winds over eastern Iowa and western Illinois—again, likely due in part to the presence of the large mesoscale vortex—was certainly outstanding. This is quite a statement considering that the event occurred in a region known for its propensity for derechos (Recall that Gustave Hinrich’s nineteenth century studies of straight-line wind events were based in Iowa).
BAMS: Why are derechos so perplexing and difficult for meteorologists to acceptably define?
SC: There are several reasons why derechos are not only difficult to define, but also challenging to forecast. Unlike supercell thunderstorms that, in most cases, are well-delimited in time and space, broad swaths of damaging convective winds can arise in many different ways. Some of the processes involved in derecho development remain poorly understood and / or are only partly resolved by current observational platforms.
More significantly, unlike weather phenomena like supercells, derechos may or may not be accompanied by meteorological structures that readily are apparent to human observers. For example, most meteorologists recognize a supercell when one appears in the sky. But specific cloud formations are not associated with derechos, and the characteristic meteorological structures that do accompany many derechos (e.g., embedded vortices and rear-inflow jets) are too large or subtle to be recognized by human observers without the aid of remote-sensing devices such as radar and satellite.
These same aspects make derechos difficult to forecast. One can say that derechos arise when a unique combination of known and unknown necessary ingredients is present over a sufficiently broad area to support rapid, repetitive, downshear thunderstorm development. That said, applying this concept in practice presents a formidable challenge. In some cases, the known ingredients are present, but the extent of the favorable environment is too limited for derecho status to be realized. Conversely, expansive environments sometimes appear that are supportive of widespread destructive winds, but not those strongly dependent on the smaller-scale processes associated with rear-inflow jets and mesoscale vortices.
As with any weather forecast, when “missed” derecho events occur, the root causes can be traced to the existence of too many unknowns—both observational and theoretical. In the case of derechos, both unknowns, at present, remain sizable.
BAMS: What has been the impact of your 2016 BAMS paper and proposed new definition?
SC: It does appear that the updated definition proposed in the paper has been adopted to at least some extent in the severe weather community; the updated definition in the AMS’ Glossary likely abetted the effort. There is, of course, no “official” arbiter of general meteorological terms. This explains, in part, the range of derecho “definitions” that appear in some sources. The lack of consistency in the use of the term “derecho” was, in fact, a motivating factor in drafting the paper. We’d like to think that the paper focused needed attention on the value of increased precision in meteorological terminology, but that is not something that is easy to measure. It is probably safe to say that the definition of “derecho” will continue to change as the underlying processes responsible for the most intense storms become better understood.
BAMS: What would you like readers of your 2016 paper to learn about and from the re-defining of derecho?
SC: I think perhaps the most important take-aways are that (1) the existing definition was outdated because of the significant changes that have occurred in observational data, record-keeping, and understanding since the mid-1980s, and (2) that if we are to better understand and forecast high-wind-producing convective systems, we need to first better classify those systems that are observed.
BAMS: You and your colleagues at NOAA-NWS-NCEP put together a comprehensive and impressive website About Derechos. How did you become interested in them?
SC: Convective systems, in general, are interesting because there are so many “moving parts” involved in their development, sustenance, and motion. It is especially challenging—but also rewarding—to try to assess the strength and likely longevity of those processes in real-time so as to prepare useful forecasts. Derechos are high-impact events; they are one area where society would benefit greatly from increased meteorological knowledge.
BAMS: What was the biggest challenge you encountered in your work to update the derecho definition?
SC: Having thoughts on introducing any new idea is one thing, but putting those concepts into words is another. Unlike most other papers in our “business,” in this one I felt we had to be somewhat persuasive. I was not at first comfortable with taking such an approach. But the contrasts presented by the two derecho events introduced in the first part of the paper furthered my conviction that persuasion was needed to both defend and encourage discussion on the definition topic.
BAMS: What got you initially interested in meteorology?
SC: My interest in clouds and storms goes back to my earliest days as a young kid growing up in a house kept super-clean by my mom. Because I was forbidden to play in the yard when the grass was wet (I’d track dirt into the house, of course!), I soon came to appreciate “Mr. Sun.” In particular, I noticed that I’d often not see the sun the next day if certain cloud formations had appeared in the sky on the previous one. A bit later, in first grade, my dad introduced me to weather books in the local library. Some had cloud pictures indicating which formations were “bad,” and which were associated with good weather. I was hooked! Thunderstorm days were always a favorite because the clouds on such days seemed to change the most rapidly—and provided the most surprises. I was very interested in things like rocks and plants, too—but weather was always #1.
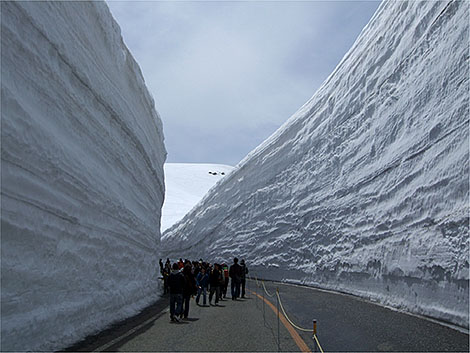
North American meteorologists, welcome to the snow climate of western Japan. Every year in winter lake effect-like snow events bury coastal cities in northern and central Japan under 20-30 feet of snow. Above is the “snow corridor” experienced each spring when the Tateyama Kurobe Alpine Route through the Hida Mountains reopens, revealing the season’s snows in its towering walls. The Hida Mountains, where upwards of 512 inches of snow on average accumulates each winter, are known as the northern Japanese Alps.
The tremendous snow accumulations largely occur from December to February during the East Asian winter monsoon when sea-effect snowbands form behind frequent cold outbreaks. But their snowfall isn’t just pretty to look at and play in — extreme snowfalls combined with dense populations in cities adjacent to the Sea of Japan such as Sapporo (pop. 1.95 million) are public safety hazards, turning exceptionally deadly every year. On average 100 people die and four times that number are injured from snow and ice in Japan, not only from snow removal but also from “roofalanches” — masses of snow sliding off roofs onto people.
Similar to their counterparts downwind of North America’s Great Lakes, the Sea of Japan snowbands invite research from Japanese scientists and those in many other locales where bodies of water enhance snowfall over populated lands. A new paper in BAMS by Jim Steenburgh (University of Utah) et al. not only highlights what’s known about the Japanese snow events but also is designed to “stimulate increased collaborations between sea- and lake-effect researchers and forecasters in North America, Japan, East Asia, and other regions of the world” who can collectively realize the “significant potential to advance our understanding and prediction of sea- and lake-effect precipitation.”
2018’s devastating Hurricane Michael struck the Florida panhandle at Mexico Beach and Tyndall Air Force Base in October at Category 5 intensity with 160 mph winds, the National Hurricane Center announced Friday. That’s 5 mph higher than Michael’s wind estimate of 155 mph at the time of landfall.
GOES-16 Pseudo-color image or Hurricane Michael at 1730 UTC October 10, 2018. (Image courtesy: NOAA NESDIS)
In its post-storm tropical cyclone report, released the same day, NHC stated it culled an abundance of wind data measurements not available in real-time to add the 5 mph to Michael’s wind intensity. The data came from aircraft reconnaissance, ground observations, satellite intensity estimates, surface pressures, and Doppler radar velocities from Eglin Air Force Base and the NWS in Tallahassee. The report goes in-depth with the data, explaining the observations and identifying those that were believable—a 152 knot (175 mph) aircraft wind measurement at 8,000 feet in the southeast eyewall that yields a surface wind of 137 knots (158 mph)—versus those that were suspect—a 152 knot (175 mph) surface wind measured by the stepped frequency microwave radiometer (SFMR) instrument aboard a different aircraft, deemed too high based on experience with such intense winds in hurricanes Irma, Jose, and Maria in 2017.
The upgrade makes Michael only the fourth Category 5 hurricane to hit the United States, joining a small, elite group of monster landfalling storms that include Hurricane Andrew (1992, 165 mph winds), Hurricane Camille (1969, 175 mph winds), and the Labor Day Hurricane (1935, 185 mph winds). Andrew plowed into South Florida, Camille landed on the Mississippi coast, and the Labor Day Hurricane devastated the Florida Keys.
A realty building destroyed by Hurricane Michael’s winds on the east side of Panama City, Florida. (Photo courtesy: Chris Cappella [AMS])
Hurricane Michael roared ashore on October 10 as the strongest hurricane on record to strike the Florida Panhandle, with a storm surge around 14 feet above ground level, destroying Mexico Beach and much of Tyndall AFB, while tearing apart homes and businesses in Callaway, just inland, as well as in the eastern side of Panama City. Sixteen people died directly from the hurricane due to storm surge flooding and the intense winds, which blew down entire forests in the panhandle and destroyed crops across southern Georgia. Wind damage extended into the Carolinas.
Very few surface observations of the hurricane’s intense winds were made at landfall. The highest gust was 139 mph measured by an anemometer at Tyndall AFB before it failed. Two coastal monitoring program towers measured 129 mph and 125 mph, substantially lower than the upgraded wind speed at landfall. One of the towers was knocked over before the peak winds struck, and the other was outside the hurricane’s core. NHC notes that the sites “were likely not optimally located to sample the maximum winds, which is typical during landfalling hurricanes.”
Hurricanes are classified by the Saffir-Simpson Scale and tornadoes by the Enhanced Fujita Scale, and now atmospheric rivers—those long, transient corridors of water vapor that fuel flooding rain events each winter in the West, especially California—will also be scaled to enhance awareness and bolster prediction.
The new AR scale ranks their intensity and potential impacts from 1 to 5 using the categories “weak,” “moderate,” “strong,” “extreme,” and “exceptional,” based on the amount of water vapor they carry and their duration. It is intended to describe the strength of ARs as beneficial to hazardous, aiding water management and flood response. “The scale recognizes that weak ARs are often mostly beneficial because they can enhance water supply and snow pack, while stronger ARs can become mostly hazardous, for example if they strike an area with conditions that enhance vulnerability, such as [where there are] burn scars, or already wet conditions,” says Marty Ralph and co-authors in a paper appearing in the February 2019 issue of BAMS and posted online as an early release today. “Extended durations can enhance impacts,” he says.
Ralph is director of the Center for Western Water and Weather Extremes (CW3E) at Scripps Institution of Oceanography and a leading authority on atmospheric rivers, which were officially defined by the AMS in 2017. The new scale was created in collaboration with NWS meteorologists Jonathan Rutz and Chris Smallcomb, and several other experts. It marks two decades of intensive field research that involved establishing a network of dozens and dozens of automated weather stations to observe ARs in real time and flying research planes through them as they crashed ashore and up and over the mountainous terrain of California, Oregon, and Washington.
Atmospheric rivers are the source of most of the West Coast’s heaviest rains and floods—roughly 80 percent of levee breaches in California’s Central Valley are associated with landfalling ARs. Research shows that a combination of intense water vapor transport for a long duration over a given area causes the biggest impact. But ARs also are primary contributors to the region’s water supply.
The newly created scale is designed to capture this combination, accounting for both the amount of available water and the duration it is available. It focuses on a period of 24-48 hours as its standard measurement. When an AR lasts in an area fewer than 24 hours it is demoted by one category, and if it persists more than 48 hours, it is promoted by a category. Unlike the operational hurricane scale, which has been criticized for inadequately representing the increased impacts of slower-moving, lower-end hurricanes, duration is a fundamental factor in the AR scale. It also aims to convey the benefits of ARs, not just the hazards.
“It can serve as a focal point for discussion between water managers, emergency response personnel and the research community as these key water supply and flood inducing storms continue to evolve in a changing climate,” says co-author Michael Anderson of the California Department of Water Resources.
The scale ranks ARs in five categories:
AR Cat 1 (Weak): Primarily beneficial. For example, a February 23, 2017, AR hit California, lasted 24 hours at the coast, and produced modest rainfall.
AR Cat 2 (Moderate): Mostly beneficial, but also somewhat hazardous. An AR on November 19-20, 2016, hit Northern California, lasted 42 hours at the coast, and produced several inches of rain that helped replenish low reservoirs after a drought.
AR Cat 3 (Strong): Balance of beneficial and hazardous. An AR on October 14-15, 2016, lasted 36 hours at the coast, produced 5-10 inches of rain that helped refill reservoirs after a drought, but also caused some rivers to rise to just below flood stage.
AR Cat 4 (Extreme): Mostly hazardous, but also beneficial. For example, an AR on January, 8-9, 2017, that persisted for 36 hours produced up to 14 inches of rain in the Sierra Nevada and caused at least a dozen rivers to reach flood stage.
AR Cat 5 (Exceptional): Primarily hazardous. For example, a December 29, 1996, to January 2, 1997, AR lasted over 100 hours at the Central California coast. The associated heavy precipitation and runoff caused more than $1 billion in damages.
When AR storms are predicted for the West Coast, the scale rankings will be updated and communicated on the CW3E website and its Twitter handle.
“The launch of the AR Scale marks a significant step in the development of the concept and its application,” Ralph commented in an e-mail to the AMS, “and caused me to reflect back a bit on where it came from. All the people and organizations who’ve contributed. The scientific debate around the subject. The creation of a formal definition for the Glossary of Meteorology. The creation of a 100-station mesonet to monitor them in California. The AR Recon effort underway in a partnership between Scripps and NCEP [now NCEI], and in collaboration with the Navy, NCAR, and ECMWF, as well as others. A number of papers are already in the works using the scale, and we are hopeful that it will prove useful for the public and for officials who must deal with storms in a large area where scales for hurricanes, tornadoes and nor’easters are not very applicable.”
Powerful Hurricane Lane is forecast to skirt if not directly hit Hawaii as a slowly weakening major hurricane today and Friday. Its track is unusual: most Central Pacific hurricanes either steer well south of the tropical paradise or fall apart upon approaching the islands. But a recent paper in the Bulletin of the AMS reveals that such intense tropical cyclones menace Hawaii more frequently than previously thought.
Hurricane Lane as of Thursday morning local time was packing sustained winds of 130 mph with gusts topping 160. Its expected track (below) is northward toward the middle islands today and early tomorrow, followed by a sharp left turn later Friday. When that left hook occurs will determine the severity of the impacts on Maui as well as Oahu, home to Hawaii’s capital and largest city, Honolulu. Although Lane is expected to slowly weaken due to increasing wind shear aloft, it appears that the Big Island of Hawaii, Maui, Molokai, and Oahu will be raked at a minimum by tropical storm winds gusting 55-70 mph, pounding surf, and heavy, potentially flooding rain. Hurricane conditions on these islands also are possible.
The last major hurricane to affect the islands with more than swells and heavy surf was Hurricane Iniki in 1992. It was passing well south of the islands when an approaching upper-air trough brought in steering flow out of the south, and Iniki made a right turn toward the western islands while intensifying into a strong Category 4 hurricane. It slammed directly into the garden island of Kauai with average winds of 145 mph and extreme gusts that damaged or destroyed more than 90 percent of the homes and buildings on the island. Iniki obliterated Kauai’s lush landscape, seen in its full splendor in such movies as Jurassic Park, which was filming there as the storm bore down.
The only other known direct hit on Hawaii was by 1959’s Hurricane Dot, which was a minimal Category 1 storm–the winds barely reaching threshold hurricane intensity of 74 mph when its center crossed Kauai. Without any prior record of major hurricane landfall, Iniki was not just rare, it was considered unprecedented.
Until now.
More than a century before Iniki, a major hurricane crashed into the Big Island, its intense right-front quadrant passing directly over neighboring Maui, causing widespread devastation on both islands. Its discovery is outlined in Hurricane with a History: Hawaiian Newspapers Illuminate an 1871 Storm, which details the narrative thanks to an explosion of literacy on the islands in the mid 19th century, which led to hundreds of local language newspapers that published eyewitness accounts of the storm.
Map showing the reconstructed track of the Hawaii hurricane across the eastern islands of Hawaii and Maui on 9 Aug 1871. Labeled red circles indicate the approximate time and location of the core of the storm. Green shading shows terrain altitude every 2,000 ft (610 m).
The new historical research, published in the January 2018 BAMS, found unequivocal evidence of an intense hurricane that struck August 9, 1871, causing widespread destruction from Hilo on the eastern side of the Big Island to Lahaina on Maui’s west side. A Hawaiian-language newspaper archive of more than 125,000 pages digitized and now made publicly available along with translated articles contained account after account of incredible damage that led the paper’s authors to surmise that at least a Category 3 if not a Category 4 hurricane hit that day.
The paper’s analysis is put forth as “the first to rely on the written record from an indigenous people” of storms, droughts, volcanic eruptions, and other extreme natural events. Accounts published in Hawaiian newspapers create a living history of the 1871 hurricane’s devastation, as recounted in the paper:
“On the island of Hawaii, the hurricane first struck the Hāmākua coast and Waipi‘o valley. The following is from a reader’s letter from Waipi‘o dated 16 August 1871:”
At about 7 or 8 AM it commenced to blow and it lasted for about an hour and a half, blowing right up the valley. There were 28 houses blown clean away and many more partially destroyed. There is hardly a tree or bush of any kind standing in the valley (Pacific Commercial Advertiser on 19 August 1871).
“An eyewitness from Kohala on Hawaii Island wrote the following:”
The greatest fury was say from 9 to 9:30 or 9:45, torrents of rain came with it. The district is swept as with the besom of destruction. About 150 houses were blown down. A mango tree was snapped as a pipe stem, just above the surface of the ground. Old solid Kukui trees, which had stood the storms of a score of years were torn up and pitched about like chaff. Dr. Wright’s mill and sugarhouse, the trash and manager’s residence, were all strewn over the ground (Ke Au Okoa on 24 August 1871).
“On Maui, newspaper reports document that Hāna, Wailuku, and Lahaina were particularly hard-hit. A writer in Hāna described the storm:”
Then the strong, fierce presence of the wind and rain finally came, and the simple Hawaiian houses and the wooden houses of the residents here in Hāna were knocked down. They were overturned and moved by the strength of that which hears not when spoken to (Ka Nupepa Kuokoa on 26 August 1871).
“In Wailuku the bridge was destroyed:”
… the bridge turned like a ship overturned by the carpenters, and it was like a mast-less ship on an unlucky sail.” (Ka Nupepa Kuokoa on 19 August 1871).
“From Lahaina came the following report:”
It commenced lightly on Tuesday night, with a gentle breeze, up to daylight on Wednesday, when the rain began to pour in proportion, from the westward, veering round to all points, becoming a perfect hurricane, thrashing and crashing among the trees and shrubbery, while the streams and fishponds overflowed and the land was flooded (Pacific Commercial Advertiser on 19 August 1871).
The BAMS paper concludes that the 1871 hurricane was “a compact storm, similar to Iniki.” Honolulu escaped damaging winds or rain despite such a close encounter.
Because such historical records have been unnoticed for so long, the paper notes “a number of myths have arisen such as ‘the volcanoes protect us,’ ‘only Kauai gets hit,’ or ‘there is no Hawaiian word for hurricane.’”
Today’s powerful Hurricane Lane and the newfound historical records go a long way to dispelling these misconceptions about the threat of hurricanes in the Hawaiian Islands.
Hurricanes like rapidly-changing Harvey are still full of surprises for forecasters.
The remnants of Caribbean Tropical Storm Harvey made a startling burst Thursday from a tropical depression with 35 mph winds to an 85 mph hurricane in a little more than 12 hours. It has been moving steadily toward a collision with the middle Texas coast and landfall is later Friday. If intensification continues at the same rate, Harvey is likely to be a major hurricane by then, according to a Thursday afternoon advisory from the National Hurricane Center, with sustained winds of 120-125 mph and even higher gusts.
That’s a big “if.”
The drop in central pressure, which had been precipitous all day—a sign of rapid strengthening—had largely slowed by Thursday afternoon. Harvey’s wind speed jumped 50 mph in fits during the same time, but leveled off by late afternoon at about 85 mph. Harvey was a strong Category 1 hurricane on the Saffir-Simpson Hurricane Wind Scale by dinner time.
The intensifying process then slowed. But it turns out this was temporary.
Many signs pointed to continued rapid intensification: a favorable, low-shear environment; expanding upper-air outflow; and warm sea surface temperatures. Overnight and Friday morning, Harvey continued to traverse an eddy of water with high oceanic heat content that has detached from the warm Gulf of Mexico loop current and drifted westward toward the Texas coast. Its impact is apparent as the pressure resumed its plunge and winds have responded, blowing Friday morning at a steady 110 mph with higher gusts.
Further intensification is possible.
In fact, the SHIPS (Statistical Hurricane Intensity Prediction Scheme) Rapid Intensification indices “are incredibly high,” Hurricane Specialist Robbie Berg wrote in the Thursday morning forecast discussion. Guidance from the model then showed a 70 percent chance of another 50 mph jump in wind speed prior to landfall. The afternoon guidance lowered those odds a bit, but still showed a a 64 percent probability.of a 35 mph increase.
It wouldn’t the first time a hurricane has intensified rapidly so close to the Texas coast. In 1999 Hurricane Bret did it, ramping up to Category 4 intensity with 140 mph winds before crashing into sparsely populated Kennedy County and the extreme northern part of Padre Island.
Hurricane Alicia exploded into a major hurricane just prior to lashing Houston in 1983. And 2007’s Hurricane Humberto crashed ashore losing its warm water energy source and capping its intensity at 90 mph just 19 hours after being designated a tropical depression that morning off the northern Texas Coast, a similar boost in intensity as Hurricane Harvey.
Rapid intensification so close to landfall is a hurricane forecasting nightmare. An abundance of peer-reviewed papers reveal that there’s a lot more we need to learn about tropical cyclone intensity, with more than 20 papers published in AMS journals this year alone. Ongoing research into rapidly intensifying storms like Harvey, is helping solve the scientific puzzle, including recent cases such as Typhoon Megi and Hurricane Patricia. Nonetheless, despite strides in predicting storm motion in past decades, intensification forecasting remains largely an educated guessing game.
The National Hurricane Center released its post-storm report on Hurricane Sandy this week, confirming the many nuances of the late-season monster storm we already knew. Yet it’s the details, provided by scientists attuned to getting the minutiae right, that make the report an inviting read.
For starters, the NHC report confirms that Sandy wasn’t a hurricane at landfall. Its core convection collapsed as the center of the storm moved west of the warm waters of the Gulf Stream—the same warm waters that earlier on the day of landfall (October 29, 2012) cranked up Sandy’s winds to 100 mph as the center closed in on New Jersey. Cold air wrapping into Sandy’s center contributed to the collapsing convection, and this structural change transitioned Sandy from tropical to extratropical just 50 miles offshore of Atlantic City. Estimated inundation in feet above ground level in New Jersey, New York, and Connecticut from Sandy. (Source: NHC Tropical Cyclone Report—Hurricane Sandy)
Post analysis of the storm’s intensity in the Caribbean also explains why NHC has now upgraded Sandy to a Category 3 “major” hurricane with 115 mph winds from Category 2, which at the time had been considered the peak classification prior to landfall in southeastern Cuba. The destruction wrought there, described as “especially severe,” included more than a quarter-million homes damaged and 17,000 sheared to pieces by the extreme winds. Gusts topped 110 mph before disabling the anemometer in Santiago de Cuba, the island nation’s second-largest city, and reached an incredible 165 mph at Gran Piedra (“Big Rock,” elev. 2,000 feet) in the national park east of the city. Sandy killed 11 people in Cuba, an unusually high number in a nation that has weathered numerous ferocious hurricanes with lesser loss of life. It was a testament to Sandy’s fury.
Additionally, the report describes changes proposed to NHC’s watch/warning criteria. If adopted, they will address limitations to the use of tropical storm and hurricane watches and warnings when tropical cycl0nes transition to extratropical (i.e., non-tropical or “post tropical”) storms. Facing the potential for Hurricane Sandy to make such a transition prior to striking the Northeast, NHC opted not to issue hurricane watches and warnings north of North Carolina because the transition would force NHC to discontinue them even though the threat for severe wind and tidal conditions remained, which “would cause an unacceptable level of confusion and disruption during critical periods of preparation that included evacuations.” The decision was widely criticized and cited as contributing to the large number of deaths due to storm surge flooding and falling trees in and around New York City.
The report has much more, including details about the record storm tides in New York City, New Jersey, and Connecticut, flooding rain in the mid-Atlantic states, and snow in the Appalachians, as well as a breakdown of U.S. deaths and an abundance of observations. Town Hall Meeting on Sandy
Recordings of the the presentations made at the AMS Town Hall Meeting on Hurricane Sandy at the Annual Meeting in Austin are now available. Hurricane Sandy Introduction
Tanja Fransen, NOAA/NWS, Glasgow, Montana Introduction to Sandy and the Major Impacts
Louis W. Uccellini, NOAA/NWS/NCEP, Camp Springs, Maryland Hurricane Sandy: Hurricane Wind and Storms Surge Impacts
Richard D. Knabb, NOAA/NWS/NHC, Miami, Florida Post-Tropical Cyclone Sandy: Rain, Snow and Inland Wind Impacts
David Novak, NOAA/NWS/Hydrometeorological Prediction Center, College Park, Maryland A Research-Community Perspective of the Life Cycle of Hurricane Sandy
Melvyn A. Shapiro, NCAR, Boulder, Colorado Communicating the Threat to the Public through Broadcast Media
Bryan Norcross, The Weather Channel, Atlanta, Georgia Following the Storm through Social Media
Jason Samenow, Washington Post, Washington, D.C.; and Andrew Freedman, Climate Central, New York, N.Y. Storm Response in New York and New Jersey
Eric Holthaus, The Wall Street Journal, New York, N.Y.
It hasn’t even been a month since violent, history making tornadoes made headlines across the United States, and yet here we are with another grim tornado record. The death toll from the violent tornado that shredded as much as a third of Joplin, Missouri, Sunday evening reached 116 Monday afternoon. That makes it the single deadliest tornado to strike the United States since NOAA began keeping reliable records of tornado fatalities in 1950. It took the top spot from the Flint, Michigan, twister of June 8, 1953, which killed 115.
The number of dead in Joplin jumped from 89 earlier in the day as news of recoveries as well as rescues were reported. While the number of dead is fully anticipated to increase, news outlets reported that at least five missing families were found buried alive in the rubble, which stretches block after unrecognizable block across six miles of the southwestern Missouri city of 50,000. More than 500 people in Joplin were injured, and the damage is eerily familiar, looking so much like the utter carnage witnessed in Tuscaloosa on April 27, 2011, when 65 died in that day’s twister.
The tornado event attributed to the single highest loss of life on American soil is the “Tri-State” tornado of March 18, 1925, which rampaged across southeastern Missouri, southern Illinois, and into southwestern Indiana. It killed 695 people on its seemingly unending 219-mile journey. But that was prior to our knowledge of families of tornadoes and the cyclical nature of long-lived supercell thunderstorms to form, mature, dissipate, and reform tornadoes, keeping damage paths seemingly continuous.
Prior to the effort by the U.S. Weather Bureau, precursor to the National Weather Service and NOAA, to maintain detailed accounts of tornadoes—and 64 years before yesterday’s event in Joplin—the last single-deadliest tornado in a long list of killer U.S. tornadoes was the 1947 Woodward, Oklahoma, tornado, which claimed 181 lives.
Yesterday there was also one fatality from a destructive tornado that hit Minneapolis, and that and Joplin’s toll combined with last month’s back-to-back tornado outbreaks, plus a handful of earlier tornado deaths this year, brings 2011’s death toll from tornadoes to 482—more than eight times the average of the past 50 years and second (in the modern era) only to the 519 recorded deaths from twisters in 1953. Two-thirds of this year’s fatalities occurred during April 27’s epic tornado outbreak across the South. The Weather Channel has been providing continuing coverage of the rescue and recovery efforts in Joplin, with one of its crews arriving on scene moments after the tornado. The level of destruction in the city was too much to bear even for one of its seasoned on-air meteorologists. TWC also is reporting along with NOAA’s Storm Prediction Center on the possibility of yet another tornado outbreak, this time in the central Plains on Tuesday.
The numbers practically defy comprehension: 327 people killed in a single day; nearly that many reports of tornadoes that fateful day, April 27, 2011, when nature went on a spectacular rampage across the South; violent tornadoes in Mississippi, Alabama, Tennessee, and Georgia that generated winds of 180 mph, 190 mph, over 200 mph, ripping bark from trees, pavement from roads, even earth from the ground (video from The Weather Channel explains the scouring), and people from their homes and businesses, in cities and towns small and large; tornadoes that chewed up and spat out lives and belongings, mile after mile, for 132 miles straight in one twister. Having watched similarly violent yet lesser events unfold over the years and decades as warning times have steadily increased, in some cases long enough to jump in your car and drive out of harm’s way, it did not seem possible we’d ever again witness such devastation and widespread death from tornado winds, especially in a nation that has the best warning system for severe weather in the world. As has become painfully clear these last two weeks, however, one has to look way back to 1925—more than an average human lifetime ago—when either a single, marathon twister or a family of vicious vortices known as the Tri-State Tornado thundered across 219 consecutive miles of the Midwest and consumed nearly 700 lives—to find similarly overwhelming tragedy from tornadoes in the United States in a single day. Annual tornado climatology and statistics for our nation make the historic events of April 27, 2011, even more difficult to believe: 60 people on average lose their lives to tornadoes each year–and for the past decade we’ve considered that number to be excessive; it takes 365 days annually to produce the 1,300 tornadoes we usually have, yet almost a quarter of those may now have happened in just a single 24-hour period (there were 292 reports of tornadoes on April 27, and the NWS has confirmed 143 so far); and fewer than 1% of all tornadoes recorded on our soil over decades ever churn with such violence that they are rated in the top tier of the Fujita tornado intensity scale, regardless of its evolving criteria … yet we had at least three of these most destructive tornadoes strike Mississippi and Alabama on this recent deadly April day.
Stunned weather enthusiasts and meteorologists alike have been searching for more than a week for ways to classify this maelstrom of tornadoes. Some have tried to fit this event into the mold created by the most prolific and extraordinary tornado event in U.S. history—the Super Outbreak of April 3-4, 1974, which in just 18 hours delivered 148 tornadoes that tore up more than 2,500 miles of 13 Midwestern, Southern, and Eastern states and included 30 tornadoes rated violent 4s and 5s at the top end of the original Fujita tornado intensity scale.
Bloggers are beginning to offer comparisons between April 27 and that historic day, nearly four decades ago, especially because the Super Outbreak’s toll of 330 killed is comparable. The event two weeks ago is considered a “textbook” tornado outbreak: “I mean, literally what I learned from a textbook more than 30 years ago,” writes Senior Forecaster Stu Ostro of The Weather Channel (TWC) on his blog. “Not only were the (atmospheric) elements perfect for a tornado outbreak, they were present to an extreme degree,” he notes. It was of the caliber defined by the Palm Sunday outbreak of 1965, the blitzkrieg of twisters across the Ohio Valley on May 29-30, 2004, as well as the Super Outbreak, which Greg Forbes, TWC Severe Weather Expert, says has since become the benchmark for all tornado outbreaks. Indeed, just last year Storm Prediction Center (SPC) tornado and severe weather forecaster Steve Corfidi, et al., published the article “Revisiting the 3–4 April 1974 Super Outbreak of Tornadoes,” in which they state: “The Super Outbreak of tornadoes over the central and eastern United States on 3–4 April 1974 remains the most outstanding severe convective weather episode on record in the continental United States.” What happened on April 27, 2011, however, may have rewritten the tornado textbook, and reset that benchmark, states Jon Davies, a meteorologist and noted Great Plains storm chaser who has been studying severe weather forecasting for 25 years. He wrote in a blog post last week that the setup for tornadoes on April 27, 2011 was “rare and quite extraordinary.” The combination of low-level wind shear and atmospheric instability was “optimum,” creating a “tragic and historic tornado outbreak [that] was unprecedented in the past 75 years of U.S. history, topping even the 1974 ‘Super Outbreak.’”
That comparison is the ongoing debate as the severity of the tornadoes defining the outbreak of April 27 comes into better focus. So far, 14 of its tornadoes have been rated 4 or greater on the Enhanced Fujita (EF) Scale. With more than twice that many in the Super Outbreak, which were rated using the earlier Fujita tornado intensity scale (compare the two scales), it would seem this new event falls short. But Forbes cautions that likening the April 27 tornado outbreak to the Super Outbreak simply using number of violent tornadoes has its pitfalls.
“I was part of the team that developed the EF Scale, and it’s a system that more accurately estimates tornado wind speeds. But it troubled me then (and still does) that it might be hard to compare past tornado outbreaks with future ones and determine which was worst. It’s apples and oranges, to some extent, in the rating systems then and now.”
That’s a statement that could be applied to today’s severe weather forecasting, technological observation, and warnings for severe weather, which have improved significantly in the last 37 years. In his blog post, Recipe for calamity, NCAR meteorologist Bob Henson looks beyond the ingredients that caused the April 27 tornado outbreak and seeks to consider why the human toll of this tragedy was so massive. He mentions that some parts of the South had been hit by severe thunderstorms and damaging winds earlier that day, which knocked out power and may have disrupted communications in areas that tornadoes barreled through later in the afternoon and evening. The speed of the twisters as well as the lack of safe places to hide from such extreme winds also likely fed the outcome. Of note, too, is mention that perhaps the density of the population centers hit by such dangerous winds resulted in a far greater toll than otherwise would have been realized. This insight comes from Roger Edwards, a forecaster and tornado researcher with SPC. Edwards has a long track record of trying to better educate a populace about the realities of severe storms and tornadoes. He blogged about the catastrophe on April 27, 2011, offering this matter-of-fact consideration: “When you have violent, huge tornadoes moving through urban areas, they will cause casualties.” Edwards then follows this statement, in a subsequent post on the April 27 tornado outbreak, with a poignant look at where we seem to be in the inevitable collision of an expanding population with bouts of severe weather:
“I can say fairly safely that a major contributor here clearly was population density. Even though 3 April 1974 affected a few decent sized towns (Xenia, Brandenburg) and the suburbs of one big metro (Sayler Park, for Cincinnati), a greater coverage area of heavy developed land seemed to be in the way of this day’s tornadoes. How much? I’d like to see a land-use comparison. Harold Brooks and Chuck Doswell [current and retired tornado scientists with the National Severe Storms Laboratory, respectively] have discussed the phenomenon of sprawl as a factor in future tornado death risk and the possible nadir of fatalities having been reached…and the future seems to have arrived.”
Viewing this spring’s deadly onslaught of severe weather through that lens makes it all too clear we’ve been here before: recall a late-August Monday on the central Gulf Coast nearly six years ago shattered by an almost unimaginable, hurricane-whipped surge of seawater that drowned coastal communities in southeast Louisiana, Mississippi, and Alabama. Ostro prefers to use the perspective that event gave us when sizing up the April 27 tornado event:
“So that makes this the Katrina of tornado outbreaks, in the sense that it’s a vivid and tragic reminder that although high death tolls from tornadoes and hurricanes are much less common than they were in the 19th and first part of the 20th centuries, we are not immune to them, even in this era of modern meteorological and communication technology.”
A focus on the human toll of the April tornado tragedy might be the facet that really sets this outbreak apart. One of the most remarkable reports came from Jeff Masters’ blog entry of May 5, 2011—eight days after the outbreak. Noting the extreme number of deaths from the tornadoes and how the toll had fluctuated because some victims were counted twice, he wrote: “There are still hundreds of people missing from the tornado, and search teams have not yet made it to all of the towns ravaged by the tornadoes.” Hundreds missing. Even if that number is off by a factor or 10, this outbreak will be historic for its toll in human lives. Almost two weeks since the outbreak, Alabama’s Emergency Management Agency continues to post daily situation reports in which it states that the number of casualties in the state is “to be published at a later time.” The reasons are spelled out vividly in this blog post from The Huntsville Times, which details accounts from survivors of perhaps the day’s most violent tornado, an EF5 with winds estimated at 210 mph that destroyed much of Hackleburg, a town of 1,600 people in northwest Alabama. At least 18 people lost their lives there. Twenty-one-year-old resident Tommy Quinn said only one person died on his street, the Times reports. But six days after the tornado obliterated the area, a neighbor still hadn’t been found. “We can’t even find her house,” Quinn said.
As is evident in this blend of writings and perceptions, the devastatingly deadly tornado outbreak of April 27, 2011, was an epic event, rivaling even the most revered such disaster in the modern era. What these experts and others are finding, though, is that while the April 27 outbreak was indeed exceptional in many ways, and history will likely reveal it to be a meteorological event unprecedented in some aspects, it seems the Super Outbreak of 1974 won’t be stripped of its meteorological prominence, at least not fully. Instead, the tornado outbreak that occurred on April 27, which was truly remarkable, will be referred to in its own way, likely earning a signature nom de guerre through its shockingly violent legacy.

 Last week’s derecho, roaring 750 miles from eastern Nebraska across Iowa, Illinois and Indiana, was particularly ferocious with winds in multiple swaths across Iowa gusting to over 100 mph. The National Weather Service found damage to an apartment complex in Cedar Rapids, Iowa, consistent with wind gusts of an astonishing 130-140 mph. But even these extreme winds and the severe damage they wrought don’t tell the whole story of the variation in these windy storms with the seemingly odd name.
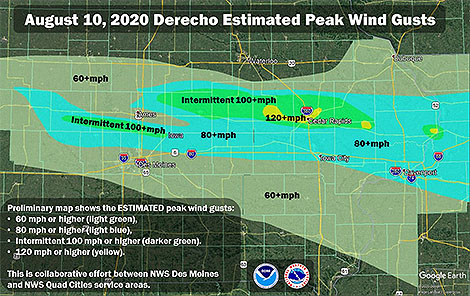 The AMS
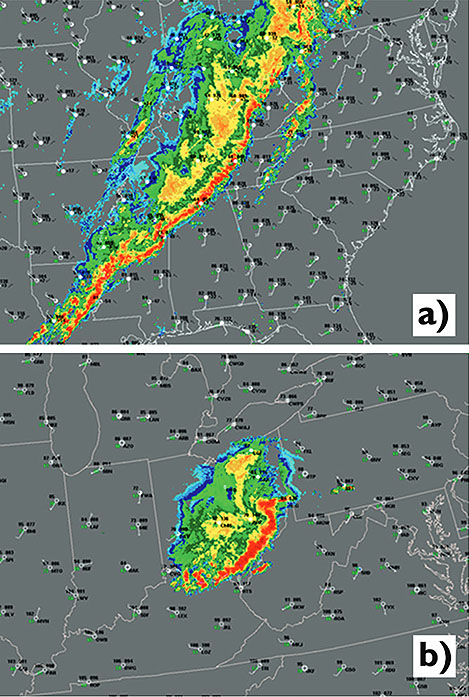
 North American meteorologists, welcome to the snow climate of western Japan. Every year in winter lake effect-like snow events bury coastal cities in northern and central Japan under 20-30 feet of snow. Above is the “snow corridor” experienced each spring when the Tateyama Kurobe Alpine Route through the Hida Mountains reopens, revealing the season’s snows in its towering walls. The Hida Mountains, where upwards of 512 inches of snow on average accumulates each winter, are known as the northern Japanese Alps.
 “The scale recognizes that weak ARs are often mostly beneficial because they can enhance water supply and snow pack, while stronger ARs can become mostly hazardous, for example if they strike an area with conditions that enhance vulnerability, such as [where there are] burn scars, or already wet conditions,” says Marty Ralph and co-authors in a paper appearing in the February 2019 issue of BAMS and