By Anjuli S. Bamzai, AMS President
My graduate advisor at George Mason University, Dr. Jagadish Shukla, displayed the photos of four meteorologists in his office: Drs. Norman A. Phillips, Jule Charney, Edward Lorenz, and Syukuro “Suki” Manabe. All giants in their field, they had been his PhD advisers at Massachusetts Institute of Technology (MIT). In the 1990s, as I pursued my graduate degree at Dr. Shukla’s Center for Ocean-Land-Atmosphere Studies (COLA), the scientific family tree remained strongly connected, and so I in turn had the chance to cross paths with luminaries like Manabe in person.

Circa 1994, I had the privilege of hearing Manabe–or, as I came to refer to him, Suki-san–give the inaugural talk at the newly established COLA. He spoke about the use of dynamical general circulation models to study the atmosphere and its coupling to land, using a simple ‘bucket’ model to discover emergent properties of this complex, chaotic system. He was an animated speaker; it was apparent that he was driven by curiosity and sheer love of the science that he was pursuing.
I was inspired by his ability to explain the properties of such a complex system as the Earth in such elegant terms. Suki-san’s clarity and scientific passion resulted in contributions to our understanding of climate the importance of which cannot be overstated. As I began my own foray into Earth system science, those initial interactions were a formative experience.
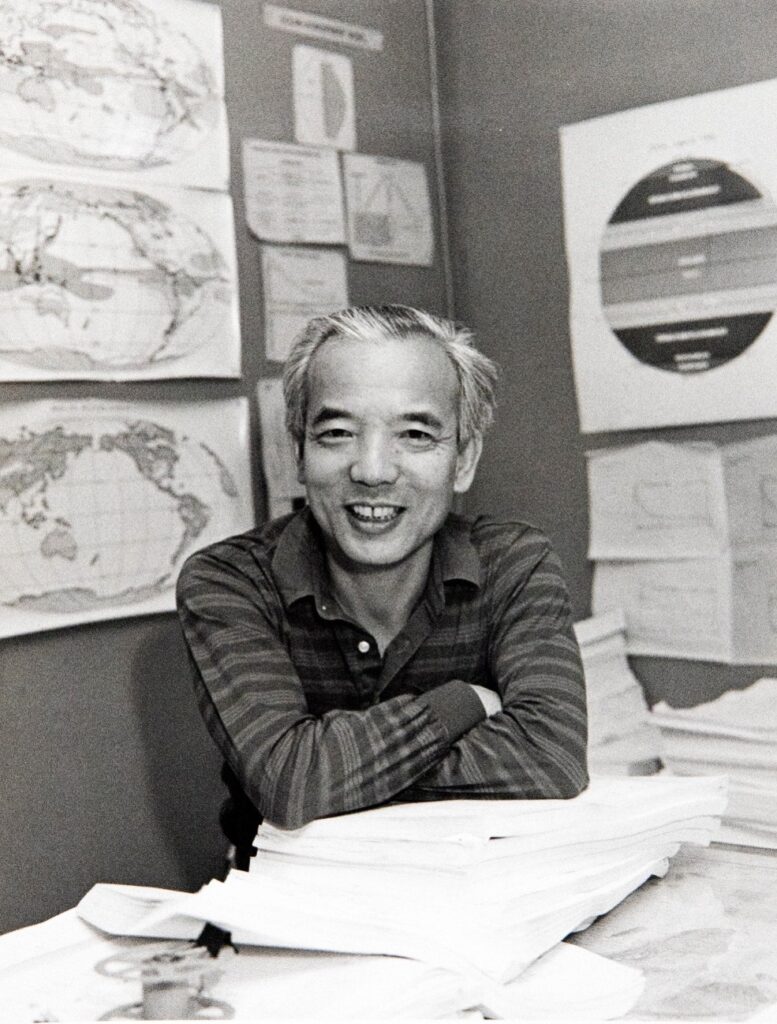
Left: Suki-san enjoying his work. Photo courtesy of Dr. V. Ramaswamy.
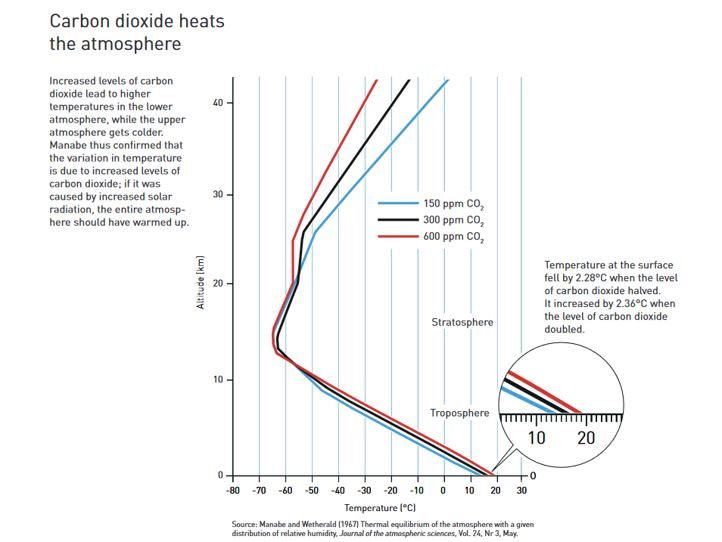
The models he used were relatively simple compared to the complex Earth system models of today. Yet Manabe and Wetherald (1967), published in the AMS’s Journal of the Atmospheric Sciences, is arguably one of the most influential papers in climate science. It demonstrated a key feature of the atmosphere with an increase in carbon dioxide: rising temperatures closer to the ground while the upper atmosphere got colder. If the variation in solar radiation was primarily responsible for the temperature increase, the entire atmosphere would have gotten warmer.

The work that Suki-san and his team conducted comprised a major component of the 1979 report, “Carbon dioxide and climate: A scientific assessment.” Led by Jule Charney from MIT, it is now commonly referred to as the Charney Report. The main result of the succinct 22-page report was that “the most probable global warming for a doubling of [atmospheric] CO2 [is] near 3°C with a probable error of ± 1.5°C.” Perhaps most importantly, the report ruled out the possibility that increasing CO2 would have negligible effects. This estimate of climate sensitivity has pretty much withstood the test of time; in the past forty years, annual average CO2 concentrations increased by ~ 21% and the global average surface temperature increased by ~0.66°C. How prescient!
Suki-san was one of the panelists who shared their insights at a session that the National Academy of Sciences’ Board on Atmospheric Sciences and Climate (BASC) convened during its November 2019 meeting to commemorate the 40th anniversary of the Charney Report. Suki-san’s concluding slide pretty much summed up his philosophy: make your model just as complicated as it needs to be, no more. (See photo below.)
![Panelists photo and concluding slide. Slide text says, "Concluding Remarks:
[Bullet point one] Satellite observation of outgoing radiation over annual and inter-decadal time scale should provides macroscopic constraint that is likely to be useful for reducing large uncertainty in climate sensitivity.
[Bullet point two] It is desirable to make parameterization of subgrid-scale process 'as simple as possible', because simpler parameterization is more testable."](https://blog.ametsoc.org/wp-content/uploads/2024/05/Manabe_BASC-NAS-meeting_compound-1024x383.png)
October 5, 2021, was such an exciting day to wake up to! The Nobel Prize in Physics was shared by Drs. Syukuro Manabe, Klaus Hasselman, and Giorgio Parisi. The citation reads: “The Nobel Prize in Physics 2021 was awarded for groundbreaking contributions to our understanding of complex physical systems” with one half jointly to Syukuro Manabe and Klaus Hasselmann “for the physical modelling of Earth’s climate, quantifying variability and reliably predicting global warming,” and the other half to Giorgio Parisi “for the discovery of the interplay of disorder and fluctuations in physical systems from atomic to planetary scales.”
As he eloquently stated on the momentous day that he received the Nobel Prize, “I did these experiments out of pure scientific curiosity. I never realized that it would become a problem of such wide-ranging concern for all of human society.”
The accompanying press release on the Nobel Prize particularly cites Suki-san’s work at NOAA in the 1960s, noting that “he led the development of physical models of the Earth’s climate and was the first person to explore the interaction between radiation balance and the vertical transport of air masses. His work laid the foundation for the development of current climate models.”


Left: Event to honor Nobel Laureate Dr. Suki Manabe at National Academy of Sciences. (Left to right) Drs. Jagadish Shukla, Suki Manabe and Marcia McNutt, President National Academy of Sciences. Photo courtesy of Dr. J. Shukla. Right: (Left to right) Drs. V. Ramaswamy, Director, NOAA GFDL, Suki Manabe, and Whit Anderson, Deputy Director, NOAA GFDL, celebrating the big news of Suki-san’s Nobel Prize, October 2021. Photo courtesy of Dr. V. Ramaswamy.
It is no exaggeration to state that the modeling findings by Suki Manabe and, about a decade later, Klaus Hasselman, opened not only an era of climate modeling but also an entirely new subfield of climate science, viz., detection and attribution (D&A) through fingerprinting and other techniques. Observations have provided an important reality check to model simulations through these D&A efforts.
The current torchbearers of the D&A tradition are Drs. Ben Santer, Tim DelSole, Reto Knutti, Francis Zwiers, Xuebin Zhang, Gabi Hegerl, Claudia Tebaldi, Jerry Meehl, Phil Jones, David Karoly, Peter Stott MBE, Tom Knutson, and Michael Wehner, among others. Over the years several of them have also gone on to receive AMS awards—including, in Meehl’s case, the Jule G. Charney Medal. Speaking of awards, Jonathan Gregory is the most recent recipient of AMS’s Syukuro Manabe Climate Research Award, which has also been bestowed on Drs. Joyce Penner and Cecilia Bitz. Next year, consider nominating someone for the Manabe Award, the Charney Medal, or the new Jagadish Shukla Earth System Predictability Prize!


Those of us in the atmospheric and related sciences benefit directly from Suki Manabe’s scientific legacy and intellectual passion, and all of human society owes Suki-san a great debt for helping us to understand climate change, one of the greatest challenges humankind has ever faced.
Anjuli is grateful to Katherine ‘Katie’ Pflaumer for providing useful edits.
