Beacons Will Light Up New Orleans

by Ken Carey, Chair, AMS Membership Committee

On behalf of the Membership Committee, I am writing to encourage you to nominate as “Beacons” members of the AMS Executive Committee, Council, Commission, Boards and Committees for service during the upcoming 92nd AMS Annual Meeting in New Orleans, Louisiana.  The New Orleans meeting will be the second annual meeting at which Beacons will be present. By of explanation, here is an FAQ about the Beacons program:

What is the Beacons Initiative? The AMS Beacons program began in 2011 as an initiative of the Membership Committee and is firmly rooted in former Executive Director Kenneth Spengler’s legacy of fostering the AMS as an open, inclusive, and welcoming organization. The Beacons program is an ambassador program with a “member-staffed goodwill cadre” reflecting AMS’ initiatives to serve its existing, returning, and potentially new members.  AMS Beacons serve at the pleasure of the AMS Executive Director, and assist with Society and membership-related functions as deemed necessary or appropriate at AMS annual, STAC, and local chapter meetings and other functions.  Merriam-Webster’s online dictionary defines the word beacon as “a source of light or other signal for guidance; a source of light or inspiration.”  This adequately describes what Beacons aspire to be and why the current Beacons have chosen to participate.

Why do we need AMS Beacons? The AMS is the nation’s premiere professional organization in the meteorological and related sciences. It is a broad but close-knit community of weather enthusiasts, researchers, forecasters, practitioners, educators, and students, all working to advance the atmospheric and related sciences, technologies, applications and services.  Preliminary findings from AMS surveys and membership committee activities suggest that some members within our community are: (1) unaware of the full value of Society membership, (2) uncertain of or dissatisfied with the value of the membership, or (3) feel disconnected from the broader Society activities.  Feedback from some members and non-members also indicates that there is a perception that the Society is aloof, elitist, or academic-centric.  While these perceptions do not reflect the majority of viewpoints, they do represent a significant number that could adversely affect AMS membership and its growth potential. The Beacons Program is a “grass-roots” initiative at very minimal cost to provide resources and “friendly-faces” at the annual meeting and other functions with the goal of connecting and retaining current members, encouraging new membership, and reclaiming past members.

What will Beacons do at the Annual Meeting? Beacons will serve throughout the week making themselves available to answer questions about the Society and to visit with and assist participants as needed throughout the week. Beacons will have a significant presence at the New Attendee Briefing on Sunday, will be stationed at key locations (e.g., registration area, entryways, meetings with large gatherings, etc.), and informally greet and assist as they move throughout the venue during the week. Beacons will serve as a volunteer, complementary resource to the AMS staff and will be properly trained on what questions and information should be referred to AMS staff members.  In order to be easily recognized, Beacons will wear bright yellow (i.e., as in “Beacon of Light”) lanyards with AMS blue lettering. Additionally, signs, social networking media (e.g., the AMS Facebook site or Twitter) and future blog postings will notify attendees of the presence and function of AMS Beacons.

How does someone become a Beacon? This is where we are hoping for your involvement. Beacons are:  (1) full Members in good standing with AMS, (2) relatively knowledgeable of AMS policies and procedures, (3) open to meeting new people, and (4) willing to donate a few hours of their time at the annual meeting as needed.  In addition, Beacons should be individuals who are comfortable with discussing issues regarding the Society with Annual Meeting participants as appropriate.   If you are interested in volunteering as a Beacon, or in nominating a member of your Commission, Board, or Committee, or other worthy individual to be a Beacon, please contact Beth Farley ([email protected]) by November 1, 2011. Please include contact information for yourself or your nominees as well as a brief statement as to why the person is being nominated as a Beacon.

What happens after the Annual Meeting in New Orleans? After the 2012 AMS Annual Meeting, the membership committee will review the effort to compile a set of “lessons learned.” This information will be used to further develop and refine the fledgling Beacons program.
Looking at the Sun in a New Light

With orbiting observatories and solar probes now available to scientists, it might seem that studying the Sun (and its effects on weather and climate) has largely shifted to space-based technology. But in fact, ground-based monitoring of the Sun provides significant opportunities that aren’t possible from space. And the future of looking at the Sun from Earth is primed to become brighter with the recent announcement that the National Solar Observatory (NSO) will be moving to the University of Colorado at Boulder.
The NSO currently operates in two locations: Kitt Peak National Observatory in Arizona and Sacramento Peak Observatory in Arizona. The consolidation of these two locations and the move to Colorado will be a multiyear process, with the actual physical relocation to begin around 2016.
The move will include the deactivation of older telescopes–some of which date to the 1950s–and will coincide with the construction of the Advanced Technology Solar Telescope (ATST), which when completed will be the largest optical solar telescope in the world. The ATST will be located in Hawaii, but the new NSO in Boulder will be the ATST’s science, instrument development, and data analysis center.
The dual projects should result in major advancements for solar exploration from the ground. The ATST will provide “unprecedented resolution and accuracy in studying the finescale magnetic field and solar activity that controls what happens in the solar atmosphere and beyond,” according to the NSO’s Stephen Keil.
Jeff Kuhn of the University of Hawaii explains how the ATST will be valuable in studying the Sun’s magnetic field, which drives much of the sun’s activity:

Most of the changes that happen on the Sun are caused by changes in magnetic fields,  and the ATST is a very specialized instrument that allows us to see those changes, and in fact has a sensitivity to measure changes in the magnetic field at the same kind of magnetic field strength as the . . . magnetic field that exists on the Earth that makes your compass needle work.

The high-resolution images needed to study the Sun’s magnetic field require very large telescopes that are too expensive to send into space. With the development of adaptive optics technology, ground-based observations are now much sharper than in the past, allowing for the study of “extremely small, violently active magnetic fields that control the temperature of the corona, and the solar wind, that produce flares [and] x-ray emission,” according to Eugene Parker of the University of Chicago.
Additionally, ground-based observatories have the capability of not just creating images, but also of making movies that track solar changes on time scales of minutes or even seconds.
The NSO has created a video (available on this page) that explains more about the atmospheric effects of solar activity and other advantages of ground-based solar research.

Rainbow Hunters Strike Optical Gold

Usually when you go hunting for rainbows, you turn your back to the sun. And if you’re lucky, especially if the clouds are dark enough, you get not one but two richly hued bows.

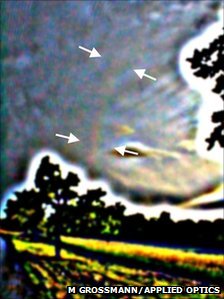
Michael Grossmann found this tertiary rainbow in May, in Kaempfelbach, Germany.

Until this year, that was all there was to the pot of gold that enthusiasts of optical phenomena could hope for. Then last year Raymond Lee, a U.S. Naval Academy meteorologist, went a step further from his classic studies of rainbows and light scattering in the atmosphere to predict that a third (tertiary), and even a fourth (quaternary) bows are possible if you look just 40 degrees from a bright sun surrounded by dark clouds.
Lee’s historical survey yielded just four potential observations of these elusive bows in more than two centuries of records. They’re barely visible, and only if you know where to look.
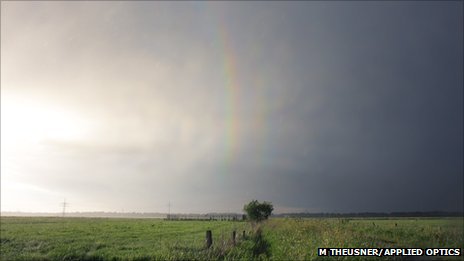
All of a sudden now, thanks to Lee’s guidance, two more observations have been added by rainbow chasers in Germany. They published their observations in a special issue of Applied Optics last week. To preserve the weakly lit bows on camera required special post image processing. Nonetheless we know gold when we see it. No longer is it enough to turn your back on the Sun.
Triple and quadruple bows photographed in June by Michael Theusner.

AMS Climate Course To Reach 100 More Minority-Serving Institutions

The AMS Education Program has been awarded a grant by the National Science Foundation (NSF) to implement the AMS Climate Studies course at 100 minority-serving institutions (MSIs) over a five-year period. The project will focus on introducing and enhancing geoscience coursework at MSIs nationwide, especially those that are signatories to the American College & University Presidents’ Climate Commitment (ACUPCC) and/or members of the Louis Stokes Alliances for Minority Participation. AMS is partnering with Second Nature, the non-profit organization administering the ACUPCC.
“This national network involves more than 670 colleges and universities who are committed to eliminating net greenhouse gas emissions from campus operations by promoting the education and research needed for the rest of society to do the same,” explains Jim Brey, director of the AMS Education Program. “AMS and Second Nature will work together to demonstrate to current and potential MSI signatories how AMS Climate Studies introduces or enhances sustainability-focused curricula.”
In the first four years of the project, AMS will hold a weeklong AMS Climate Studies course implementation workshops for about 25 MSI faculty members. The annual workshops will feature scientists from NOAA, NASA Goddard Space Flight Center, University of Maryland, Howard University, George Mason University, and other Washington, DC area institutions. Faculty will initially offer AMS Climate Studies in the year following workshop attendance and colleges that successfully implement AMS Climate Studies will be encouraged to build a focused geoscience curricula area by also offering AMS Weather Studies and AMS Ocean Studies.
“The major outcomes of this project will be a large network of faculty trained as change agents in their institutions, sustained offering of AMS undergraduate courses within MSIs, and the introduction of thousands of MSI students to the geosciences,” comments Brey. He notes that this project builds on the success of similar NSF-supported programs for MSI faculty implementing the AMS Weather Studies and AMS Ocean Studies courses, which together have reached 200 MSIs and over 18,000 MSI students. “We’re looking forward to working with Second Nature to continue to expand the climate course and the education that it represents.”

Mapping Ice Flow in Antarctica

A recently released map of the speed and direction of ice flows across Antarctica not only reveals some previously undiscovered geographical features, but also suggests a new explanation for how ice moves across the continent. Researchers constructed the map after studying billions of data points taken from a number of polar-orbiting satellites. After accounting for cloud cover, solar glare, and various land features, the scientists were able to determine the shape and speed of glacial formations across Antarctica. They found that some formations moved as much as 800 feet per year, and they also discovered a previously unknown ridge that runs east-to-west across the continent. The NASA animation below shows the ice flow patterns. “This is like seeing a map of all the oceans’ currents for the first time,” says Eric Rignot of the University of California—Irvine, who led the study (subscription required for access to the full article). “It’s a game changer for glaciology.” The observations also showed that the ice moves by slipping and sliding along the land, and not by being crushed and broken down by ice above it, as had previously been theorized by many glaciologists. That difference is critical to forecasting sea level rise in decades to come since a loss of ice at the water’s edge means “we open the tap to massive amounts of ice in the interior,” according to Thomas Wagner of NASA’s cryospheric program.

Weather-Ready or Not, Here We Come

The year so far has been expensive when it comes to disasters. Make that record-breaking expensive. According to NOAA, with nine separate big-money disasters, the losses have already reached $35 billion. In response, the NWS—in partnership with other government agencies, researchers, and the private sector—is building a plan to make the country “Weather-ready.”  Earlier this week, officials from various agencies participated in a group discussion with the goal of understanding the threats extreme weather poses today and what can be done about it. Specifically, they want people nationwide to develop plans they can implement quickly to protect themselves when severe weather strikes.
“Building a Weather-ready nation is everyone’s responsibility,” comments Eddie Hicks, U.S. Council of International Association of Emergency Managers (IAEM USA) president. “It starts with the NWS and emergency managers, like IAEM USA, but it ends with action by individuals and businesses to reduce their risks. The more prepared communities are for destructive weather, the less of a human and economic toll we’ll experience in the future, and that’s a great thing for the country.”
The discussion resulted in a list of necessities to make a Weather-ready nation. They include improved precision of weather and water forecasts and effective communication of risk to local authorities; improved weather decision support services with new initiatives such as the development of mobile-ready emergency response specialist teams; strengthening joint partnerships to enhance community preparedness; and working with weather enterprise partners and the emergency management community to enhance safety and economic output and effectively manage environmental resources.
John Malay, president of the AMS, took part in the announcement and emphasized that the partnership among the three weather sectors—all represented in the AMS membership—is essential in achieving the vision. “We share the mission of informing and protecting our citizens, which is what this enterprise and initiative are all about,” he comments. “Given the resources to grow our scientific understanding of our complex environment through observations and research and to apply this knowledge in serving society, we can do amazing things together.”
You can download a pdf copy of the NWS Strategic Plan for this initiative from the Weather-ready nation website.

AMS DataStreme Teachers Brown Bag it at NOAA

The AMS Education Program has been actively training teachers in the atmospheric, oceanic, and climatological sciences for 20 years. Over 16,000 teachers have taken part in its professional development program, DataStreme. In June, some of DataStreme-trained teachers attended a NOAA brown-bag seminar, where their presentations were seen by NOAA education officials.
The teachers—who hailed from Pennsylvania, New Jersey, and Delaware—are representatives from an AMS DataStreme Local Implementation Team (LIT). The LIT teams are run by a master teacher and local scientist. The setup provides training for teachers in a specific scientific field as well as helping them strategize ways to bring scientific information into the classroom. LIT team leader and DOE Albert Einstein Distinguished Educator Fellow John Moore was so inspired by the teachers’ hard work and creative applications of Earth Science to their classrooms that he orchestrated the brown-bag meeting to facilitate dialog between the NOAA funders and the end-result teachers.
The teachers described the positive impact of bringing real-world NOAA and NASA data into the classroom, using skills from AMS DataStreme courses. They shared how strategies developed in DataStreme Atmosphere, Ocean, and Earth’s Climate System programs could be creatively implemented in the classroom, such as introducing a climate-science section by reading a novel with a general environmental theme, or comparing “textbook” atmospheric data with real data provided by NOAA and NASA. Teachers lauded DataStreme for providing the relevance needed to keep their students excited about science and help develop them into better decision makers. Others thanked NOAA and NASA for the opportunity to bring free, real-world data into the classroom.
In addition to the live audience, the presentations were also Web cast to NOAA offices across the country. The Archived PowerPoint slides from their presentations can be accessed at http://www.lib.noaa.gov/about/news/brownbagseminars.html.

NOAA: 'Unmistakable' Global Warming Continues

NOAA released the 2010 edition of its annual State of the Climate report this week revealing that Earth’s atmospheric and oceanic temperatures are rising unabated. The 218-page report, consisting of the peer-reviewed conclusions of more than 350 researchers in 45 nations, will be distributed with the June issue of the Bulletin of the AMS.
A press briefing summarizing the report’s findings noted a “consistent and unmistakable signal from the top of the atmosphere to the bottom of the oceans” that the world continues to warm.
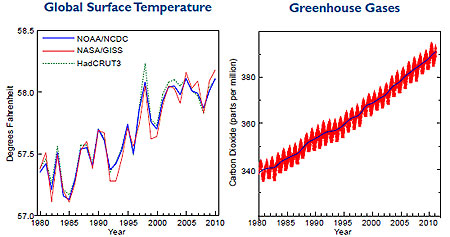
Those signals include last year’s global surface temperatures virtually tying 2005 as the warmest in the reliable global record, which dates to 1980. The Arctic warmed about twice as fast as the rest of the world, reducing sea ice extent to its third lowest level on record.

Rising temperatures, greenhouse gas CO2.
Rising global surface temperatures (left panel), and CO2 concentration levels (right panel, from Mauna Loa observatory). NOAA and NASA temperatures in 2010 are virtually tied with 2005 for warmest year on record. The UK Hadley Center Research Unit's data shows 2010 second to 1998 for warmest year.

The area of Arctic sea ice was so small in September that for the first time in modern history both the Northwest Passage through northern Canada’s usually ice-bound islands as well as the Northern Sea Route along Russia’s northern coast were open for navigation.
Average sea surface temperatures (SSTs) worldwide were third warmest on record in 2010. This was despite a nearly 2°F SST drop since 2009 as major El Niño warming of the tropical Eastern Pacific during the first half of 2010 rapidly transitioned to a major La Niña cooling event.
Greenland’s ice sheet lost more mass in 2010 than in any year during the last decade. The melt rate was nearly 10 percent more than the previous record year for loss, 2007. Mountain glaciers globally lost mass for the 20th straight year.
Greenland's ice sheet continues to lose mass, and it lost more in 2010 than during any year on record.

Additionally, global ocean heat content last year was among the warmest on record, following the trend of 2009. Warmer oceans combined with glacial melting to increase average sea levels around the world.
Climate indicators tracked in the State of the Climate during 2010 also included precipitation, greenhouse gases, humidity, cloud cover and type, temperature and saltiness of the ocean, and snow cover.
The report indicated that the concentration of carbon dioxide continued to rise in 2010, surpassing 390 parts per million (ppm) for the first time. In 1979, the CO2 concentration reached 340 ppm.
The 2010 Climate Report also notes that the oceans were found to be saltier than usual in some areas, due to increased evaporation of the sea surface, and less salty, or “fresher,” than average where precipitation was more than is typical. Researchers conclude in the report that this is a sign that Earth’s water cycle is intensifying, which will lead to heavier rainfall and snow events worldwide.
Such events reached extremes in 2010, assisted in part by the transition to La Niña as well as an extraordinarily abnormal pressure anomaly in the northern Atlantic Ocean referred to as the North Atlantic Oscillation (NAO). Helping to create a blocking weather pattern over Greenland, and generating huge undulations in the jet stream, the NAO in early 2010 resulted in a lopsided winter in North America with warmer- and drier-than-usual weather in much of Canada and frigid and snowy weather in the Eastern third of the United States), and the coldest winter in more than 30 years in the United Kingdom.
While this blocking pattern eased its extreme grip across North America and Western Europe into summer, continued amplification of ridges and troughs downstream across Asia contributed to a searing summer heatwave in Russia and epic flooding in Pakistan. More than two months of above-average temperatures, including all-time record heat in Moscow, resulted in at least 14,000 heat-related deaths as well as choking wildfires. At the same time, extreme monsoon rains inundated a fifth of Pakistan, displacing more than 20 million people in normally fertile flood plains.
The year 2010 ended with unprecedented flooding across eastern Australia. The lingering La Niña pattern coupled with the enhancement in the water cycle led to the region’s wettest spring (September–November) since record keeping began 111 years ago. December precipitation in the state of Queensland was more than double the average amount, which led to massive flooding where entire geographical regions of the nation—not just cities and towns—were under water.
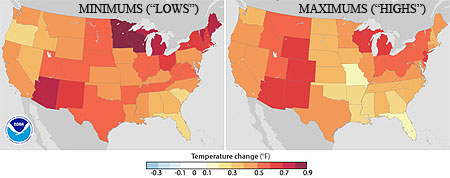
The overall consensus, especially when considering the dire predictions of an increasingly warmer world, is that the events and records of 2010 are the new normal on planet Earth. In one way, NOAA is confirming this today, releasing its new “climate normals” for temperature and precipitation for the United States, which serve to put into perspective current extremes based on the changing climate of the most-recent 30 years of data. The new climate “normals” valid for the period 1981-2010 have increased in temperature just as the State of the Climate has observed. Comparing the new temperature normals to those of the past decade—the period 1971-2000—shows they’ve increased by 0.5°F in that 10-year period over the United States.
“The [global] climate of the 2000s is about 1.5°F warmer than the 1970s, so we would expect the updated 30-year normals to be warmer,” NOAA National Climatic Data Center Director Thomas R. Karl says with regard to the new report.
New "normal" temperature comparison
Statewide changes in annual "normal" temperatures (1981-2010 compared to 1971-2000). Every state's annual maximum and minimum temperature increased on average.

Inside the AMS Annual Report

This past year was a busy one at AMS.  Along with the usual activities, there were a slew of events and new projects in the works.  While BAMS, the Web site, and The Front Page communicate what is happening within the Society, there is another not-so-obvious resource to find out what’s going on: the AMS Annual Report.  For instance, did you know:
The total number of AMS members at the end of the year was 13,963, and the number of full members increased for the fifth year in a row.
The Policy Program developed a disaster risk reduction alliance with the Aerospace Medical Association, the leading professional society of military medical doctors in the U.S. and overseas, on the topics of climate and weather-scale impacts to human health.
5,366 people attended AMS conferences and symposia, compared to 4,235 the previous year, and a total of 4,233 papers were presented.
The conversion to a new Manuscript Tracking System significantly increased production capabilities in the Publications Department.
The fellowship and scholarship program celebrated its 20th year, which, since its inception, has awarded nearly $8.4 million to more than 900 students.
118 broadcast meteorologists earned the CBM Certificate, bringing the total number of active CBMs to 470.
The AMS book Eloquent Science and Weather on the Air received “Highly Recommended” ratings from CHOICE, a journal of current reviews for academic libraries published by the Association of Library and Research Libraries.
The entire 2010 Annual Report is available on the AMS website.

Emergency Response Technology Goes On Demand

When the American Red Cross responded the morning after the 24 May tornado outbreak in central Oklahoma, they had a new tool in their pocket. The Warning Decision Support System—Integrated Information (WDSS-II), developed by NOAA’s National Severe Storm Lab, cut disaster assessment time from 72 hours down to 24, a major improvement that could save many lives when it comes to rescue in the wake of a disaster.
The WDSS-II works by narrowing when and where the severe weather most likely occurred. Using radars, satellites, and other observation systems, the On Demand feature of the tool records tracks of rotation and hail swath images that can be opened in Google Earth. When street maps are overlaid with these images, disaster teams can assess which areas likely need assistance first, as well as the most accessible routes to take.
“They no longer have to put boots on the ground to visually assess the situation before planning how they will deploy response teams,” comments Kurt Hondl, NSSL research meteorologist. “It makes the coordination and planning of the American Red Cross’s response so much more efficient.”
The WDSS-II On Demand software is available to American Red Cross officers and other assessment organizations. More than 250 volunteers in Oklahoma and Texas have been trained so far by the Red Cross to utilize the NSSL On Demand software.  Other organizations, like FEMA and the Department of Homeland Security, have begun to take advantage of the technology as well.