Record-high greenhouse gases, sea levels, monsoons, and droughts—and a volcanic vapor injection
By Michael Alexander, Lead, Atmosphere Ocean Processes and Predictability (AOPP) Division, NOAA, and BAMS Special Editor for Climate
The annual NOAA/AMS State of the Climate report has just been released, with a comprehensive global look at the climate in 2022. Produced by the NOAA National Centers for Environmental Information (NCEI) and the American Meteorological Society, the State of the Climate Report maps out the complex, interconnected climate phenomena affecting all parts of the globe. It also charts global progress in observing and understanding our climate system. 570 scientists from 60 countries contributed to this year’s report, including a rigorous peer review, making it a truly global endeavor.
As the senior editor on this project, I wanted to share with you a few highlights. Click here to read the full report, published as a supplement to the Bulletin of the American Meteorological Society.
New record-highs for atmospheric greenhouse gases CO2, methane, and nitrous oxide.
It was yet another record-setting year for atmospheric carbon dioxide and other greenhouse gases. 2022 saw an average concentration of 417.1 ± 0.1 ppm for atmospheric CO2; methane and nitrous oxide also reached record highs.
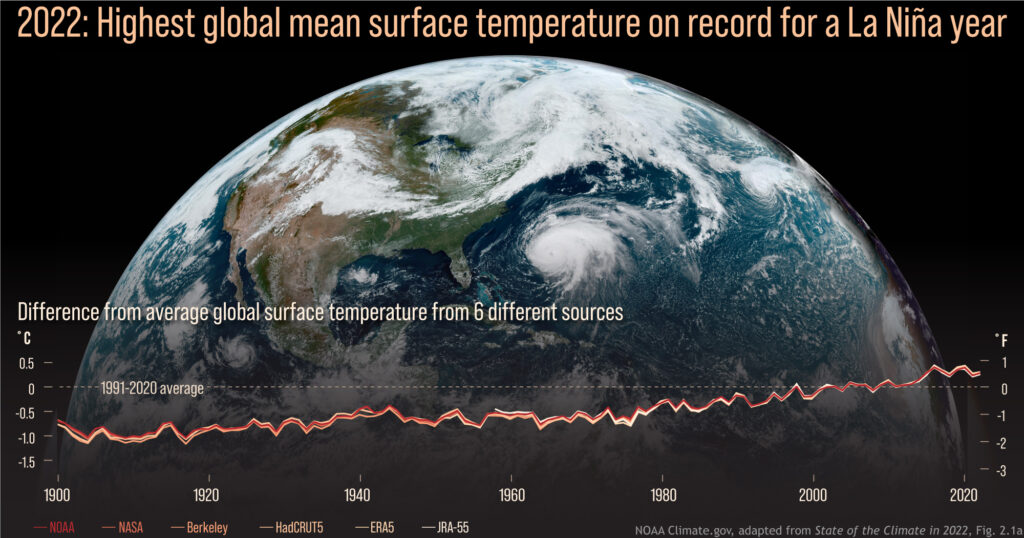
Warmest La Niña year on record.
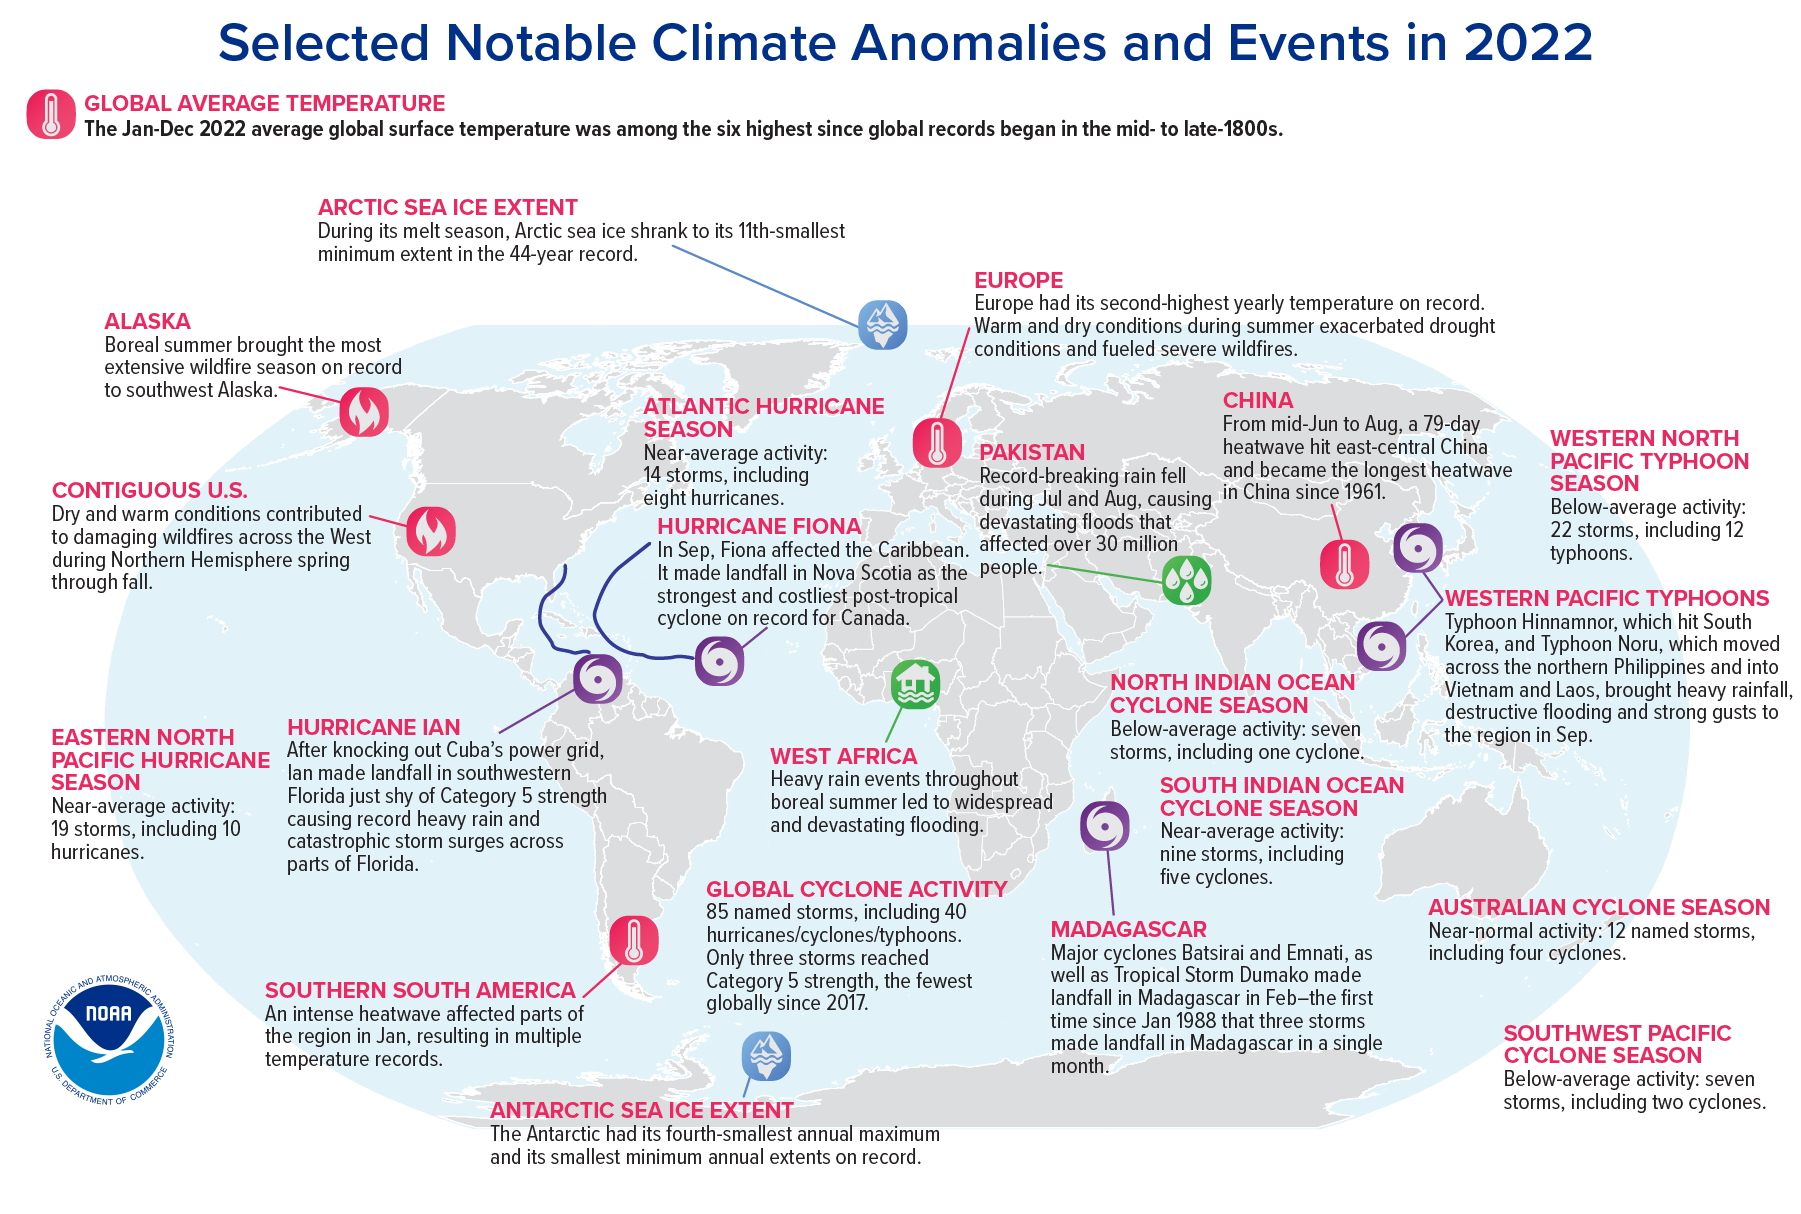
Despite being in the typically cooler La Niña phase of ENSO, 2022 was among the six warmest years on record, and was the warmest La Niña year ever recorded. Summer heat waves left annual temperatures at near-record highs in Europe, China, the Arctic, and Antarctica (parts of Europe set daily or seasonal heat records), and New Zealand experienced its warmest year ever. High-pressure “heat domes” helped elevate local temperatures in many areas, including parts of North America and Europe.
Record-high global mean sea level and ocean heat.
Global mean sea level reached 101.2mm above 1993 levels, setting a new record for the 11th year in a row. 2022 also saw record-high global ocean heat content (as measured to 2000 meters below the surface), although La Niña moderated sea-surface temperatures.
Complex climate picture.
Global warming trends continued apace, but of course numerous large-scale climate patterns complicated the picture. In 2022 we saw the first “triple-dip” La Niña event (third consecutive La Niña year) of the 21st century. The Indian Ocean Dipole had one of its strongest negative events since 1982, which led to increased temperatures and precipitation in the eastern Indian Ocean. Along with La Niña, this contributed to record-breaking monsoon rains in Pakistan that caused massive flooding and one of the world’s costliest natural disasters. We also had a positive-phase winter and summer North Atlantic Oscillation affecting weather in parts of the Northern Hemisphere.
A bad year for drought.
For the first time ever, in August 2022, 6.2% of the global land surface experienced extreme drought in the same month, and 29% of global land experienced at least moderate drought. Record-breaking droughts continued in equatorial East Africa and central Chile. Meanwhile, parts of Europe experienced one of their worst droughts in history, and China’s Yangtze River reached record-low levels.
Warmth and high precipitation at the poles.
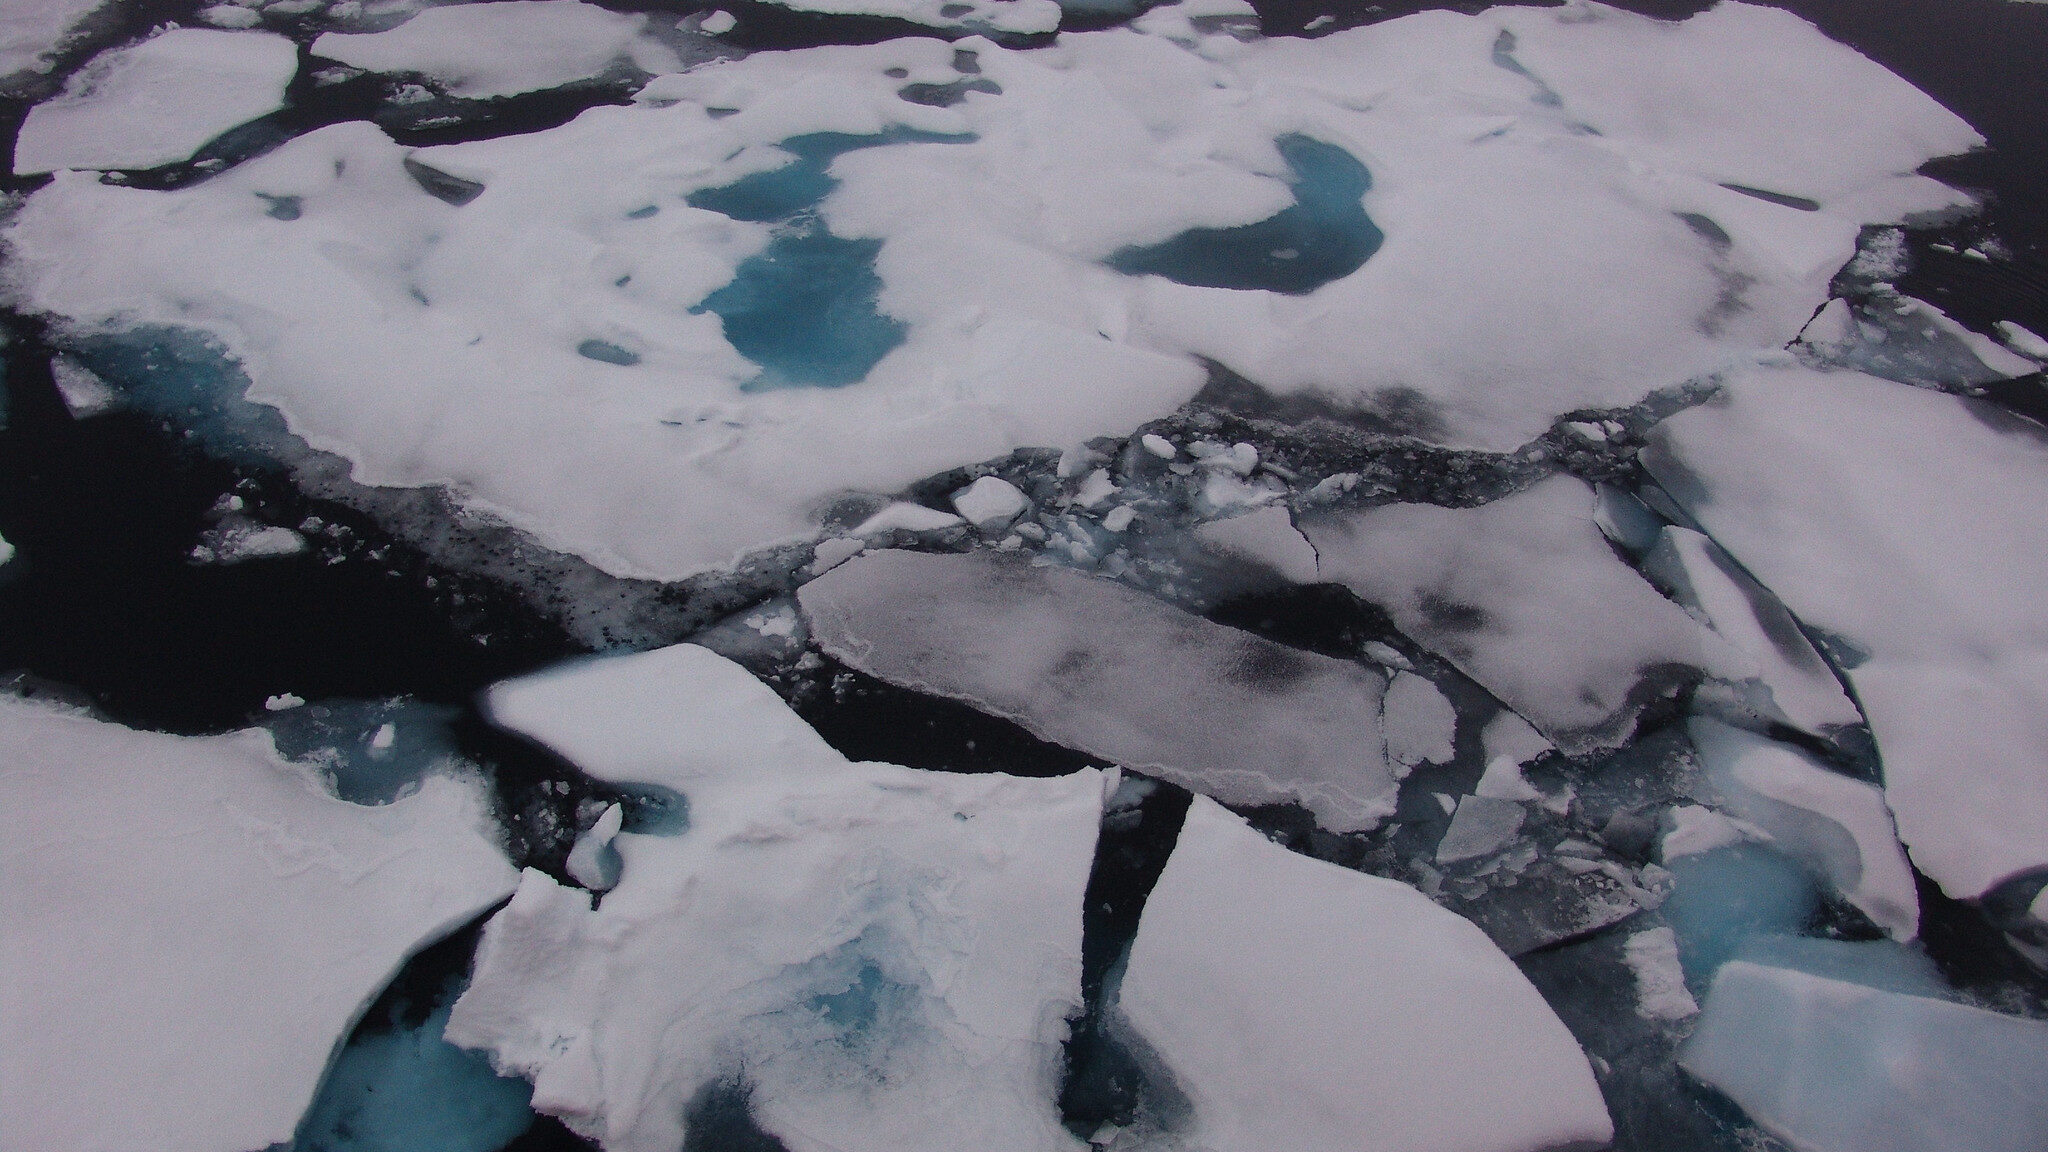
2022 was the firth-warmest year recorded for the Arctic, and precipitation was at its third-highest level since 1950. The trend toward loss of multi-year sea ice continued. Meanwhile, Antarctic weather stations recorded their second-warmest year ever, including a heatwave event that collapsed the Conger Ice Shelf, and two new all-time record lows in sea-ice extent and area set in February. On the other hand, record snow/icefall due to atmospheric rivers led to the continent’s highest recorded snow/ice accumulation since 1993.
Notable storms: Ian and Fiona.
85 named tropical cyclones were observed across all ocean basins, an approximately average number. Although there were only three Category 5 storms, and the lowest recorded global accumulated cyclone energy, the year produced Hurricane Ian, the third-costliest disaster in U.S. history, as well as Hurricane Fiona, Atlantic Canada’s most destructive cyclone.
Massive volcanic injection of atmospheric water vapor.
The Hunga Tonga-Hunga Ha’apai submarine volcano in the South Pacific injected a water plume into the atmosphere of unprecedented magnitude (146+/-5 Terragrams, about 10% of the stratosphere’s total water) and height (reaching into the mesosphere). We don’t yet know what, if any, long-term effects this will have on the global climate, although the increase in water vapor has interfered with some earth system observations.
The full report is a comprehensive and fascinating analysis of our climate system in the previous calendar year. I urge you to read it and communicate your own takeaways from the State of the Climate in 2022. You can read the press release here.
Infographic at top: World map showing locations of significant climate anomalies and events in 2022. Credit: NOAA.