Nowhere is it more dangerous to fly in a hurricane than right near the roiling surface of the ocean. These days, hurricane hunting aircraft wisely steer clear of this boundary layer, but as a result observations at the bottom of the atmosphere where we experience storms are scarce. Enter the one kind of plane that’s fearless about filling this observation gap: the drone.
NOAA’s hurricane hunter aircraft in recent storms has been experimenting with launching small unmanned aircraft systems (sUAS) into raging storms–and these devices show promise for informing advisories as well as improving numerical modeling.
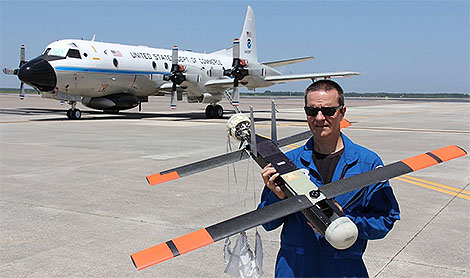
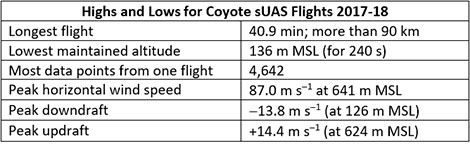
The observations were made by a new type of sUAS, described in a recently published paper in BAMS, called the Coyote that flew below 1 km in hurricanes. Sampling winds, temperature, and humidity in this so-called planetary boundary layer (PBL), the expendable Coyotes flew as low as 136 m in wind speeds as high as 87 m s-1 (196 mph) and for as long as 40 minutes before crashing (as intended) into the ocean.
In the BAMS article, Joe Cione at al. describe the value of and uses for the low-level hurricane observations:
Such high-resolution measurements of winds and thermodynamic properties in strong hurricanes are rare below 2-km altitude and can provide insight into processes that influence hurricane intensity and intensity change. For example, these observations—collected in real time—can be used to quantify air-sea fluxes of latent and sensible heat, and momentum, which have uncertain values but are a key to hurricane maximum intensity and intensification rate.
Coyote was first deployed successfully in Hurricane Edouard (2014) from NOAA’s WP-3 Orion hurricane hunter aircraft. Recent Coyote sUAS deployments in Hurricanes Maria (2017) and Michael (2018) include the first direct measurements of turbulence properties at low levels (below 150 m) in a hurricane eyewall. In some instances the data, relayed in near real-time, were noted in National Hurricane Center advisories.
Turbulence processes in the PBL are also important for hurricane structure and intensification. Data collected by the Coyote can be used to evaluate hurricane forecasting tools, such as NOAA’s Hurricane Weather Research and Forecasting (HWRF) system. sUAS platforms offer a unique opportunity to collect additional measurements within hurricanes that are needed to improve physical PBL parameterization.
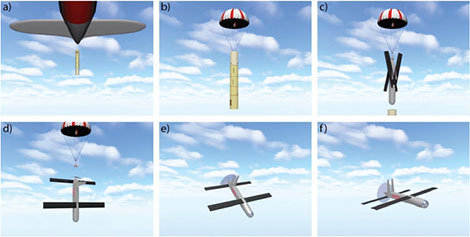
Images were captured from a video courtesy of Raytheon Corporation.
The authors write that during some flights instrument challenges occurred. For example:
thermodynamic data were unusable for roughly half of the missions. Because the aircraft are not recovered following each flight, the causes of these issues are unknown. New, improved instrument packages will include a multi-hole turbulence probe, improved thermodynamic and infrared sensors, and a laser or radar altimeter system to provide information on ocean waves and to more accurately measure the aircraft altitude.
Future uses of the sUAS could include targeting hurricane regions for observations where direct measurements are rare and models produce large uncertainty. Meanwhile, the article concludes, efforts are underway to increase sUAS payload capacity, battery life, and transmission range so that the NOAA P-3 need not loiter nearby.
 In recent years minimum sea level pressure (MSLP) measured in a hurricane’s eye has become “a much better predictor of hurricane damage” than the maximum sustained wind speed (Vmax) upon which the revered Saffir-Simpson hurricane wind scale is based.
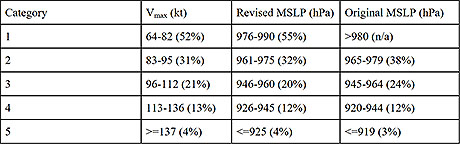
 What can we expect? It is nearly indisputable that there will be hurricanes. NOAA’s
  There isn’t a way to tell yet what this year’s hurricanes will be like. But it’s another year into our warming world, and this is yet another study pointing to ominous changes with hurricanes in our future.