Guest post by Haven Cashwell, PhD Student and Graduate Research Assistant at Auburn University
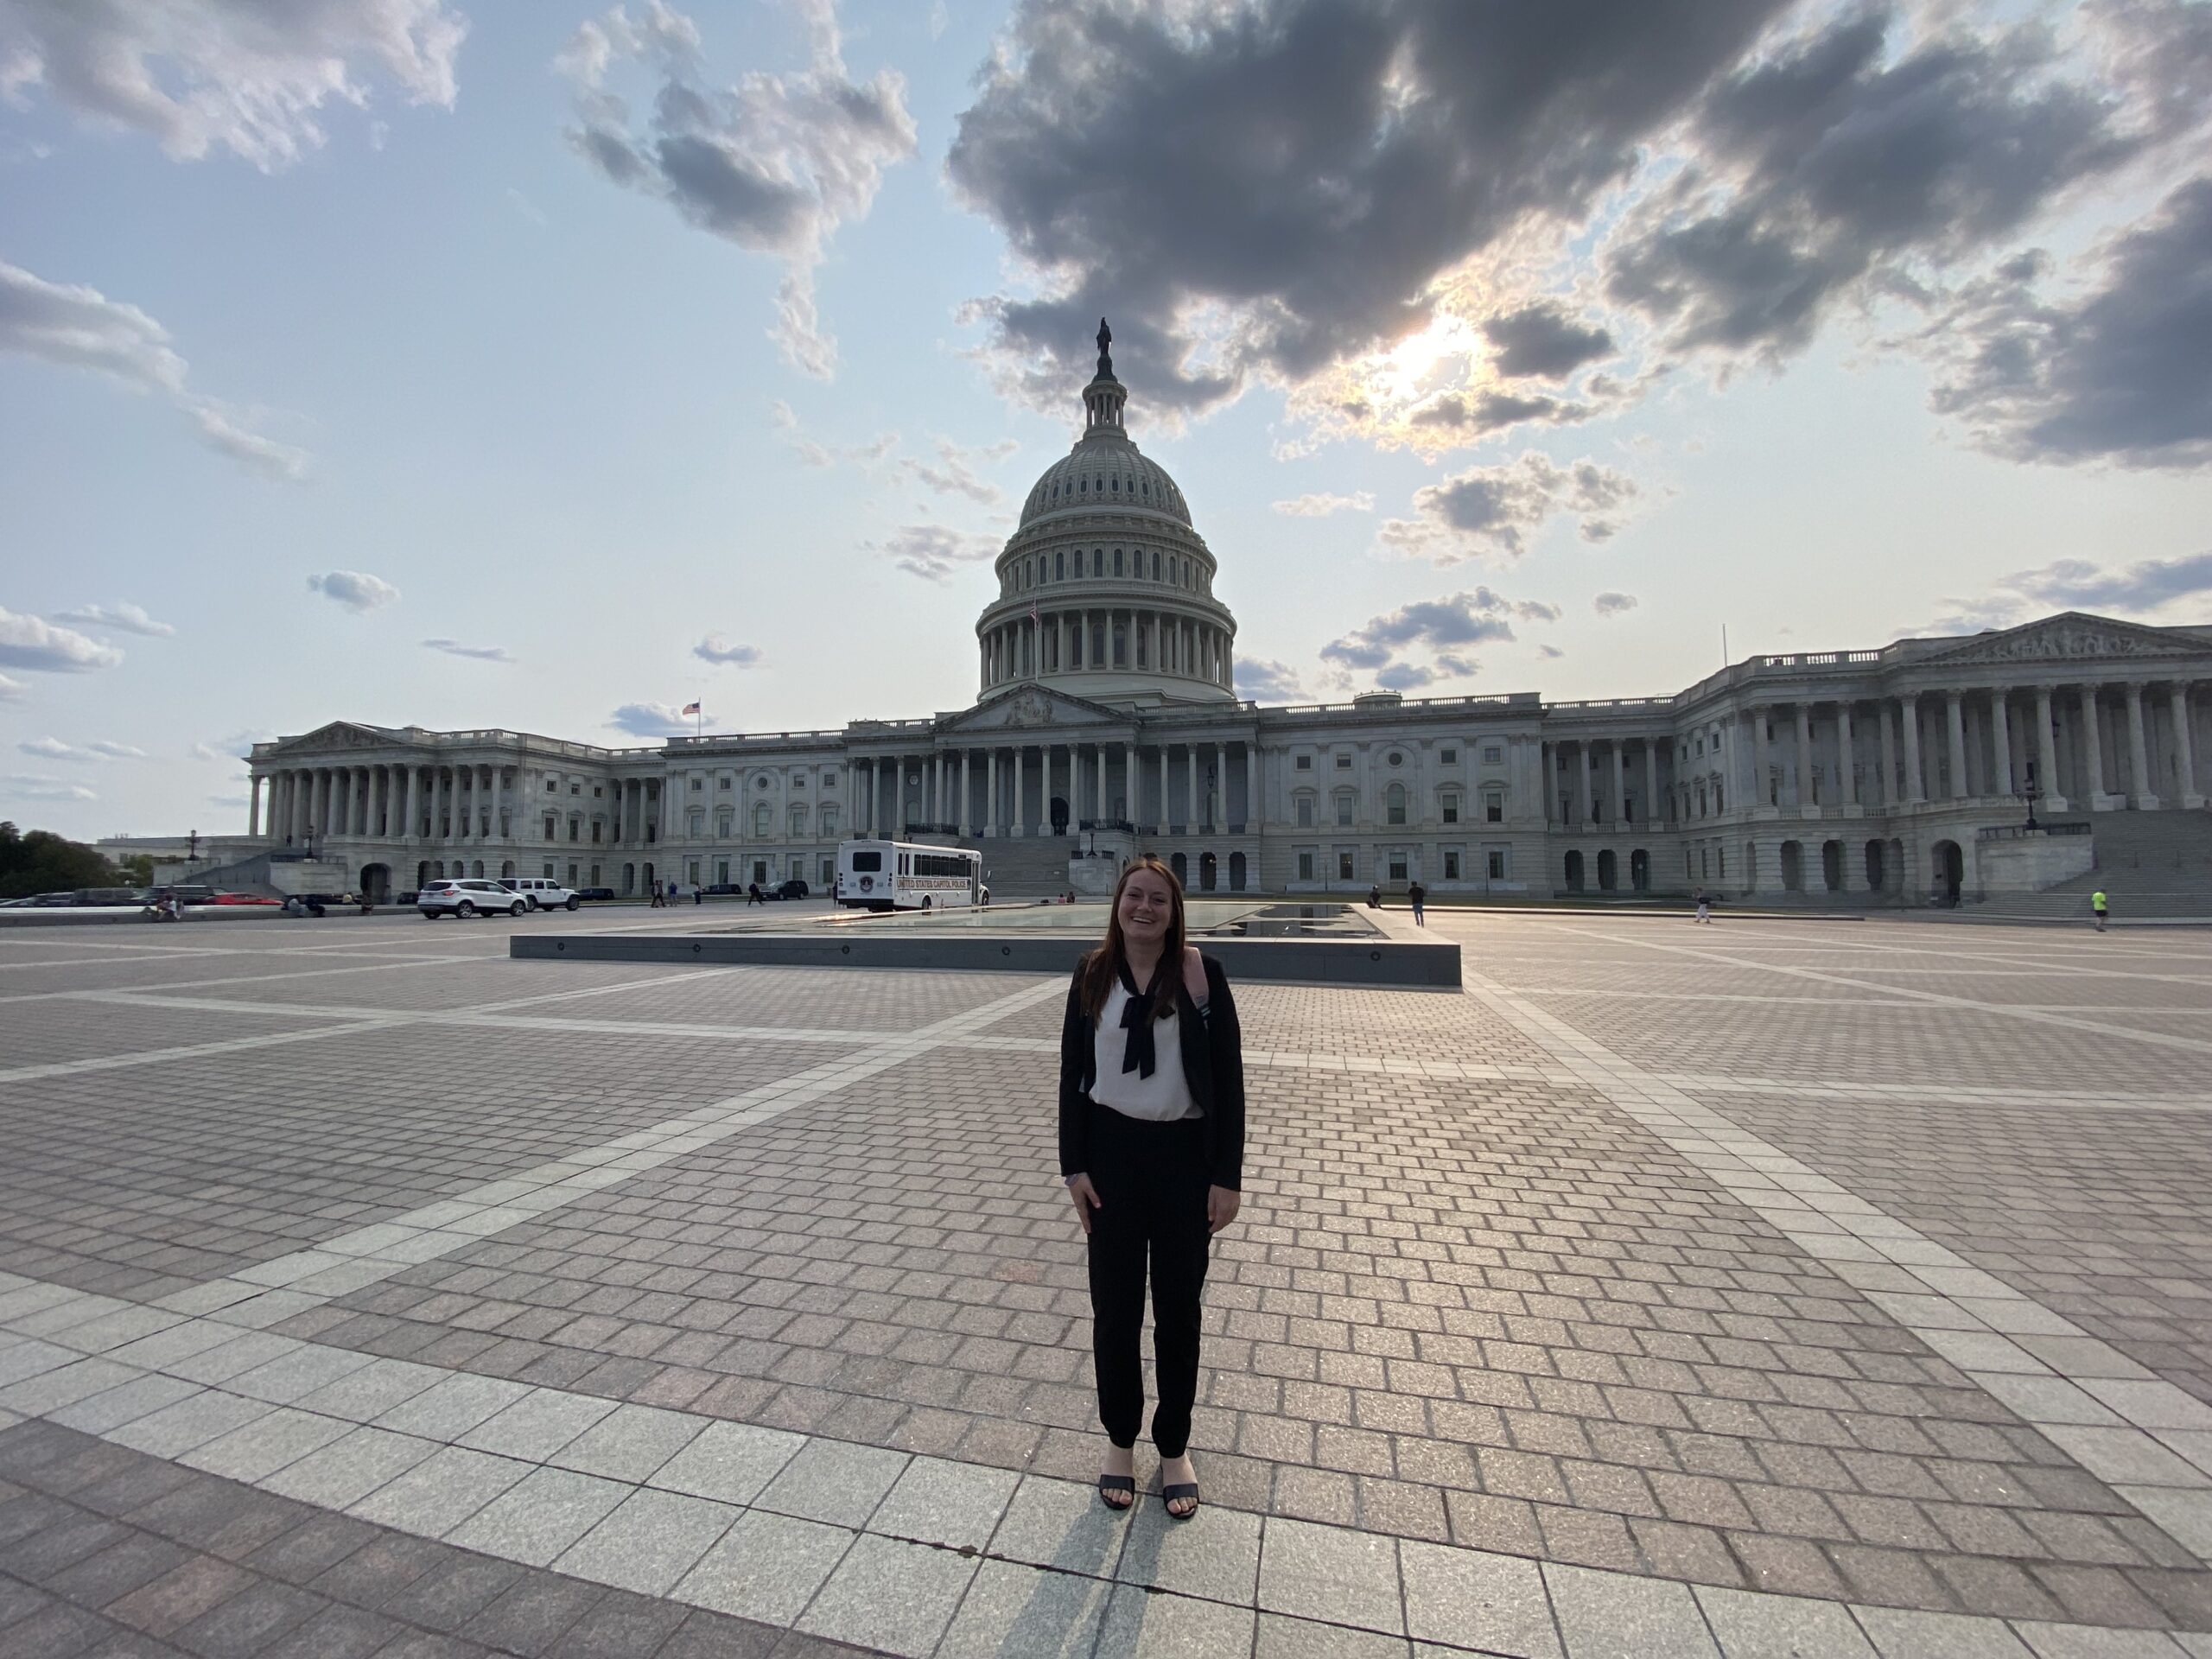
From my small hometown of Marshallberg in eastern North Carolina, and even my current home as a researcher and PhD student at Auburn University, the chambers of Congress have always felt like a different world. I had never even visited Washington, D.C., before, so truly I did not know what the policy world looked like. The recent AMS Summer Policy Colloquium opened these doors to me and showed that the pathway between research and policy isn’t as distant as I once thought.
The integration of science and policy has always intrigued me—such as policy for coastal resiliency, since my hometown of Marshallberg, NC is being impacted by climatic changes—but I was not aware of how that process worked. As I finish my PhD, I’m also exploring possible career paths that I could take after graduating. One aspect of my current research involves assessing and communicating climate and health risk factors with frontline communities in the Carolinas, which has made connections with the policy process feel even more pressing.
My mentor for an internship this summer is Dr. Kathie Dello, North Carolina’s state climatologist, who previously attended the colloquium and encouraged me to participate as well. After a week at the Colloquium, I left with lots of new knowledge and a much greater appreciation of how the policymaking process works.
For instance, I learned about the concepts of science for policy and policy for science, and how to navigate the two. Given my background in science communication, the idea of translating scientific evidence and research results to be usable and actionable (science for policy) felt very familiar, but I gained a new understanding of how policy affects funding that goes to different agencies for scientific research (policy for science).
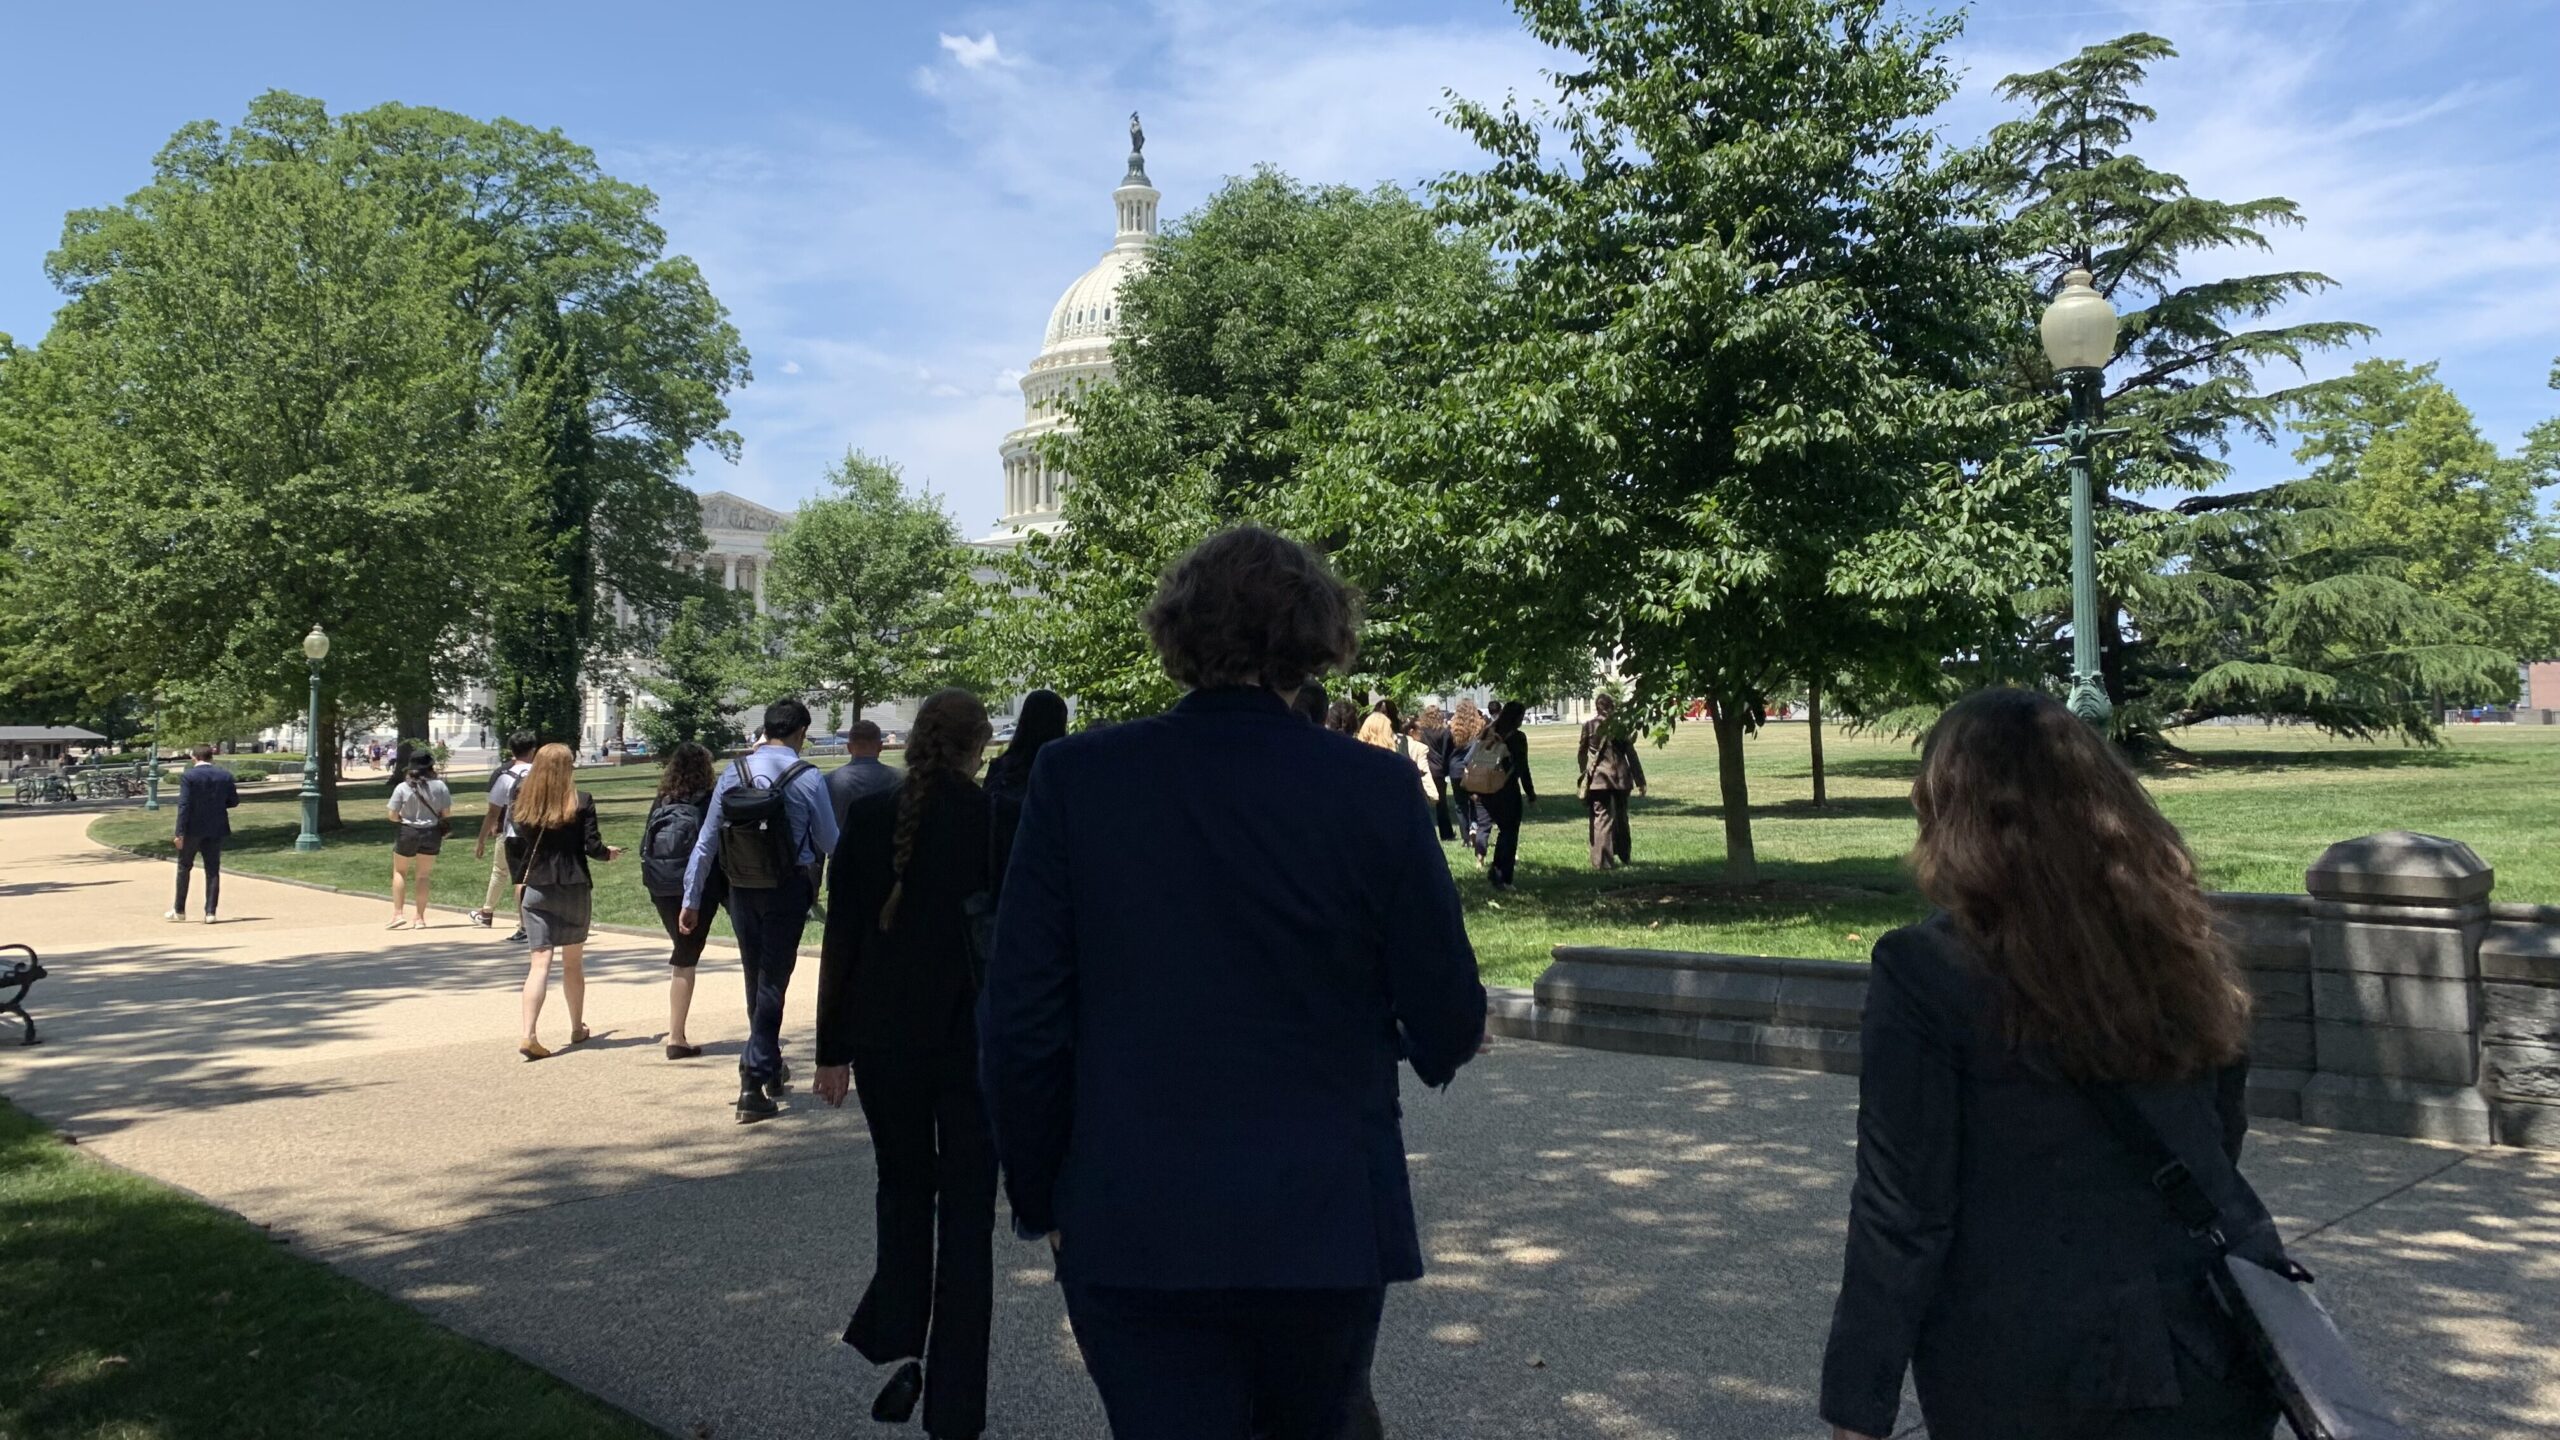
Together with several dozen fellow scientists, I heard from professionals working in the policy world. They represented careers ranging from those having to do with the federal budget process to congressional staffers working directly with members of congress on science initiatives. I had no idea the options were so broad and varied. And far from the common perception that policy has to be dull, these speakers had great passion for their own work and a clear enthusiasm for sharing that with my peers and me.
We put our knowledge into practice in a legislative exercise that was sprinkled throughout the week. Participants were separated into groups and assigned to play the role of a senator marking up certain legislation. The goal was to get an understanding of how politics, policy, and procedure interact in the legislative process by creating amendments to bills and working together to create a significant piece of legislation. Much enthusiasm was shared among the participants at the end of the week when “voting” for the legislation, as the hard work throughout the entire week was put into practice.
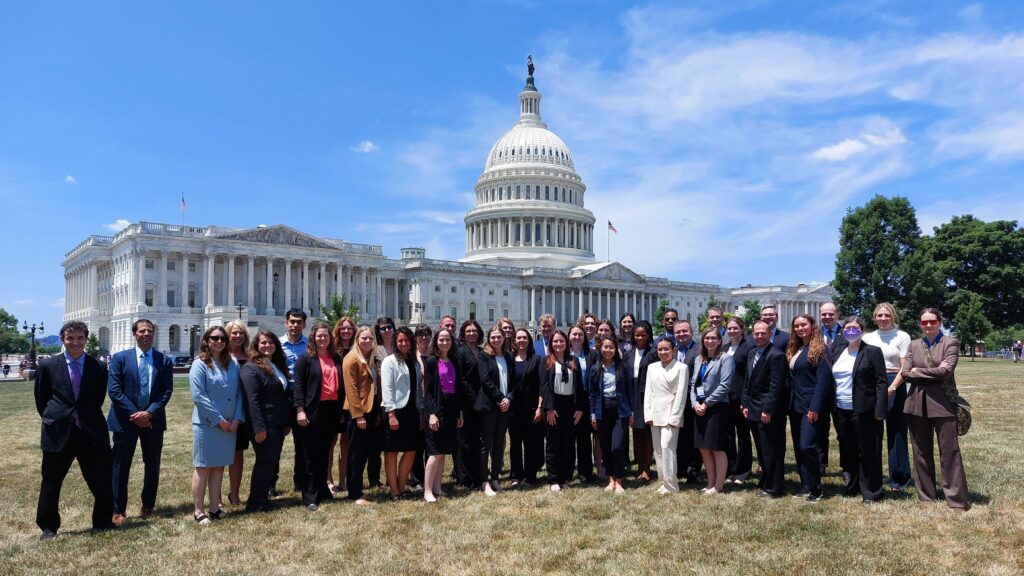
I left the Colloquium not only with a much better understanding of how science and policy can connect, but also with a new cohort with whom I networked throughout the week. Whether our careers keep us in the sciences or shift toward the world of policy, I’m excited for our paths to cross in the future and see how our experiences from this week in Washington shape our own work.
I would recommend attending the Summer Policy Colloquium to any young scientist who is interested in the policy process. By being better informed about how science and policy intersect, I’m now able to consider how my own research could fit in, whether it’s sharing how results from my research could influence policy or how to communicate and collaborate with policymakers in general.
Whether my future takes me back to small towns facing climate risks, leading research universities, or even a career in the policy sector, I know that the Summer Policy Colloquium has given me the tools and knowledge to be a more well-rounded researcher capable of connecting with the world of policy.
About the AMS Summer Policy Colloquium
The AMS Summer Policy Colloquium provides an overview of policy basics and decision-making in the earth and atmospheric sciences, along with opportunities to meet and dialogue with federal officials, Congressional staffers, and other decision-makers. Aimed at early and mid-level federal managers, scientists, private-sector executives, university faculty, and selected graduate students and fellows, the Colloquium helps participants build skills and contacts, gauge interest in science policy and program leadership, and explore selected issues in depth.