Takeaways from the AMS Summer Policy Colloquium
Guest post by Natasha Dacic, PhD Candidate at the University of Michigan
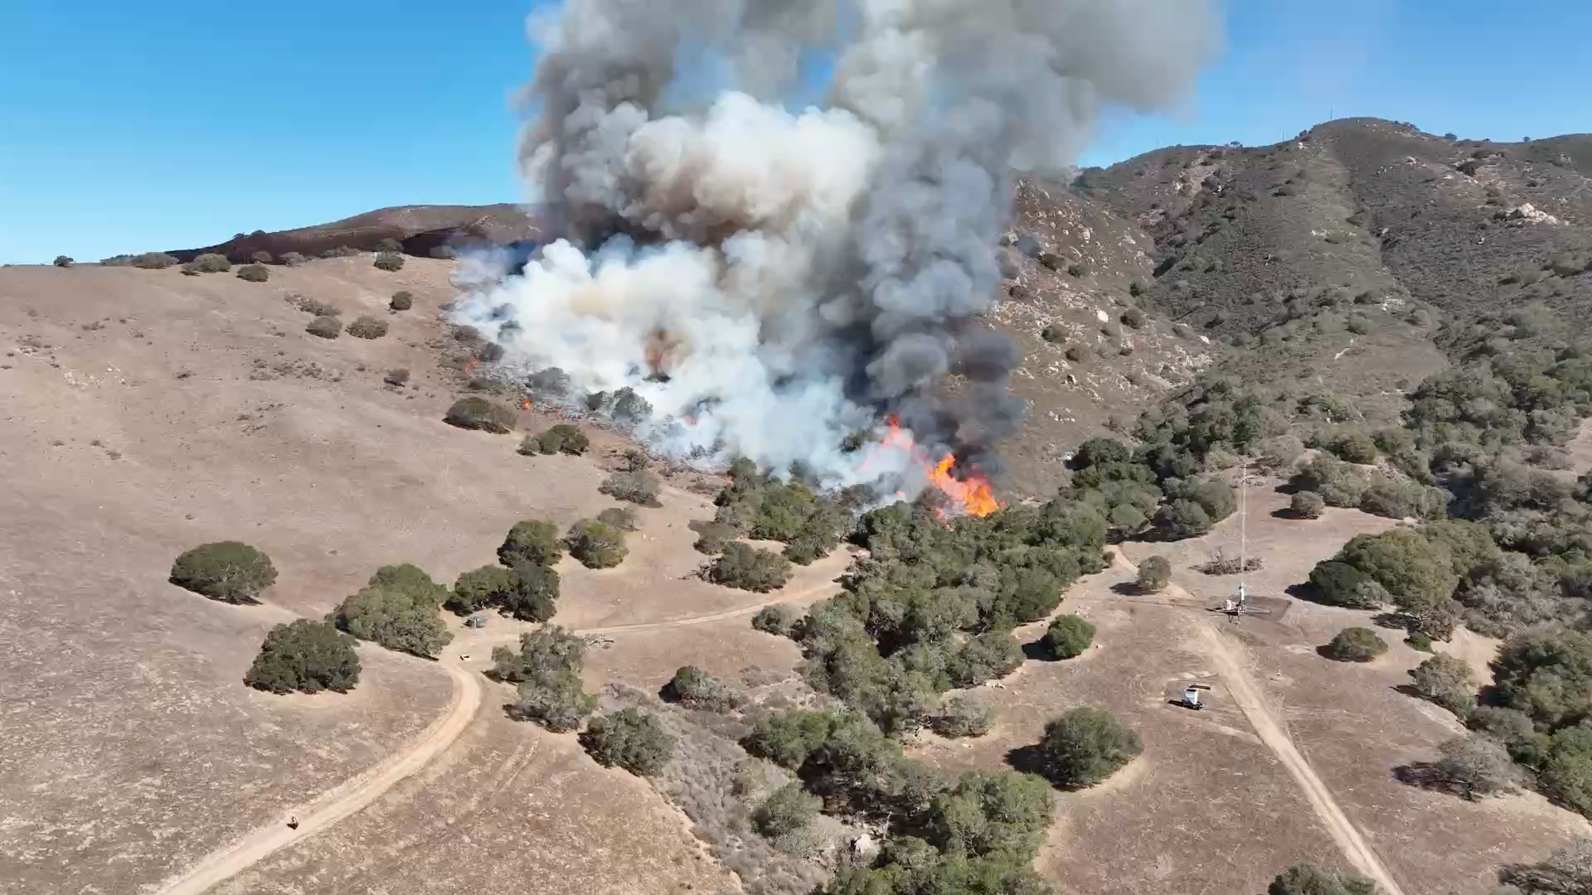
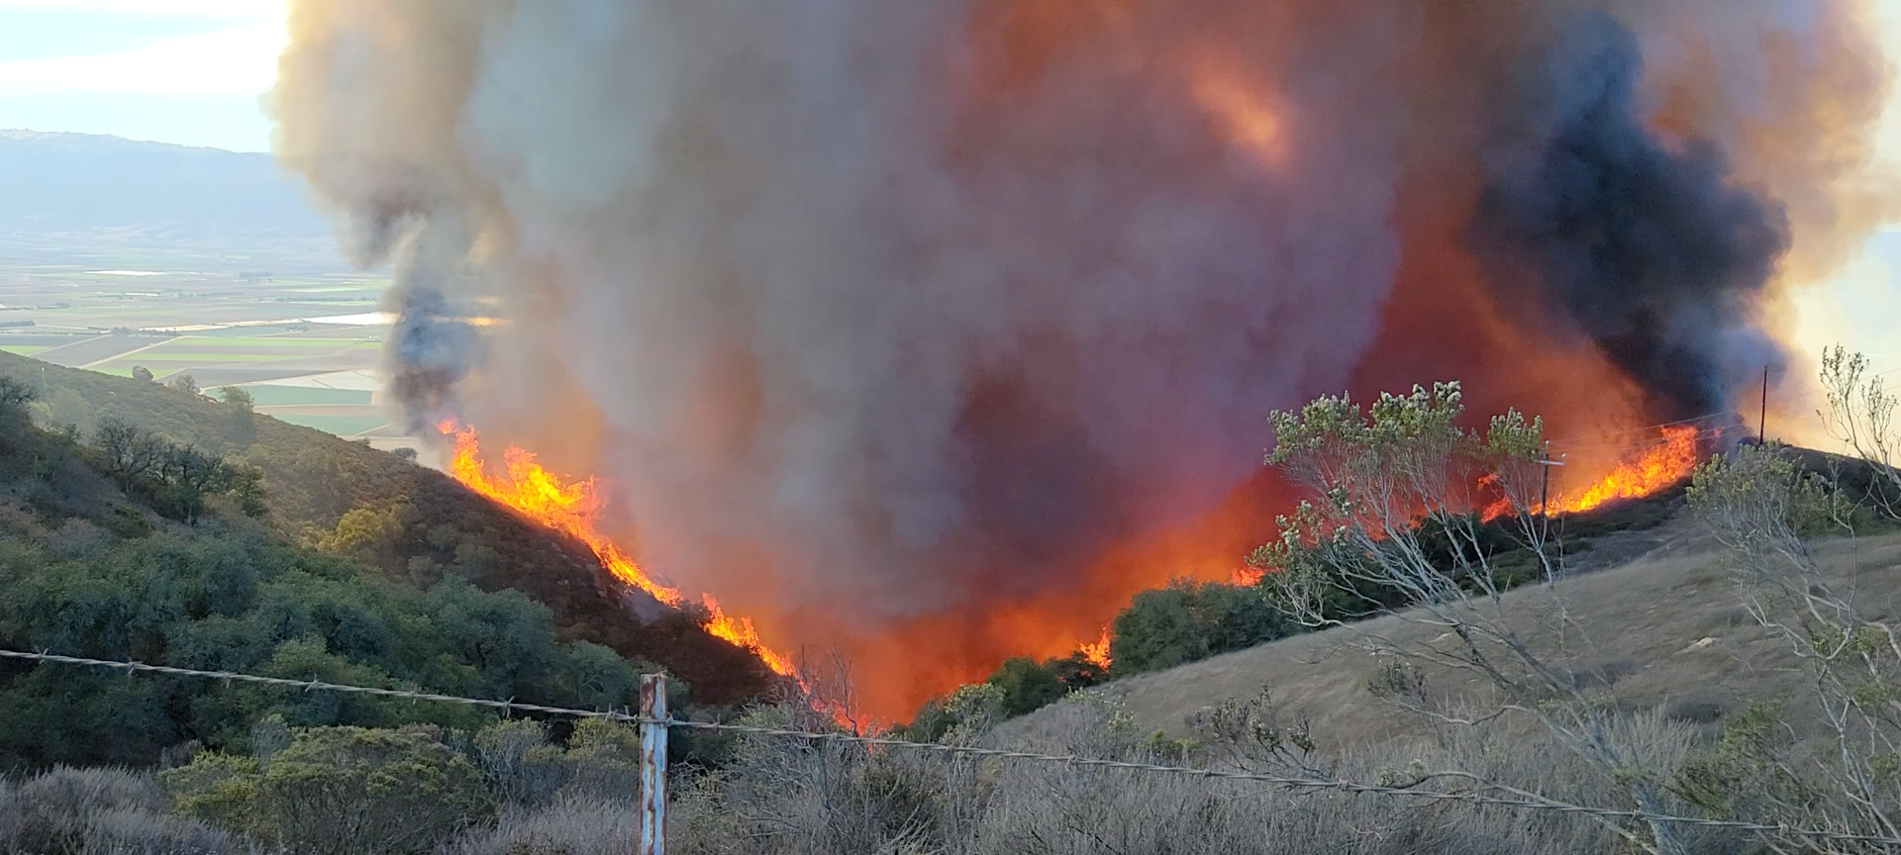
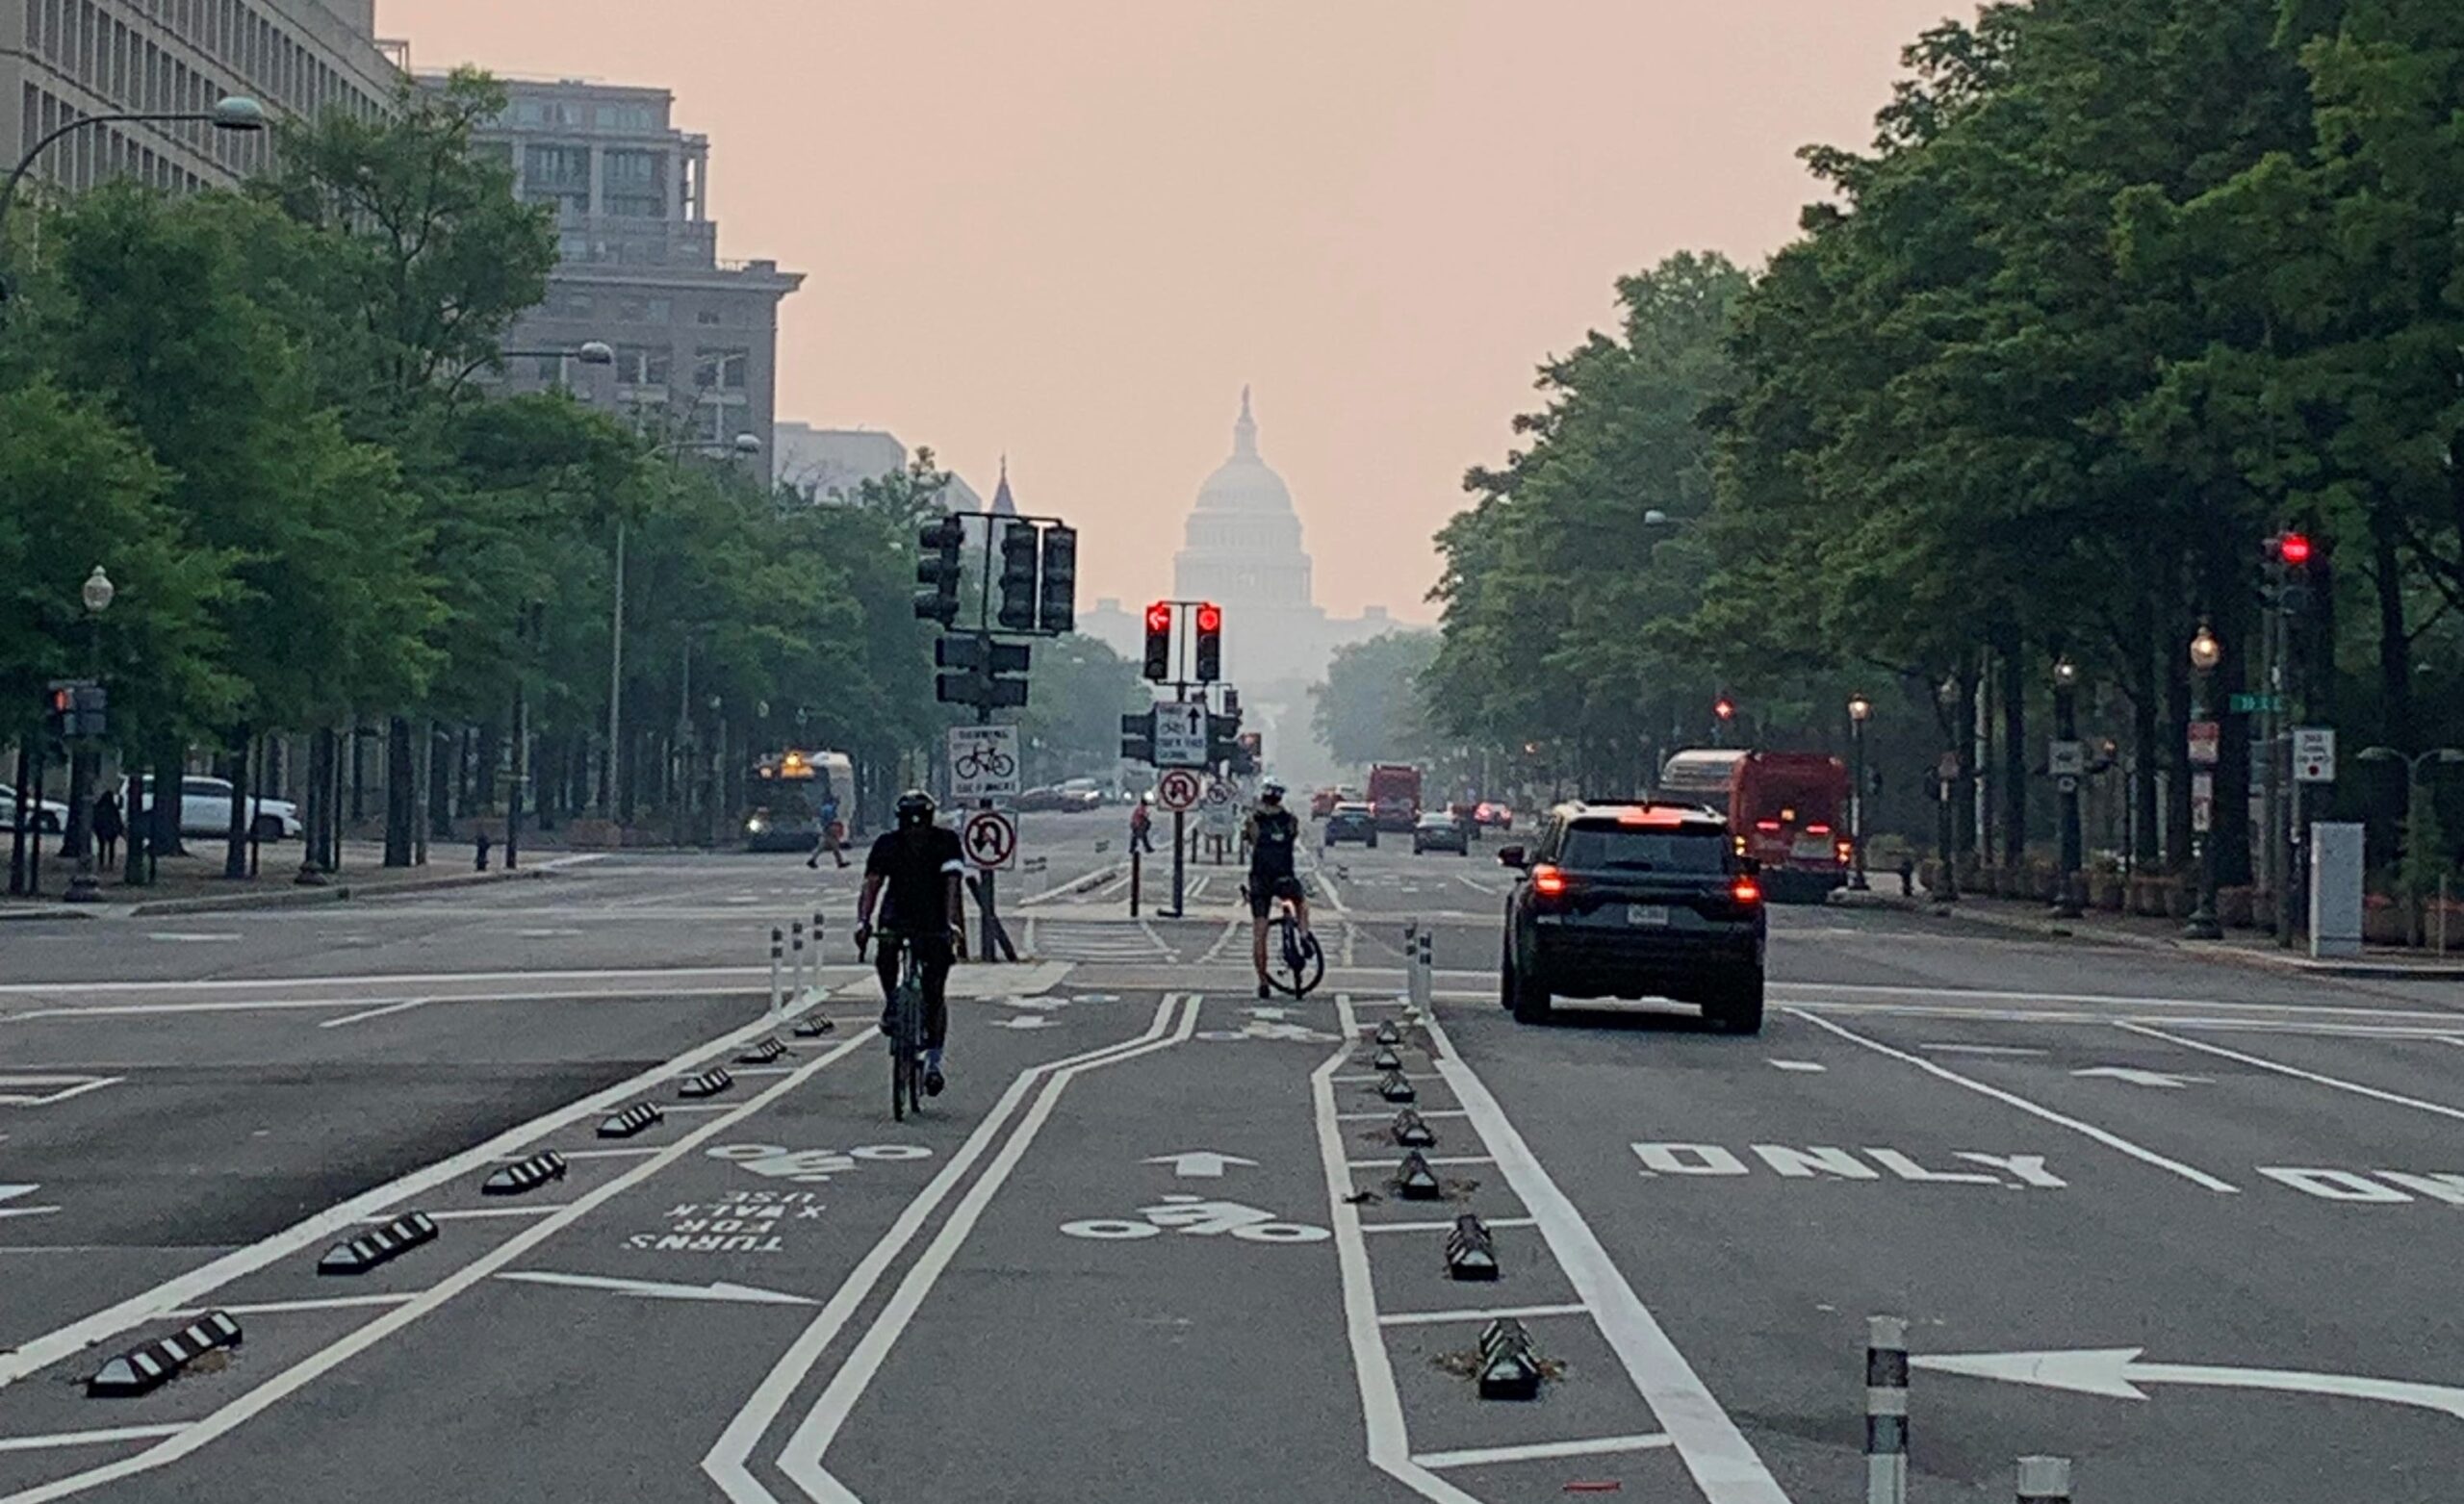
The western part of the United States continually suffers from wildfires and smoke every year, but in early June, regions of the Midwest and eastern parts of the country experienced unhealthy air quality as smoke from Canadian wildfires was transported into these regions. Cities like Washington, D.C., experienced some of the worst air quality levels in recent years. The smoke that engulfed the capital was a stark reminder that events like wildfires have far-reaching consequences.
I began to wonder if policymakers would be more attuned to the urgency for climate action now that the Nation’s Capital was experiencing some of the consequences that could become more prevalent in the near future. Coincidentally, I was in D.C. that week for the AMS Summer Policy Colloquium, and I had the opportunity to hear policymakers and federal officials comment on the wildfire smoke and how it pertains to the science policy they work on.
As a scientist passionate about the intersection of climate and policy, the Summer Policy Colloquium was an enlightening experience for me. It brought together federal officials and Congressional staffers from various disciplines to discuss their career journeys, responsibilities, and pressing environmental issues. Several science policy experts commented on air quality and the broader implications of wildfires, recognizing that these are not isolated incidents but rather a component of a larger system affected by climate change and human activities, and not limited to a single country or region. Wildfires, driven by extreme heat, droughts, and other climate-related factors, have become increasingly common and devastating worldwide.
In response to questions addressing the poor air quality, speakers emphasized the need for collaborative efforts between scientists, policymakers, and communities to tackle these complex challenges. The co-production of knowledge emerged as a theme throughout these discussions, and it quickly became evident that policymakers rely on expert knowledge and active participation of interested parties from various sectors in order to craft effective policy. This is one important way scientists can get involved.
As I listened to these conversations, I couldn’t help but reflect on my own work and the importance of co-production of knowledge in addressing environmental issues. I worked with a group of faculty and students in the Department of Climate and Space Sciences and Engineering at the University of Michigan to develop a pilot course to provide hands-on experience engaging with local communities. Many geoscience academic departments do not mandate this type of coursework–yet I believe that as scientists, it is essential for us to engage not only in research but also in the application of our knowledge. The Summer Policy Colloquium served as a reminder that we have a responsibility to communicate our findings to policymakers, advocate for evidence-based decision-making, and work hand in hand with communities affected by these environmental challenges.
The colloquium also highlighted the importance of academia and scientists being more active in applying their knowledge to real-world problems. While research and publication are important, they must be accompanied by active engagement with policymakers and communities to ensure that scientific findings translate into meaningful action. By actively participating in the policy-making process, scientists can contribute their expertise and help shape policies that address all aspects of science and more importantly, climate change.
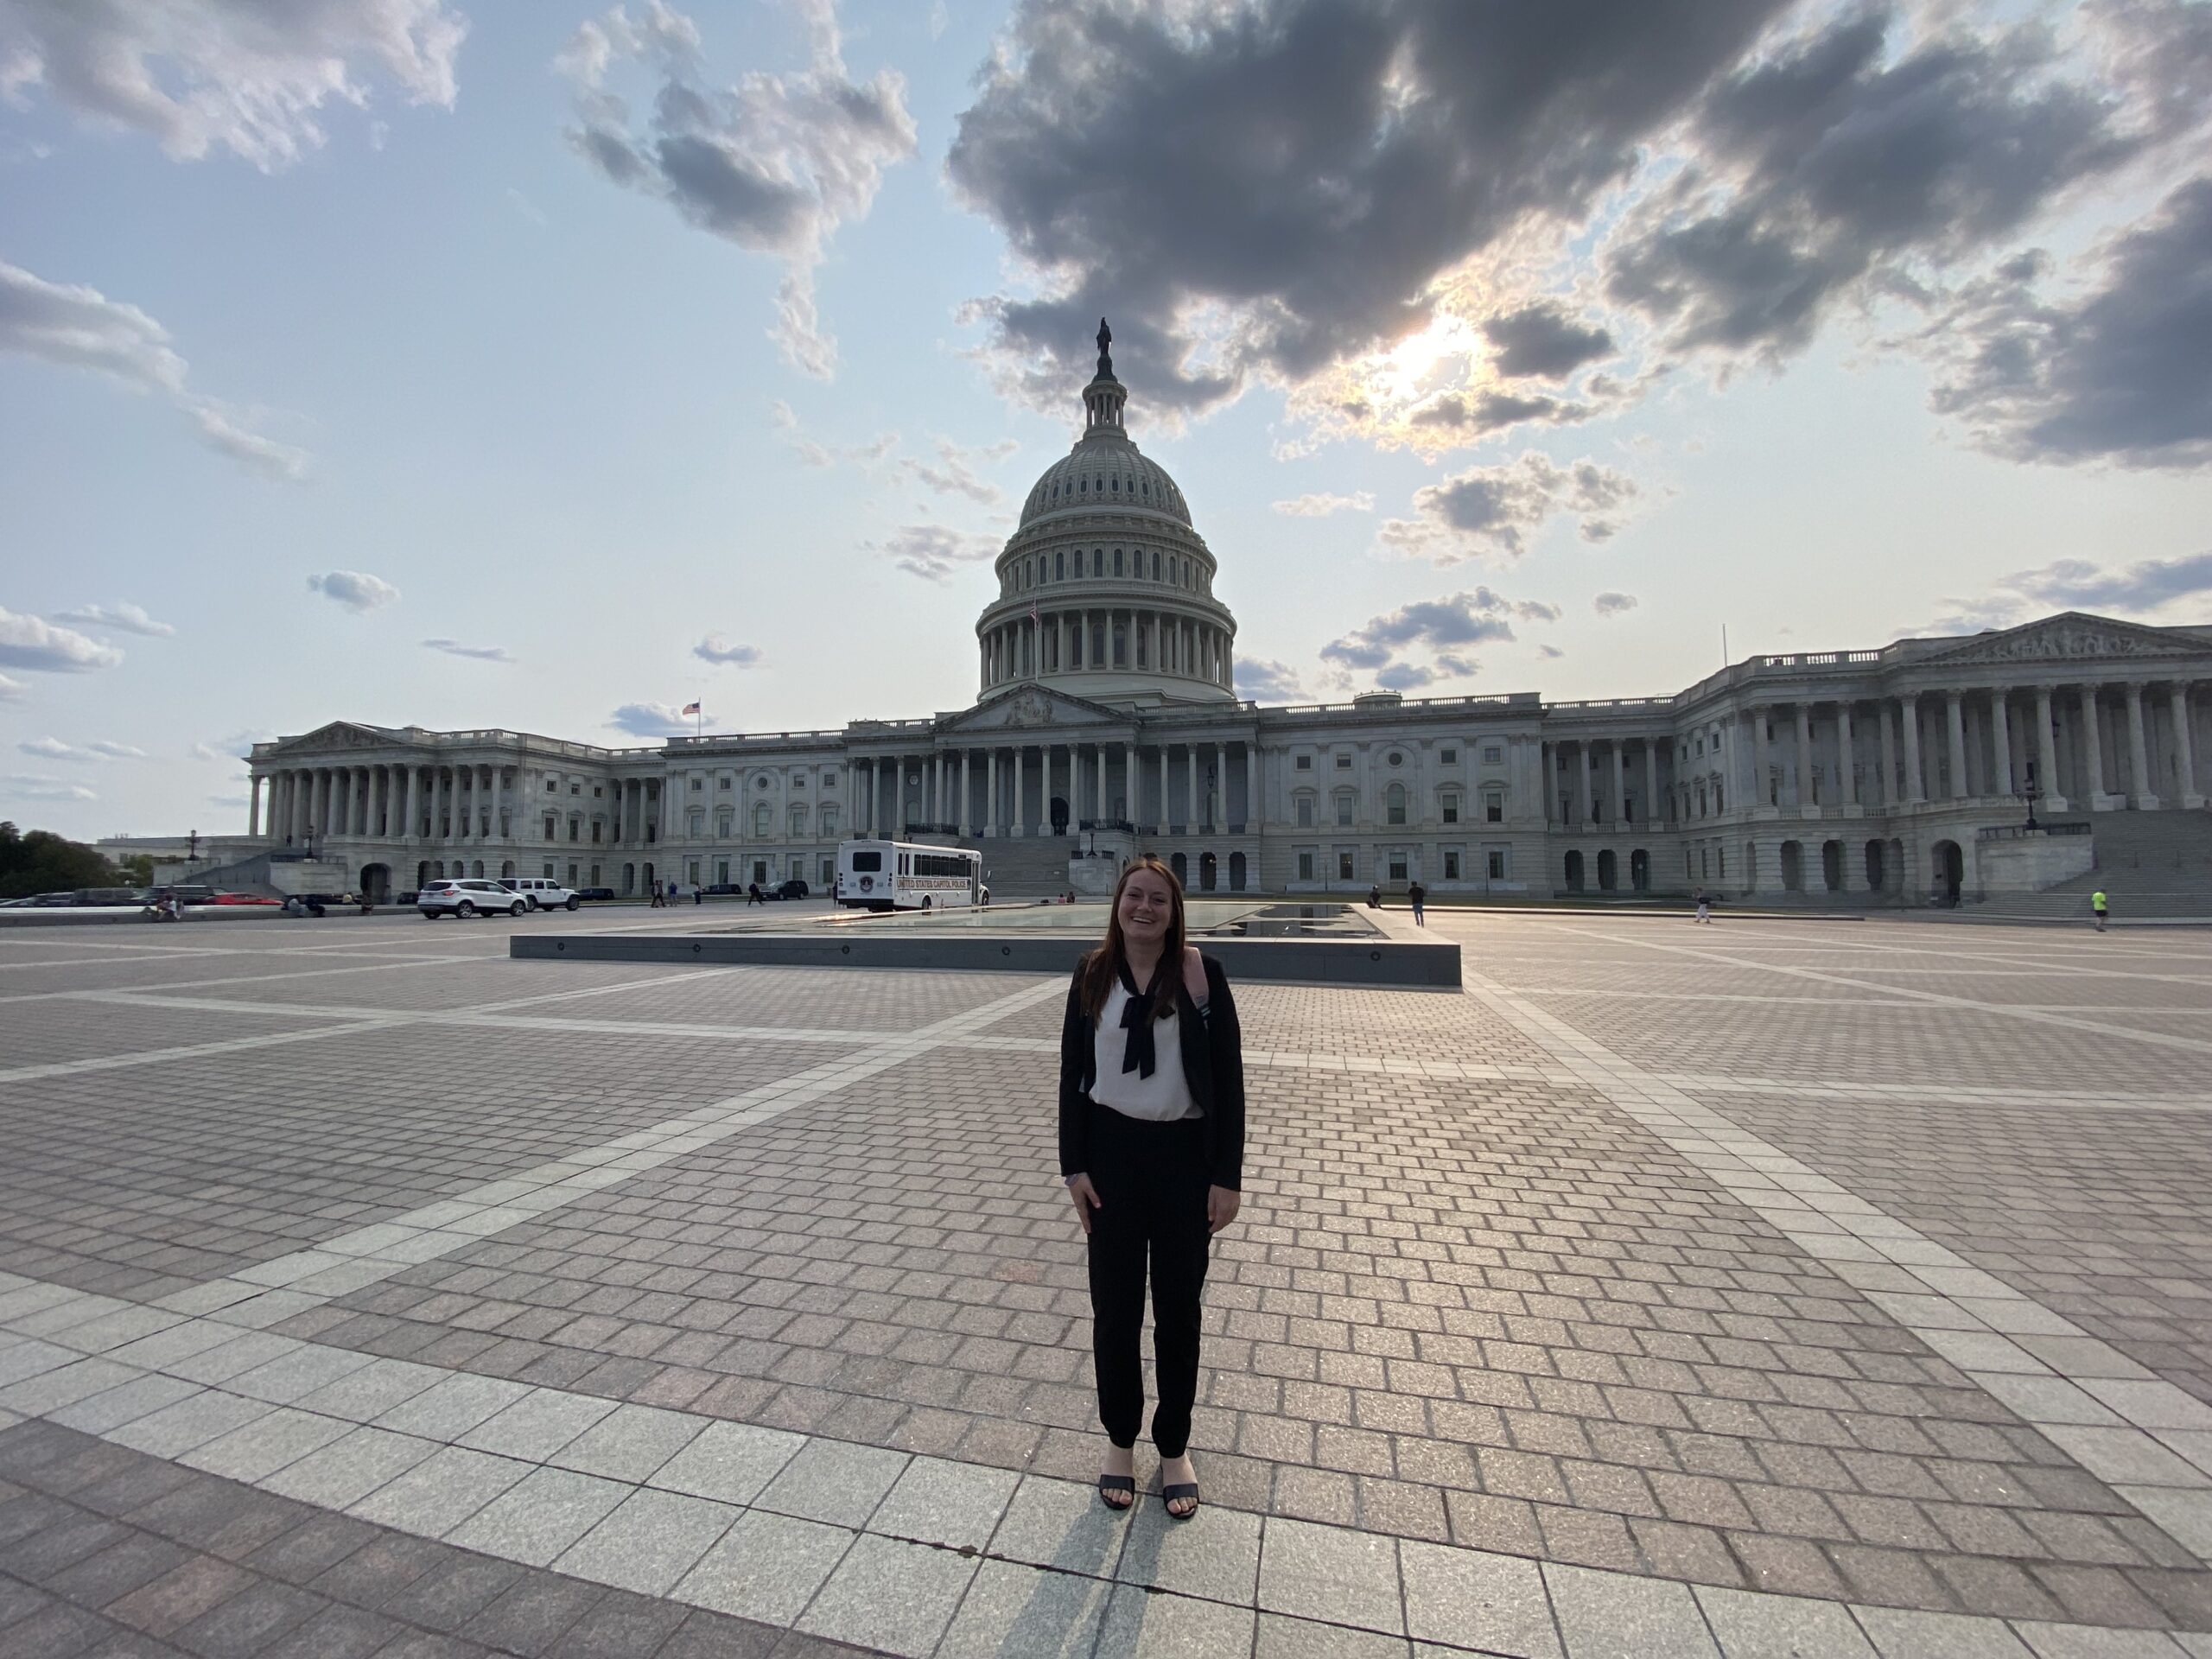
Photo at top: The U.S. Capitol building viewed from afar during the wildfire smoke event on June 7, 2023. Photo courtesy of Natasha Dacic.
About the AMS Summer Policy Colloquium
The AMS Summer Policy Colloquium provides an overview of policy basics and decision-making in the earth and atmospheric sciences, along with opportunities to meet and dialogue with federal officials, Congressional staffers, and other decision-makers. Aimed at early and mid-level federal managers, scientists, private-sector executives, university faculty, and selected graduate students and fellows, the Colloquium helps participants build skills and contacts, gauge interest in science policy and program leadership, and explore selected issues in depth. View the 2023 SPC agenda here [PDF].