2018’s devastating Hurricane Michael struck the Florida panhandle at Mexico Beach and Tyndall Air Force Base in October at Category 5 intensity with 160 mph winds, the National Hurricane Center announced Friday. That’s 5 mph higher than Michael’s wind estimate of 155 mph at the time of landfall.
In its post-storm tropical cyclone report, released the same day, NHC stated it culled an abundance of wind data measurements not available in real-time to add the 5 mph to Michael’s wind intensity. The data came from aircraft reconnaissance, ground observations, satellite intensity estimates, surface pressures, and Doppler radar velocities from Eglin Air Force Base and the NWS in Tallahassee. The report goes in-depth with the data, explaining the observations and identifying those that were believable—a 152 knot (175 mph) aircraft wind measurement at 8,000 feet in the southeast eyewall that yields a surface wind of 137 knots (158 mph)—versus those that were suspect—a 152 knot (175 mph) surface wind measured by the stepped frequency microwave radiometer (SFMR) instrument aboard a different aircraft, deemed too high based on experience with such intense winds in hurricanes Irma, Jose, and Maria in 2017.
The upgrade makes Michael only the fourth Category 5 hurricane to hit the United States, joining a small, elite group of monster landfalling storms that include Hurricane Andrew (1992, 165 mph winds), Hurricane Camille (1969, 175 mph winds), and the Labor Day Hurricane (1935, 185 mph winds). Andrew plowed into South Florida, Camille landed on the Mississippi coast, and the Labor Day Hurricane devastated the Florida Keys.
(Photo courtesy: Chris Cappella [AMS])
Hurricane Michael roared ashore on October 10 as the strongest hurricane on record to strike the Florida Panhandle, with a storm surge around 14 feet above ground level, destroying Mexico Beach and much of Tyndall AFB, while tearing apart homes and businesses in Callaway, just inland, as well as in the eastern side of Panama City. Sixteen people died directly from the hurricane due to storm surge flooding and the intense winds, which blew down entire forests in the panhandle and destroyed crops across southern Georgia. Wind damage extended into the Carolinas.
Very few surface observations of the hurricane’s intense winds were made at landfall. The highest gust was 139 mph measured by an anemometer at Tyndall AFB before it failed. Two coastal monitoring program towers measured 129 mph and 125 mph, substantially lower than the upgraded wind speed at landfall. One of the towers was knocked over before the peak winds struck, and the other was outside the hurricane’s core. NHC notes that the sites “were likely not optimally located to sample the maximum winds, which is typical during landfalling hurricanes.”
Uncategorized
New Western Storms Scale to Describe Intensity, Potential Impacts of Atmospheric Rivers
Hurricanes are classified by the Saffir-Simpson Scale and tornadoes by the Enhanced Fujita Scale, and now atmospheric rivers—those long, transient corridors of water vapor that fuel flooding rain events each winter in the West, especially California—will also be scaled to enhance awareness and bolster prediction.
The new AR scale ranks their intensity and potential impacts from 1 to 5 using the categories “weak,” “moderate,” “strong,” “extreme,” and “exceptional,” based on the amount of water vapor they carry and their duration. It is intended to describe the strength of ARs as beneficial to hazardous, aiding water management and flood response.
 “The scale recognizes that weak ARs are often mostly beneficial because they can enhance water supply and snow pack, while stronger ARs can become mostly hazardous, for example if they strike an area with conditions that enhance vulnerability, such as [where there are] burn scars, or already wet conditions,” says Marty Ralph and co-authors in a paper appearing in the February 2019 issue of BAMS and posted online as an early release today. “Extended durations can enhance impacts,” he says.
Ralph is director of the Center for Western Water and Weather Extremes (CW3E) at Scripps Institution of Oceanography and a leading authority on atmospheric rivers, which were officially defined by the AMS in 2017. The new scale was created in collaboration with NWS meteorologists Jonathan Rutz and Chris Smallcomb, and several other experts. It marks two decades of intensive field research that involved establishing a network of dozens and dozens of automated weather stations to observe ARs in real time and flying research planes through them as they crashed ashore and up and over the mountainous terrain of California, Oregon, and Washington.
Atmospheric rivers are the source of most of the West Coast’s heaviest rains and floods—roughly 80 percent of levee breaches in California’s Central Valley are associated with landfalling ARs. Research shows that a combination of intense water vapor transport for a long duration over a given area causes the biggest impact. But ARs also are primary contributors to the region’s water supply.
The newly created scale is designed to capture this combination, accounting for both the amount of available water and the duration it is available. It focuses on a period of 24-48 hours as its standard measurement. When an AR lasts in an area fewer than 24 hours it is demoted by one category, and if it persists more than 48 hours, it is promoted by a category. Unlike the operational hurricane scale, which has been criticized for inadequately representing the increased impacts of slower-moving, lower-end hurricanes, duration is a fundamental factor in the AR scale. It also aims to convey the benefits of ARs, not just the hazards.
“It can serve as a focal point for discussion between water managers, emergency response personnel and the research community as these key water supply and flood inducing storms continue to evolve in a changing climate,” says co-author Michael Anderson of the California Department of Water Resources.
The scale ranks ARs in five categories:
- AR Cat 1 (Weak): Primarily beneficial. For example, a February 23, 2017, AR hit California, lasted 24 hours at the coast, and produced modest rainfall.
- AR Cat 2 (Moderate): Mostly beneficial, but also somewhat hazardous. An AR on November 19-20, 2016, hit Northern California, lasted 42 hours at the coast, and produced several inches of rain that helped replenish low reservoirs after a drought.
- AR Cat 3 (Strong): Balance of beneficial and hazardous. An AR on October 14-15, 2016, lasted 36 hours at the coast, produced 5-10 inches of rain that helped refill reservoirs after a drought, but also caused some rivers to rise to just below flood stage.
- AR Cat 4 (Extreme): Mostly hazardous, but also beneficial. For example, an AR on January, 8-9, 2017, that persisted for 36 hours produced up to 14 inches of rain in the Sierra Nevada and caused at least a dozen rivers to reach flood stage.
- AR Cat 5 (Exceptional): Primarily hazardous. For example, a December 29, 1996, to January 2, 1997, AR lasted over 100 hours at the Central California coast. The associated heavy precipitation and runoff caused more than $1 billion in damages.
When AR storms are predicted for the West Coast, the scale rankings will be updated and communicated on the CW3E website and its Twitter handle.
“The launch of the AR Scale marks a significant step in the development of the concept and its application,” Ralph commented in an e-mail to the AMS, “and caused me to reflect back a bit on where it came from. All the people and organizations who’ve contributed. The scientific debate around the subject. The creation of a formal definition for the Glossary of Meteorology. The creation of a 100-station mesonet to monitor them in California. The AR Recon effort underway in a partnership between Scripps and NCEP [now NCEI], and in collaboration with the Navy, NCAR, and ECMWF, as well as others. A number of papers are already in the works using the scale, and we are hopeful that it will prove useful for the public and for officials who must deal with storms in a large area where scales for hurricanes, tornadoes and nor’easters are not very applicable.”
Lubchenco: Let's "Embed" Science in Society
In a “post-truth” world of contemporary politics and culture, “it’s easy to assume that science is really in trouble and everything is bad,” said Jane Lubchenco in her James R. Mahoney Memorial Lecture in Washington, D.C., last month.
In fact, science does have its image problems: most people don’t interact with science and don’t know scientists. A recent study showed that only 30% of Americans can even name one living scientist—and the most commonly cited name on that list last year, Stephen Hawking, no longer qualifies.
But the annual Mahoney lecture, hosted in part by AMS and NOAA, is now online, and you can see for yourself that even with a hard-hitting topic of “Science in a Post-Truth World,” Lubchenco was full of hope and practical advice about engagement, and ultimately about working toward a new paradigm of “embedding” scientists in society.
First of all, the vital signs of science are good. Public trust in scientific leaders has been stable for decades, even as it has plummeted for bankers and politicians. A majority believe science has been beneficial for society.
Lubchenco, a marine ecologist and now Distinguished University Professor at Oregon State University, has solid reason to think we can build on such durable trust. She has a history of commitment to communicating about science, as a former president of the American Association for the Advancement of Science and later as the NOAA Administrator. She’s been involved in efforts to help scientists communicate better—for example as a co-founder of COMPASS, a group that among other things provides a handy online workbook for scientists engaging the public.
In part Lubchenco argues for better understanding of the rift between scientists and the public. She cites inequities and “powerful vested interests promulgating a self-serving, anti-science agenda.” She also notes the decline of media business models that has led to citizens individually choosing their sources of information. Meanwhile, people also tune out scientists who seem to have ulterior motives, or are all “doom and gloom.”
Lubchenco says part of the solution is simply putting a real human face on science. The fact that people don’t know scientists means we have “an incredible opportunity. We need more scientists who are seen as scientists by the general public.”
Lubchenco argued that this doen’t mean every scientist is suited to being a celebrity or even a regular public messenger. Research shows that people are considered trustworthy when they are competent—but they also need to be “warm.” Teachers and nurses rated highly in both; professors and scientists rated highly in competence, but were seen as “cold.”
“Part of that is the way scientists are trained to talk to people,” said Lubchenco. It’s the downside of a facts-only, no-stories scientific culture. Lubchenco urges good analogies and metaphors and above all, making a connection with audiences. “Finding common ground and creating a shared value experience enables you to then pursue things that might be particularly contentious.”
While Lubchenco offered many tips on better communication—understanding audience, keeping messages simple, offering hope, showing value and successes—she went deeper, arguing that scientists need to be “physically and psychologically integrated” with society. She urged scientists to show who they are by working with society. One avenue is to enlist citizen scientists as well as a broader public in observing and other projects.
Lubchenco also wanted her audience to see beyond the dichotomy of applied and basic science—that we need more of the middle way of “use-inspired science” that has immediate relevance as well as prospects for advancing basic knowledge.
What are impediments? Science itself needs to reward its people who are good at outreach, Lubchenco said. They need training and recognition for it. They need to get involved, including running for political office. “I don’t think all scientists should be engaging… but they should all support their colleagues that do.”
There may already be progress in this direction, Lubchenco noted, moving first from an “ivory tower” model of science to a post-World War II “social contract” with the public, producing great benefits. “Now, I think we’re seeing another innovation from social contract to science embedded in and serving society—maybe.”
If people generally don’t know any living scientists, there’s one whose recent example can be an inspiration for Lubchenco’s vision of science more fully “embedded” in society: That would be the late Jim Mahoney, the NOAA Deputy Administrator, AMS president, and public health scientist whose memory this annual lecture honors. Said Lubchenco,
Science is indeed facing some major challenges. Maybe it’s not quite as bad as we thought, but we have unparalleled opportunities to serve society better and this is only going to happen if scientists take the bull by the horns and step up and make things happen.
I’d like to think we can do this in a way that is inspired by Jim’s example in confronting challenging times and figuring out how to navigate those. I would suggest that maybe if he were here, he would say, “It’s time for us to take back the narrative.” It’s time to write a new chapter in the relationship between science and society and for us collectively to have a quantum leap in relevance.”
There's That Word Again: "Bomb"
It’s like the word du jour. Or, more accurately, THE word du storm.
It seemed like every time this winter that a big East Coast storm—a significant nor’easter—looked impending in computer models, the media hype machine cranked out the word “Bomb.” Or “bomb cyclone.”
And here it is again:
“Destructive Nor’easter Emerging; Expected to ‘Bomb Out’” weather.com trumpeted Thursday morning about Friday’s storm.
“Bomb Cyclone: MA Town Orders Voluntary Evacuations” the Falmouth Patch splashed on its online front page. (Ponder that additional hype for a moment: order “voluntary evacuations.”)
“Another ‘bomb cyclone’ — with a huge flood risk — is aiming for the Northeast” buzzed CNN.
Bomb cyclone. As in meteorological bomb. Short for bombogenesis. Not a fiery explosion, but rather an explosive—as in extremely rapid—deepening or lowering of atmospheric pressure in the center of the storm. A drop of at least 24 mb in 24 hours. That ramps up big winds.
This time, though, the term may be apropos. And not just meteorologically.
While the pressure in tomorrow’s nor’easter is expected to plunge from about 1006 mb to 975 mb—31 mb—from Thursday night to Friday night, meeting the definition of bombogenesis, it’s the formidable eruption of hazardous weather—high winds, heavy rain and snow, and coastal flooding, potentially major to even severe coastal flooding, the NWS in Boston says—that will define this particular storm.
The storm will generate high winds from the mid-Atlantic to eastern New England, gusting 50-60 mph in many areas and possibly to 75 mph hurricane force in southeast New England and on eastern Long Island. For a long time, as strong high pressure over Greenland (that incidentally has brought stunningly warm air to the Arctic) slows the storm’s departure.
These northeast winds will persist through three high tide cycles, some of the highest tides of the month, contributing to minor to major coastal flooding from Maryland to Maine, as detailed in a blog post by the Weather Underground. And with 2-3 feet of storm surge combined with 20-30 foot waves just offshore and tides Accuweather says are already running 2-4 feet above normal, there’s a small chance that flooding at the coast could be severe and widespread—”a very dangerous situation that may require evacuations,” the NWS in Boston stated in its 5 a.m. Thursday Area Forecast Discussion.
Add to that 2-4 inches of rain likely to worsen snowmelt flooding across much of Southern New England and more than a foot of heavy, wet snow in the higher elevations of the Northeast, and Friday’s nor’easter looks set to do some damage. Power outages from the winds and snow are likely.
We’ve posted about meteorological bombs before, here and here. This time, this nor’easter might just live up to the hype.
A Letter from AMS President Roger Wakimoto
Dear AMS Community,
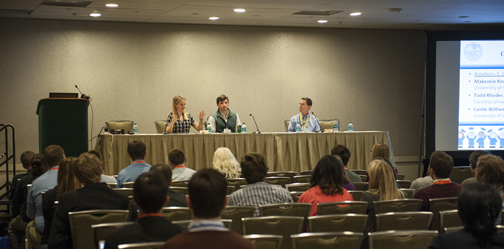
I am delighted to send this letter to you after the wonderful Annual Meeting in Austin. You told us that the Presidential Forum with Richard Alley and the Presidential Town Hall on the recent hurricane season were the highlights of the week (both can be viewed online) and I am glad that our efforts to arrange for these two events were well-received. The latter was possible owing to our breadth as a scientific and professional society. It allowed us to assemble a panel of experts from the university and broadcast communities, NWS, FEMA, and Flood Control District that could tell a story that was quite engaging.
I was honored to have completed President Matt Parker’s vision for the Annual Meeting. I believe that he would have been very pleased with the program. Of course, the AMS staff, Executive Committee, and Council are an amazing and supportive group to work with and I owe them a deep debt of gratitude for supporting me during the past year.
I wanted to take this opportunity to highlight a couple of priorities that I will be working on in the coming months. I am deeply committed to diversity, equity, and inclusion. The AMS supports a number of programs that illustrate their commitment to diversity. However, I believe it is time to step back and review diversity, equity, and inclusion across AMS in a holistic manner and assess the collective effectiveness of its broadening participation efforts. What is our strategic vision on this important topic? With the support from Council, I appointed and charged a task force to review what the Society has accomplished to date in this area and to deliver a set of recommendations, including bold ones if necessary, to guide us as we rapidly approach our Centennial celebration. Susan Avery has kindly agreed to Chair this task force and I hope you contact her with your advice and suggestions.
There have been a number of events across the nation this past year that few of us could have predicted. The withdrawal from the Paris Climate Agreement (currently the only nation to do so), the March for Science, a proposed tax on graduate student tuition waivers, controversy at the EPA on the subject of membership on advisory committees and climate-related issues, and no Science Advisor for the Administration (the longest time this position has been left unfilled since it was created). These and other events beg the question whether AMS should alter the direction of its advocacy program or stay the course in this age of disruption. I have asked the Council to discuss this topic in the coming months so that we can define a path forward and communicate it clearly to all of you.
Finally, I would like to remind you of my vision for next year’s theme for the 2019 Annual Meeting in Phoenix, “Understanding and Building Resilience to Extreme Events by Being Interdisciplinary, International, and Inclusive.” It is the first time that extreme events, international and inclusive have been specifically highlighted in a theme and it is a timely subject owing to the natural disasters that impact our society and the need to build resilience. Xubin Zeng and Wen-Chau Lee are the overall program co-chairs and they are working with a great team that includes Julie Demuth, Rebecca Haacker-Santos, Sarah Jones, and Chris Schultz. The 2019 Annual Meeting will be the kickoff for a year-long celebration leading up the 2020 Centennial Meeting in Boston (will it snow or not??).
AMS has been a great organization that has supported me personally throughout my long scientific and professional career. In the bigger picture, AMS has endeavored to remain relevant and has adapted to change when necessary. Of course, AMS only exists because of you and the enormous number of hours that you volunteer to the organization. It is the primary reason that I know that the Society will continue to be strong and impactful for years to come. I hope to both meet and interact with as many of you as possible this year.
Roger M. Wakimoto, President, American Meteorological Society
Standing Up for the Integrity of Science
by Keith Seitter, AMS Executive Director
In carrying out its mission, AMS provides a broad range of support for the science and services making up the atmospheric and related sciences. As a part of this support, AMS has a long history of being a voice on behalf of science and the scientific method—as do most other scientific societies such as AAAS, AGU, Sigma Xi, and many, many others. This past year has been especially challenging for all of us as pressures and outright attacks on science have become far more prevalent. AMS has always been careful to be nonpartisan, to avoid being policy prescriptive, and to really focus on science. We have not, however, shied away from taking strong positions on behalf of the integrity of science.
The hope is that the community and society will view AMS journals, statements, and other material as reliable sources of information on the scientific disciplines AMS covers. AMS statements, in particular, are developed with the goal of being broadly accessible to those seeking credible summaries of current scientific knowledge and understanding on various topics. Beyond being a resource, however, it is vital that AMS proactively stand up for the integrity of science and the scientific process—especially when it is mischaracterized in ways that might impact policy decisions or mislead the public.
There is an extraordinary amount of misinformation being disseminated through many outlets on a variety of topics (but perhaps most notably those associated with climate change)—far more than one can effectively monitor or hope to address. With so many incorrect or misleading statements out there, it can be hard to know when to jump into the discussion. Recognizing that we cannot address all instances of misinformation, AMS has focused instead on taking a more public stance when policy makers in leadership positions make statements that mischaracterize the science. Thus, this past year for example, AMS has sent letters to the EPA administrator and the Secretary of Energy (see the “AMS Position Letters” for an archive of all letters that have been sent by AMS).
Protecting the academic freedom of researchers, and the freedom to present their scientific results broadly and without censorship, intimidation, or political interference, has also been important to AMS for many years. These fundamental precepts upon which scientific advancements depend have come under attack before, and AMS has maintained a strong “Statement on the Freedom of Scientific Expression” for a number of years to make the Society’s position clear.
Scientific advance requires that all data and methodologies leading to research results be openly and freely available to others wishing to replicate or assess that research. That said, AMS has spoken out to protect the confidentiality of discussions among researchers as they develop ideas and critically assess the work of others. These candid discussions are essential and must be able to happen without fear among those involved that comments might be taken out of context to attack the research or the researchers.
AMS membership is diverse and not all members have been supportive of these efforts. I can appreciate the concerns some may feel, and know there is a danger of acting out of bias, despite our putting a lot of time and energy into avoiding biases. I know, as well, how easily inherent biases can color the way one might read these statements or letters. I also know, however, that to remain silent in the face of clear mischaracterization of science or to fail to defend the scientific process is wholly inconsistent with the AMS mission of “advancing the atmospheric and related sciences, technologies, applications, and services for the benefit of society.” I’m proud to be part of an organization that has such a strong history of standing up for the integrity of science.
(Note: This letter also appears in the September 2017 issue of BAMS.)
Cruising the Ocean’s Surface Microlayer
Oceans are deep, and they are integral to the climate system. But the exchanges between ocean and atmosphere that preoccupy many scientists are not in the depths but instead in the shallowest of shallow layers.
A lot happens in the topmost millimeter of the ocean, a film of liquid called the “sea-surface microlayer that is, in many ways, a distinct realm. At this scale, exchanges with the atmosphere are more about diffusion, conduction, and viscosity than turbulence. But the layer is small and difficult to observe undisturbed and over sufficient areas. As a result, “it has been widely ignored in the past,” according to a new paper by Mariana Ribas-Ribas and colleagues in the Journal of Atmospheric and Oceanic Technology.
Nonetheless, Ribas-Ribas and her team, based in Germany, looked for a new way to skim across and sample the critical top 100 micrometers (one tenth of a millimeter) of the ocean. This surface microlayer (SML) “plays a central role in a range of global biogeochemical and climate-related processes.” However, Ribas-Ribas et al. add,
The SML often has remained in a distinct research niche, primarily because it was thought that it did not exist in typical oceanic conditions; furthermore, it is challenging to collect representative SML samples under natural conditions.
In their paper (now in early online release), the authors report on their solution to observing is a newly outfitted remote-controlled catamaran. A set of rotating glass discs with holes scoops up water samples. Pictured below are the catamaran and (at left, top) the glass discs mounted between the hulls and (bottom left) the flow-through system.
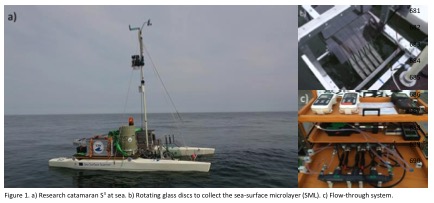
Catamarans are not new to this research, but they were generally towed behind other vessels and subject to wake effects or were specialized. The new Sea Surface Scanner (S3) takes advantage of better remote control and power supply technology and can pack multiple sampling and sensors and controls onto one platform. Tests in the Baltic Sea last year showed the ability of S3 to track responses of organisms in the surface microlayer to ocean fronts, upwelling areas, and rainfall. The biological processes in turn affect critical geochemical processes like exchanges of gases and production of aerosols for the atmosphere.
The technology may be a fresh start for research looking in depth at the shallowest of layers. See the journal article for more details on the S3 and its performance in field tests.
Monster Felix Slammed Hurricane Hunter Plane in 2007
A one-two punch inside intense Hurricane Felix in 2007 turned a NOAA hurricane hunter flight into a harrowing rollercoaster ride, causing the mission to be aborted. A study of the extreme event, scheduled for publication in the next issue of Monthly Weather Review, determined a small-scale vortex known as a misocyclone rotating within the Category 5 hurricane’s eyewall is likely what bucked the plane upward nearly a thousand feet before sending it plunging back to its original altitude in less than a minute. The feature is similar to what nearly crashed the same plane inside Hurricane Hugo in 1989.
According to the study, a “routine penetration” into the eye of the hurricane via the northeast eyewall on September 2, 2007 quickly became anything but. First, the horizontal wind speed at the plane’s altitude of about 10,000 feet jumped from 140 mph to nearly 200 mph. At the same time, a standard descent into the eye at a constant 700 mb pressure height quickly steepened and the plane lost more than 700 feet in altitude in 40 seconds. Then a 70 mph updraft punched the plane up 900 feet immediately followed by a 16 mph downdraft that hammered the plane downward 980 feet, in seconds. The on-board radar quit. And gravitational stresses on the aircraft exceeded safety specifications. The mission was scrubbed and the plane then settled into Felix’s calm 12-mile-wide eye at about 8900 feet, circling five times until it could find a safe pass through the southwest eyewall and out of the hurricane.
They were lucky.
The hurricane hunters have unknowingly flown into these updraft-downdraft combinations before. They seem to only encounter them in monster Category 5 hurricanes, which have sustained winds greater than 156 mph. Besides Felix, researchers have documented the extreme events in Hurricanes Patricia (2015), Isabel (2003), and Hugo (1989). The encounter in Hurricane Hugo took place with the same hurricane hunter plane (NOAA42) flying at just 1500 feet, which was typical back then. Not any more. Fists of wind smashed the aircraft downward more than a thousand feet and then back upward, knocking out three of the its four turboprop engines and crippling the plane. It barely made it out, and afterward the rules for hurricane eye penetrations were rewritten.
Back it 1989, researchers thought they had perhaps flown into a tornado in the eyewall. But in Hurricane Isabel, data revealed a vortex a bit larger but no less intense was encountered. Similar in scope but smaller in size to the rotating 5-10-mile-wide updrafts of supercell thunderstorms, which have become known as mesocyclones, the hurricane eyewall vortexes were only a fraction of that—hence the name misocyclones, or small-scale cyclones.
In Felix, a bit of serendipity: just as the plane encountered the misocyclone, researchers released a commonly used tube of instruments called a dropwindsonde into the eyewall to measure temperature, pressure, humidity, and with onboard GPS tracking, wind speed and direction. The dropwindsonde measured details of the wind within the misocyclone, including a shift in the horizontal direction and a speed that jumped to more than 230 mph at about 400 feet decreasing to just 41 mph near the water. The tremendous shear—change in the wind speed in such a short distance—is “8 orders of magnitude larger than those known to lead to […] horizontal shearing instabilities and misocyclone development,” the study noted based on prior research.
It’s only the second time details of a misocyclone have been measured, making them largely mysterious events. For example, researchers aren’t certain how common or unusual they are. “Many very intense tropical cyclones have been sampled with aircraft without encountering these extreme events,” the study states, adding, “It is unknown whether they have been missed by the relatively sparse observations available, because aircraft tend to deviate around the most intense eyewall convection, or if they are truly rare.”
Deepening the mystery is the timing of the extreme event inside Felix—it occurred as with Hugo at the end of a period of rapid intensification, which is when a hurricane’s central pressure drops precipitously ramping up its sustained winds very quickly. Winds in Hurricane Felix increased by 90 mph to 165 mph sustained that day in 2007. It has been thought that extreme features in hurricanes such as lightning, graupel, and eyewall vortices likely occur during periods of rapid intensification, as occurred with Hurricanes Isabel and Patricia. But Felix is the second intense hurricane where such an extreme event took place at the end of a rapid intensity cycle, and learning why while keeping the hurricane hunters safe will require further study.
“The frequency of these features and their ultimate importance in the structural evolution [of hurricanes] remain research questions. It is clear, though, that improved understanding of these features would enhance the safety of flights into very intense tropical cyclones.”
Yes, We've Got Maps
Richard Jackson: “And by the way: political leaders are REALLY good at maps. Map your data.” #AMS2017
— Jared Brewer (@BrewRed) January 23, 2017
This point was made at Monday’s Presidential Forum, where Dr. Richard Jackson of UCLA was talking about how much our scientific community offers to the world of public health, and how we might best be able to move decision makers to action based on climatic information.
It is good news. Nobody makes maps more eagerly than meteorologists.
Hardly a session goes by at the AMS Annual Meeting without some sort of map—often of some unexpected variable. For example, today at 10:45 a.m. (Skagit 4), Yonghua Wu (City Univ. of New York) and colleagues pull together trajectory modeling, lidar ceilometer, and satellite observations to map air quality variations due to the interaction of boundary layer conditions with wildfire smoke plumes this past summer over New York City.
![]() Then on Thursday (1:45 PM, Tahoma 2), you can map the New York City area again, in a completely new way: Sina Kashuk of NOAA shows spatial density maps of the 5 million flood-related phone calls across the five boroughs.
Then on Thursday (1:45 PM, Tahoma 2), you can map the New York City area again, in a completely new way: Sina Kashuk of NOAA shows spatial density maps of the 5 million flood-related phone calls across the five boroughs.
Using the top 25 most frequent complaint types ranging from noise to rats, the overall propensity of calling was estimated and mapped. This map was then used to normalize the flood-related complaints. The temporal-spatial analysis was highly correlated with monthly rainfall intensities.
Clearly, no place is mapped in one particular way. Maps say as much about the data and the analysis as about the specific location. Mapping is thus an essential tool for coalescing, analyzing, contemplating, and communicating observations.
Harvard historian Peter Galison takes this point a step further in his studies of the history of observing as evinced by map-making. Through a selection of atlases across the centuries, all made by scientists, he shows how the powers of observation and the expectations and capabilities of science are all intertwined, and all evolving. The idea of observing itself is not the same today, he shows, as it was in Newton’s time or even in Einstein’s. In this lecture from 2011 he uses the atlases to trace the history of objectivity itself in mapping:
Which brings us warily to the title of a presentation this morning (8:30 AM, Room 611) , “Beyond Maps-How Cloud Computing Enables the Future of Geospatial Analysis Services.” Presenter Steve Kopp of ESRI explains:
[W]e now see a technology transformation that is enabling deeper understanding, and will lead to new insights and new discoveries. Early adoption of geospatial cloud computing focused on organizing and sharing data….Map services (a picture of the data) are symbolized data ready to view, and require fewer specialized skills than working with raw data such as GRIB files. More recently organizations have begun providing weather and climate data services. These are feature services like WFS and image services like WCS. Data services allow customization of the symbology and more flexibility in visually combining with other data, but also can be used for analysis allowing the user to ask new questions with the data. The transition to data services feeding into analysis services will have a profound impact on the utility and growth of geospatial cloud computing.
Perhaps someday historians will see this AMS Annual Meeting as a part of shift that led the way to yet another stage in the growth of science itself.
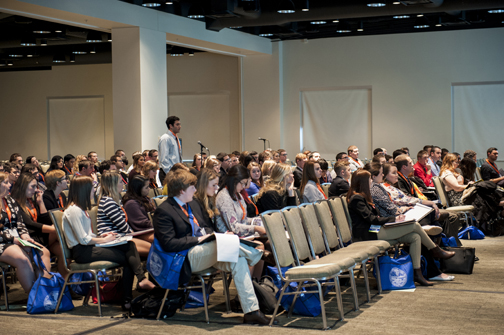
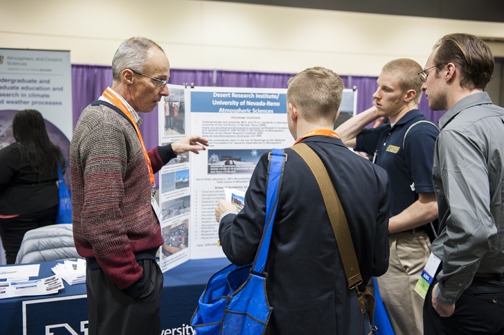
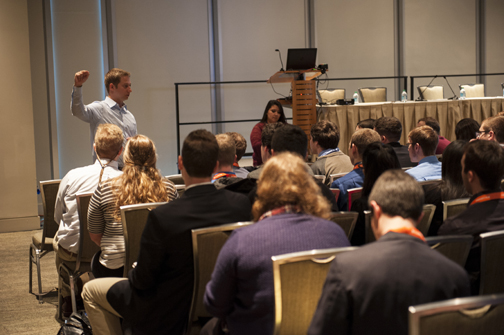
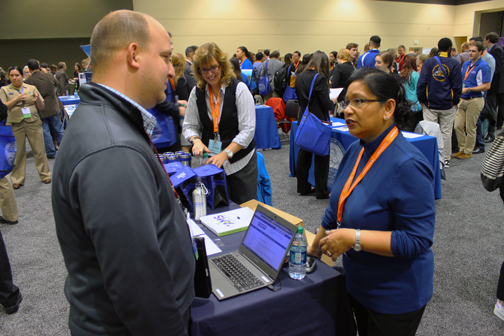
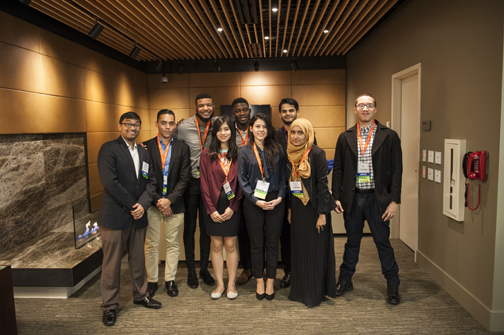
The Future Starts Now with Student Conference
The Annual Meeting kicked off this weekend with one of our biggest Student Conferences ever, as more than 700 students were in attendance. It was a lively, entertaining, and educational event for everyone who participated, as can be seen in these observations taken at the Conference: