Pioneering Space Weather Expert Dies

Paul Kintner, a Cornell University engineering professor  and head of the university’s Global Positioning Systems Laboratory, died Monday at age 64. He’d been battling pancreatic cancer.
Kintner was a major influence in the engineering world for recognizing the potential of global positioning technology, but to the AMS community he was a leader in the science of the effects of the Sun on the atmosphere, starting from his Ph.D. work at the University of Minnesota on the plasma physics of the northern lights high above the Earth. Later he studied the effects of the Sun on radio signals and in particular GPS. His observational studies made him the discoverer of  “electrostatic ion cyclotron waves, double layers and lower hybrid solitary” in space.
Says Rich Behnke of NSF, a member of the AMS Committee on Space Weather,

Paul was the quintessential professor – super bright, outspoken, a superb scientist and a deeply committed teacher.  He has been a real pioneer in developing GPS technology and advocating the importance of space weather on society.  He was also a personal friend, a running buddy, and a wonderfully warm human being with a great smile.

Kintner was scheduled to be one of the featured speakers at the upcoming Symposium on Space Weather at the AMS Annual Meeting in Seattle in January. His topic during the Tuesday, 25 January session was to be “GNSS, GPS, Modernized Signals and the Next Solar Maximum.” In his abstract he notes that GPS had just become open to widespread application during the previous solar max, which at one point in October 2000 resulted in a 26-hour outage of navigational services. Now many more applications are based on GPS and a solar max is approaching in 2013. While newer, more robust technology is being phased in, Kintner noted that

the overwhelming majority of operational GPS receivers will use the legacy GPS signals during the next solar maximum….[Precision applications based on GPS] have dramatically increased over the past solar minimum along with the assumption that the services will be truly uninterrupted and continuous. Providers of these services should be aware of three potential space weather impacts, density gradients as before, scintillation and especially phase scintillation which has only recently been resolved, and solar radio bursts about which we know little.

This presentation at the meeting will be replaced by a tribute to the Kintner and his pioneering contributions to our sciences.
You Weren't the Only One Who Mist This Game

Football is tough enough to play when the visibility is good; when you can’t see your own teammates, it’s a whole lot tougher.
In the infamous “Fog Bowl” on 31 December 1988, the Philadelphia Eagles somehow managed over 400 yards of passing. Then again, the game started out sunny and unseasonably warm, perfect for the Eagles’ flashy offense. But thick fog soon rolled in off the lake and onto Chicago’s Soldier Field until visibility was less than 20 yards, making passing a precarious proposition and helping the defensive minded Bears grind out a 20-12 victory with their strong ground-based attack.

Last Friday two Michigan high school football teams topped that NFL classic with an even thicker fog-bound playoff game of their own. At least, it looks like they did…through practically no one actually saw what was happening on the field. Rub your eyes, clean your computer screen, and check out the video highlights here.
Host Bedford-Temperance High School built a two-touchdown edge over Grosse Pointe South High School under the Friday night lights, but gave the ball away four times and saw their lead evaporate in a series of miscues. Twice the Grosse Pointe defense scooped up fumbles and returned them for touchdowns when the Bedford-Temperance quarterback couldn’t find the teammate he was supposed to hand off to in the mists.
The game came down to a last-second Grosse Pointe kick that, according to the referees, split the uprights for a 44-42 victory over Bedford-Temperance. This was one game where the guys in the striped shirts really were the only people in the stadium in a position to know for sure.

A White House Moment

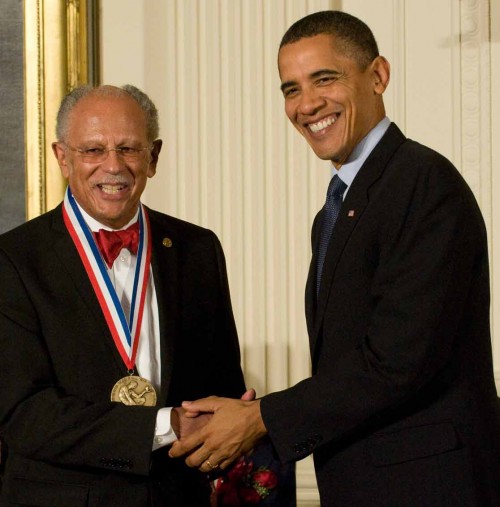
Dr. Washington goes to Washington. Photo courtesy Ryan K Morris Photography/National Science & Technology Medals Foundation

Yesterday at the East Room of the White House, President Obama honored the winners of the National Medal of Science, including AMS past president Warren Washington. President Obama noted:

It’s no exaggeration to say that the scientists and innovators in this room have saved lives, improved our health and well-being, helped unleash whole new industries and millions of jobs, transformed the way we work and learn and communicate. And this incredible contribution serves as proof not only of their incredible creativity and skill but of the promise of science itself.

For more on the award, see our post from October 16.

Kermit Would Approve

It’s not easy being green, as Kermit the Frog famously lamented on the TV show, “Sesame Street,” but it might be getting easier thanks in part to the Tungara frog—a native of Central and South America. David Wendell of the University of Cincinnati recently led a study that developed a new type of foam that can absorb CO2 and convert it to sugar before it escapes into the atmosphere (a process that occurs naturally in plants during photosynthesis). A key ingredient in the foam, which could be placed into the exhaust systems of power plants, is a protein that is naturally created by the Tungara frog to form a foam nest that protects their eggs. (Here’s a brief video showing a frog weaving the nest.)  
“I read about a protein that the frog uses that allows bubbles to form in the nest, but doesn’t destroy the lipid membranes of the eggs that the females lay in the foam, and realized that it was perfect for our own foam,” says Wendell. The CO2-absorbing foam is an amalgam of numerous enzymes harvested from plants, fungi, bacteria, and frogs, and it converts all of the solar energy it captures into sugars, making it as much as five times more efficient than plants, and, according to Wendell, “the first technology that actually consumes more carbon than it generates.” The invention recently won the $50,000 grand prize at the 2010 Earth Awards, which were founded in 2007 to encourage innovative designs “to improve our quality of life and build a new economy.”

Successful Launch for Rocket City Weather Fest

In October, the University of Alabama in Huntsville student chapter of AMS (UAHuntsville AMS) hosted its first Rocket City Weather Fest (RCWF), a free weather festival for the North Alabama community.  For its debut year, the fest had close to 300 in attendance, as well as more than 50 exhibitors and presenters.
“Due to the variety of weather extremes experienced in the Tennessee Valley, one of the priorities of the UAHuntsville AMS is to educate the community about severe weather safety,” comments Sandy LaCorte, RCWF event coordinator and UAHuntsville AMS education outreach committee chair. “The event gave children and adults the opportunity to explore the atmospheric sciences through hands-on activities, demonstrations, and informative seminars, emphasizing safety and preparedness.”
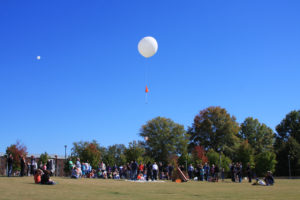
At the Wacky World of Weather, kids learned about hurricanes, tornadoes, hail, and floods. Other activities included weather-themed movies in Sci-Quest’s Roaming Dome, a planetarium style inflatable theater, plus a weather miniature golf and beanbag toss. Attendees were also given the opportunity to see a weather balloon launched by the UAHuntsville atmospheric chemistry research group.
RCWF is the chapter’s newest endeavor in community outreach. Members, who are undergraduate and graduate students in pursuing careers in atmospheric and earth sciences, also speak at local schools, judge regional and state science fairs, administer tests for the Science Olympiad, and program weather radios at various events.

A Vote for Weatherproof Elections

Predicting–as opposed to actually voting in–elections has become a national past-time, if one is to judge the media’s obsession with who’s going to win what in today’s midterm contests in the United States. And what better way to make predictions than to ponder the weather map?
Tony Wood of the Philadelphia Inquirer, however, disputes the oft-cited connection between weather and election results. In a post last week on “Weather, Democracy, and Mythology“, he looked into the old theory that rain dampens voter turnout and concluded that it doesn’t hold water:

Consider the 2004 presidential election. Recall that it all came down to Ohio in a close race between President Bush and Democratic nominee John Kerry.
That Election Day was a nasty one all over the state. It rained almost everywhere. The result? The voter turnout in Ohio was believed to be highest in at least 40 years. Some folks were said to be waiting up to nine hours to vote.
We did our own analysis of 30 years of election returns and weather in Philadelphia found no evidence of a link between the two. It rained on half of the Election Days with the 10 highest turnouts, while seven of the 10 lowest-turnout days were rain-free.

What about the oft-told story of the 1960 election? In his classic, The Weather Factor, meteorological historian David M. Ludlum claimed that rain in Illinois (on an otherwise mostly fair day across the country) hindered Nixonian rural voters more than Kennedy liberals in Chicago? Wood counters with political analyst Terry Madonna of Franklin & Marshall University, who says weather took a back seat to the behind-the-scenes intervention of Mayor Richard Daley:

“It [the rain] didn’t matter,” said Madonna, “because Daley had those votes already counted.”

We’re not sure how that explanation is logical (given that Ludlum’s theory is more about the lack of rural voters than about any surge in urban voters), but more specifically it would be great to see more of Wood’s 30-year study. In the meantime, the one recent study, by political scientist Brad Gomez and colleagues, quantifies a correlation between weather and voter turnout. The paper, published in 2007 by the Journal of Politics, was discussed at the 2008 AMS Broadcast Meteorology conference (audiovisual version here) by Allan Eustis.
Gomez et al. found that every inch of rain above normal correlates significantly 1% reduction in voter turnout. Similarly, every inch of snow correlates significantly to a 0.5% drop in voter turnout.
Eustis pointed out some limitations in this seemingly exhaustive study involving 22,000 weather observations (to resolve weather effects locally) across 14 national presidential elections. For instance, there’s no mention of extreme temperatures or windy weather. Eustis believes extreme weather, not deviations from norms, are more significant in turnout (therefore a linear relationship between precipitation and voting might not be valid).
Cliff Mass of the University of Washington discusses the Gomez paper in his blog and quickly throws a bucket of cold water on the the relevance of those numbers for today’s election, anyway:

Now an inch of rain is quite a bit of precipitation, only occurring during major storms (like Monday in the NW) or in thunderstorm areas.
Furthermore, these results were for presidential elections where people are generally highly engaged and motivated. What about midterm elections like Tuesday’s? If we assume that people would be less excited than for presidential runs would one expect the influence of precipitation to be greater for this election?
And what about the influence of the greater proportion of absentee ballots and of extended balloting times (some places in the U.S. allow voting in the weeks before the election)?

Playing along with the Gomez et al. paper for the moment, however, Mass  predicted (on Sunday) that if Republicans are indeed favored by lower turnout and thus precipitation, the relatively small areas of rain today will have little impact because it will fall areas that are already leaning heavily toward Republicans.
Eustis, however, notes that other studies of weather and elections, unlike Gomez et al., don’t support the adage that Republicans pray for rain (for instance this 1994 paper by Steve Knack of American University).
What Eustis has learned while working for the National Institutes of Standard and Technology, however, is that the weather effects the voting systems, not the voting people: apparently optical scanners can incorrectly process paper ballots, which expand in excessive humidity causing misalignment (see the 2005 SAT scoring controversy).
Ah, for the simple days when gentleman farmers slogged through the mud and rain, got further sloshed with liquor, shouted their preferences to the poll takers, and went home waiting weeks for the results with nary a prognosticating pundit to second-guess them.

Getting Remote Data to Remote Regions

While Internet connections in more remote regions of the world have improved over the years, connectivity challenges still inhibit delivery of scientific data to people who need it. This past month the situation has gotten a little better, thanks to some international collaborations involving satellite data.
Often remote places are in developing countries that lack funding for the state-of-the-art connectivity necessary for scientific information. Back in 2003, in a BAMS essay, “The ‘Information Divide’ in the Climate Sciences,” Andrew Gettelman addressed the struggles of scientists in developing countries to keep up with the rest of the world in increasingly technology driven times. In visits to a number of countries around the world, Gettelman found slow or nonexistent internet access, outdated operating systems, and other hurdles limited the ability of these scientists to keep up with the literature and access data, among other problems.

The information divide is not unique to the atmospheric and related sciences. However, because of the unique role that timely information plays in forecasting, and the need for data for climate studies, the divide may be especially critical in these disciplines.  Our science is global, affects people globally, and requires global information.

Five years later Michel Verstraete of the European Commission Joint Research Centre Institute for Environment and Sustainability (JRC-IES) still found limited internet access when participating in a field campaign in 2008 to study the environment around Kruger National Park in South Africa. JRC-IES and South Africa’s Council for Scientific and Industrial Research (CSIR) joined forces to address the problem of accessing large satellite data files crucial in research related to sustainable development and other environmental studies. NASA became involved the following year, when the problem of electronic access became obvious during a workshop in South Africa on use of Multi-angle Imaging SpectroRadiometer (MISR) data.
The solution: NASA recently shipped 30 TerraBytes of MISR data directly to a distribution center in Africa. CSIR will manage the center and offer free access to researchers in the region. Verstraete, along with members of the other agencies, plans to upgrade connectivity and encourage participants to share data.  Verstraete says he hopes this collaboration will strengthen academic and research institutions in southern Africa.
Adds Bob Scholes, CSIR research group leader for ecosystem processes and dynamics at NASA,

The data transfer can be seen as a birthday present from NASA to the newly formed South African Space Agency. It will kick start a new generation of high-quality land surface products, with applications in climate chance and avoiding desertification.

Last month NASA also joined up with the U.S. Agency for International Development a new node for accessing satellite and other environmental information through the web-based SERVIR system. This time the local collaboration is with the International Centre for Integrated Mountain Development. ICIMOD analyzes geophysical monitoring and predictive information and also can disseminate the information through its relationships with the region’s decision makers. Remote sensing is critical in monitoring sparsely populated, difficult-to-access mountainous areas of the Hindu-Kush-Himalaya region—which includes Afghanistan, Bangladesh, Bhutan, China, India, Nepal, Myanmar, and Pakistan. SERVIR addresses issues of land cover change, air quality, glacial melt, and adaptation to climate change and other crucial issues in the mountainous region.
As Gettelman concluded in his article:

Perhaps the most important recommendation is that, as we restructure the model of scientific communication in the information age, we ensure that it benefits the maximum number of people. The greatest gains in terms of lives saved and mitigation of the impacts of weather extremes and changes in the climate can most likely come from not just improving the state of knowledge but improving the access to existing knowledge and information by scientists, forecasters, and policy makers around the world.

The Bomb

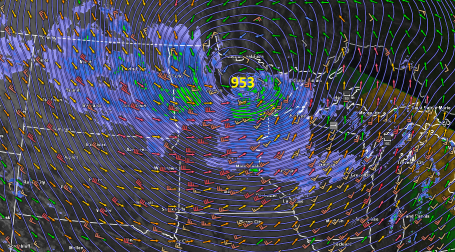
The storm system moving through the Midwest today met the usual criteria–one mb surface pressure drop per hour over 24 hours– for a “bomb”. We usually associate such rapid intensification and deep pressures with storms over the ocean, but this landshark of a storm this morning reached a low pressure stronger than a number of the Atlantic hurricanes this year. Says Paul Douglas in his Minneapolis Star-Tribune blog,

Welcome to the Land of 10,000 Weather Extremes. Yesterday a rapidly intensifying storm, a “bomb”, spun up directly over the MN Arrowhead, around mid afternoon a central pressure of 953 millibars was observed near Orr. That’s 28.14″ of mercury. Bigfork, MN reported 955 mb, about 28.22″ of mercury. The final (official) number may be closer to 28.20-28.22″, but at some point the number becomes academic. What is pretty much certain is that Tuesday’s incredible storm marks a new record for the lowest atmospheric pressure ever observed over the continental USA. That’s a lower air pressure than most hurricanes, which is hard to fathom.

The previous record for Minnesota was 28.43 inches, or 962.6 mb, was set at two stations, Austin and Albert Lea, during the 10 November 1998 storm.
At the Minnesota Climatology Working Group they refer to an even lower pressure over the continent, for the 26 January 1978 Ohio blizzard–28.05 inches. That storm is highlighted in a Monthly Weather Review paper on bombs over the eastern United States by Bruce MacDonald and Elmar Reiter. It deepened 24 mb in only 9 hours!

One blogger made “bomb cyclogenesis” the word of the day:

Sounds very terrorism-cyberpunk, doesn’t it? Sort-of-luckily for the state of Minnesota, it’s actually a meteorological term. I say “sort of” because bomb cyclogenesis will probably work out better for us as a weather phenomenon than it would as a tactic of the android jihad, but it’s still not great.

Douglas, Paul Huttner of Minnesota Public Radio, and others also referred to the storm as a “land hurricane.” The language makes it clear that such storms are not common over the continent.
Indeed bombs are usually a maritime phenomenon. However, not always. Often forgotten in such discussions of rapidly intensifying storms are some of the early parameters set forth in the classic paper by Fred Sanders and John Gyakum in Monthly Weather Review, 1978. In their climatology of “bombs,” they note that these storms are “primarily maritime” but also show significant frequency in the eastern United States–in other words, bombs are not particularly rare over land.
Sanders and Gyakum took the standard of 24 mb drop in 24 hours from Tor Bergeron’s earlier work on rapid intensification. In extending the Norwegian’s work, they noted that an equivalent intensification depends on latitude: at the pole it would be 28 mb/24 hours; at 25 degrees latitude it would be only 12 mb/24 hours. All of these rates qualify for what Sanders and Gyakum called “1 bergeron”. At a latitude of around 45 degrees North, yesterday’s pressure drop needed to be only 19 mb to qualify. (The latitude of Bergeron’s Bergen, Norway is above 60 degrees North.)
Among the many factors that separate ordinary extratropical cyclones from rapidly deepening bombs over land, MacDonald and Reiter noted that both the focus of rising air and surface convergence coincide closely with surface low. There’s also copious heating, including the large-scale latent heat release (condensing moisture) that intensifies as the storm matures. (For more factors, download the paper here.)
Here’s a Storm Prediction Center animation of the storm deepening in “bomb” mode.

Follow the Water

As the world’s population grows, so does water usage. As a result, the rate we pump water out of the ground to satisfy our thirst and, more frequently, the thirst of the plants we grow, has been exceeding the rate that precipitation can replenish that water. From the news page of the International Groundwater Resources Assessment Centre about a study in Geophysical Research Letters:

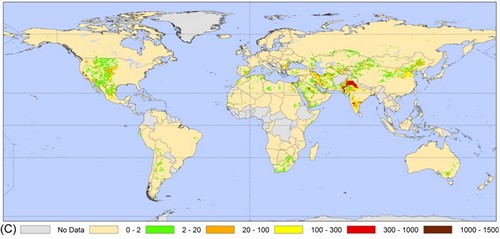
The results show that the areas of greatest groundwater depletion are in India, Pakistan, the United States and China. Therefore, these are areas where food production and water use are unsustainable and eventually serious problems are expected. The hydrologists estimate that from 1960 to 2000 global groundwater abstraction has increased from 312 to 734 km3 per year and groundwater depletion from 126 to 283 km3 per year.

The gravity of the water situation: relative ground resource depletion rates. Note the prominent depletion in the central United States: Steven Mauget of the US Department of Agriculture will discuss a new software tool for agricultural water management in the Ogallala region (Wednesday, 26 January) at the upcoming AMS Annual Meeting.

Not only does the depletion threaten food supplies in the long run, but it also adds to global level rise. The GRL article quantified this effect, showing that a quarter of the sea level rise since 2000 is due to aquifer depletion. Water that would have stayed underground 50 years ago is now used by people and their plants, then evaporated; eventually most of it finds its way back to the oceans.
As Roger Pielke points out in a recent post, there is much to be learned about the effect of this water on climate. Not all water under the surface of  the Earth is a renewable resource. While some aquifers indeed are readily replenished by recent precipitation, others have been (or were) locked away from ground sources for many years, due to geology. These isolated reserves, called “fossil water,” were formed long before humanity and have yet to be adequately inventoried. Some of them, like the Ogallala aquifer, have been tapped for agriculture. Thus fossil water is being returned to the water cycle (hence, climate) after a long absence.
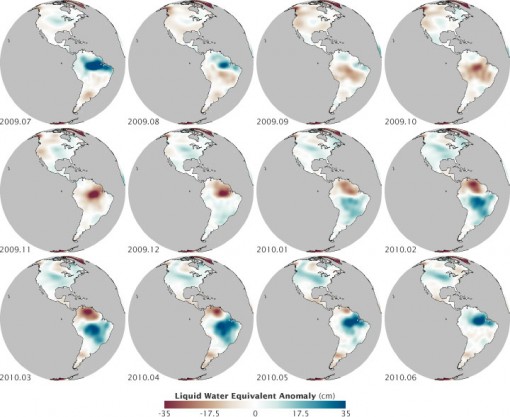
All of this fuss over emptying ground water is a good introduction to the “image of the day” from NASA’s Earth Observatory. Not surprisingly, heavy liquid shifting to and from land has a significant local effect on the gravitational pull of the planet. (Fluctuations of the water table are also hypothesized by some geologists to trigger mid-continental plate earthquakes, but that’s an obscure intersection of geology and meteorology, reviewed in this month’s Bulletin of the Seismological Society of America, to explore in your spare time.) The gravitational effect of water is the basis of water distribution observations from the GRACE (Gravity Recovery and Climate Experiment) mission:

the satellites measured how Earth’s gravity field changed as water piled up or was depleted from different regions at different times of year.

Below is GRACE data from 2009-10 mapped by NASA’s Robert Simmons, showing how the water year giveth (blue) and taketh away (red). (There will be more on watching water resources carefully from space in presentations at the AMS Annual Meeting, including NASA’s David Toll on the NASA Water Resources Program on Tuesday 25 January.)

Air Quality Monitoring Gets Smart

Smartphones continue to get more popular and, well, smarter, making them ideal for large-scale data-gathering projects. The concept is called crowdsourcing, and there are an increasing number of benefits that a large group of people with smartphones and other mobile devices could provide.
Case in point: Researchers at the University of Southern California have created an application for Android phones (an iPhone app is in development) that they hope will enhance air pollution monitoring. The “Visibility” app allows the public to send pictures they take of the sky to a central database, where the pollution levels for the pictures’ locations can be estimated and recorded. 
As long as the picture is predominantly of the sky and taken on a sunny day, the app can compare it to accepted models of the luminance of the sky for that location. This provides an estimate of visibility, which in turn helps in calculating the amount of certain types of aerosols in the atmosphere. With the help of some of the phone’s features–such as its accelerometer, compass, and GPS–the app can calculate the orientation of the camera and the sun and the time the picture was taken and send that information and the actual picture to a computer, which then estimates the pollution level for the area shown in the picture. The application sends this data back to the picture-taker while simultaneously recording it in a database. (A paper on the research is available here.)
More than 250 people downloaded the app in the first three days it was available. The app has already shown promising results in both Phoenix and the Los Angeles basin when the photo-derived observations are compared to air quality data collected by the EPA. With air pollution monitoring currently limited to sparse distribution of monitor stations, the potential exists for this new app and its successors to change the way we monitor the sky.
The app’s developers hope that its popularity continues to increase, which would help them to refine and update its performance. So if you’re reading this on your smartphone, here’s an opportunity to collect some air quality data of your own.