Since 2006, lightning has been the third most common cause of storm-related deaths in the United States, behind only floods and tornadoes. But lightning deaths are trending downward, suggesting that educational efforts on the dangers of lightning, as well as improved warning capabilities, are making a difference. Over the past 30 years, the U.S. has averaged 54 lightning deaths per year. But over the last decade, that number falls to 32 deaths per year, with a record-low of 26 in 2011 and only 28 in 2012. Of course, some of that decline is connected to social trends: early in the twentieth century, when many more people worked outside, lightning deaths in the U.S. numbered in the hundreds per year.
At the Annual Meeting in Austin, the Sixth Conference on the Meteorological Applications of Lightning Data will look at some social factors connected to lightning fatalities, including posters on Monday in Exhibit Hall 3 by Ronald Holle of Holle Meteorology and Photography (summarizing the dangers of lightning to people sheltering near trees) and Andrew Rosenthal of Earth Networks (on the effects of lightning at sporting events). And in the 16th Conference on Aviation, Range, and Aerospace Meteorology, Matthias Steiner of NCAR will explore some of the key issues related to lightning safety at airports (Wednesday, 4:30 p.m., Room 17A).
Along with changes in behavior, education and information are cited as important factors in reducing lightning fatalities, and some of the latest developments in this area will be explored in Austin. NOAA’s new lightning fatality database collects data from media sources, local NWS offices, and local officials to compile information on U.S. lightning deaths–including various demographics and the activity of the victim at the time of the strike–that can help us understand lightning fatality patterns and educate the public on what situations are most dangerous. Private meteorologist William Roeder will present a poster on the new database and its applications to lightning safety education (Exhibit Hall 3).
The conference will explore numerous ways that lightning data can be used to understand related severe weather phenomena. For example, the Geostationary Lightning Mapper (GLM) on the GOES-R spacecraft (scheduled for launch in 2015) will be able to continuously map total lightning activity throughout the day and night, which should prove valuable in forecasting tornadoes, storm intensification, and other severe weather. NOAA’s Steven Goodman will discuss the GLM’s capabilities on Wednesday (8:30 a.m., Ballroom G). In the same session (9:30 a.m., Ballroom G), Daniel Cecil of the University of Alabama will present an algorithm for using proxy GLM data to identify lightning jumps, which are sudden increases in flash rate for a convective cell and therefore can also provide advance warning of severe weather. Another example is the use of the pseudo-Geostationary Lightning Mapper (pGLM) product, which was created for the Hazardous Weather Testbed (HWT) Spring Experiment/Experimental Warning Program. Kristin Calhoun of CIMMS and NOAA will explain how the pGLM used total lightning data to detect VHF radiation from lightning discharges, and subsequently to forecast storm modes (Wednesday, 8:45 a.m., Ballroom G).
This is just a small sampling of lightning-related research to be presented in Austin–a promising sign that continued reductions in lightning tragedies are still possible in the future.
 Matt
Matt
TRMM Keeps on Truckin'
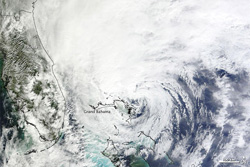
It’s been 15 years since the Tropical Rainfall Measuring Mission (TRMM) satellite was launched. Over that time, TRMM has significantly advanced our understanding of precipitation through measurements of the global distribution of rainfall at Earth’s surface, the global distribution of vertical profiles of precipitation, and other rainfall properties. As a result, TRMM provides clues to the workings of the water cycle and the relationship between oceans, the atmosphere, and land. But the benefits of TRMM extend beyond the research community. The image below exhibits the kind of operational data TRMM can supply: it’s a rainfall analysis of SuperStorm Sandy that reveals the heaviest rainfall totals during the storm (more than 10.2 inches) were over the open waters of the Atlantic Ocean.

Despite its advanced age, TRMM continues to provide unique data; its enduring value is evidenced by the fact that more than 50 presentations at the AMS Annual Meeting in Austin are related in some way to TRMM and its data. A few examples: Yingchun Chen of the University of Melbourne will examine TRMM’s estimates of daily rainfall in tropical cyclones using the Comprehensive Pacific Rainfall Database (PACRAIN) of 24-hour rain gauge observations (Wednesday, 9:30 a.m., Room 10b). A poster presentation by Dana Ostrenga of ADNET Systems and NASA’s Goddard Space Flight Center will review the recently released Version 7 TRMM Multi-satellite Precipitation Analysis (TMPA) products and data services (Monday, Exhibit Hall 3). Zhong Liu of George Mason University will present a poster on the TRMM Composite Climatology, a merger of selected TRMM rainfall products over both land and ocean that provides a “TRMM-best” climatological estimate (Monday, Exhibit Hall 3). In her poster, Hannah Huelsing of the National Weather Center will show how TRMM 3-hourly data were used to look at the spatial and temporal distribution of the Asian premonsoon and monsoon seasons in Pakistan during 2010’s severe flood year (Tuesday, Exhibit Hall 3).
As TRMM matures, it’s also broadening its horizons and crossing disciplines. Earth-observing systems are increasingly being utilized in the field of public health, and in Austin, the Fourth Conference on Environment and Health will include a themed joint session on this budding partnership. In that session, Benjamin Zaitchik of Johns Hopkins University will discuss the modeling of malaria risk in Peru (Monday, 5 p.m., Room 6b). Zaitchik and his colleagues modeled the influence of land cover and hydrometeorological conditions on the distribution of malaria vectors, as well as the relationship among climate, land use, and confirmed malaria case counts at regional health posts. In the study, meteorological and hydrological conditions were simulated with the use of observations from TRMM and other satellites.
Versatile VIIRS: Sandy Reveals More of Its Potential
The VIIRS instrument aboard the new Suomi National Polar-orbiting Partnership (NPP) satellite has a lot of jobs: among them, to measure cloud and aerosol properties, ocean color, sea and land surface temperature, ice motion and temperature, fires, and Earth’s albedo. Now, with the experience of Superstorm Sandy behind it, add tracking power blackouts to the list of tasks for this multifaceted instrument.
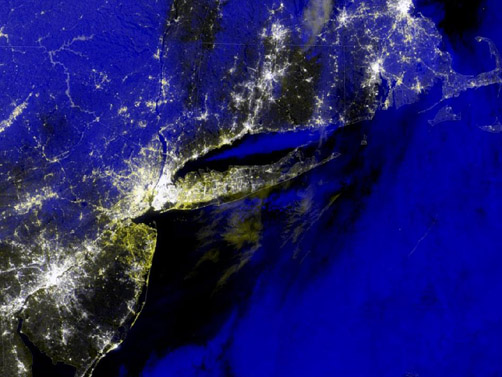
VIIRS–or more formally, Visible Infrared Imager Radiometer Suite, is a scanning radiometer that collects visible and infrared imagery and radiometric measurements of the land, atmosphere, cryosphere, and oceans. Its low-light sensor–known as the day-night band–can detect light from cities and towns in the absence of clouds. This function recently proved to be highly valuable when NASA’s Short-term Prediction Research and Transition Center used data from VIIRS to assist disaster responses agencies (including FEMA and the U.S. Army Corps of Engineers) in identifying areas that lost power during Superstorm Sandy. Composites of VIIRS images taken before and after Sandy (see below for an example) pinpointed the blackouts.
This is just one example of the promising capabilities of VIIRS; and the growing awareness of these capabilities is why VIIRS is the subject of a town hall meeting on Monday, January 7 (12:15-1:15 p.m., Room 18B) at the AMS Annual Meeting in Austin. Forecasters, meteorologists, and other end users will discuss how they are utilizing the new VIIRS datastream and the critical role it can play in weather forecasting and in improving emergency preparedness and disaster response efforts.
A number of other presentations in Austin will highlight the versatility VIIRS. Jeffrey Hawkins of the Naval Research Laboratory will take an in-depth look at VIIRS’s day-night band and efforts to create enhanced products geared toward various nowcasting applications (e.g., dust enhancement observations, smoke and volcanic ash plumes, cloud properties, tropical cyclone structure, etc.) (Wednesday, 1:30 p.m., Ballroom G). Donald Hillger of NOAA/NESDIS will compare and contrast imagery produced by VIIRS with that from other satellites (Tuesday, 11:45 a.m., Ballroom G). And Jim Biard of the Cooperative Institute for Climate and Satellites will provide details on the VIIRS Climate Raw Data Record (C-RDR), including its contents and structure, its production methods and process, and file access (Wednesday, 11:30 a.m., Ballroom G).
VIIRS is one of five instrument/sensor payloads aboard Suomi-NPP, which is the first of a new breed of satellites that will replace NASA’s Earth Observing System satellites. Launched in October of 2011, the progress and promise of Suomi-NPP and its new data applications will be explored at a town hall meeting on Tuesday (12:15-1:15 p.m.; Ballroom G).
Speaking of Superstorm Sandy, electricity outages, and town hall meetings, there are two related Town Halls of special importance Monday night at the AMS meeting: a wide-ranging meeting on the storm itself (7:30-9:30 p.m.; Ballroom E) and an exploration of the impacts of weather on the electrical grid (Monday, 6:30-8:00 p.m.; Room 14). More on this in future posts on The Front Page.
William Gail Wins AMS Presidential Election
The AMS announced this week that William B. Gail is the new AMS president-elect and will take over as the Society’s president in January of 2014.

Gail is cofounder and chief technology officer of Global Weather Corporation (GWC), a Boulder, Colorado, company that provides precision forecasts to businesses serving weather-sensitive sectors, such as wind energy, transportation, and media. He founded GWC to broaden the public benefit from next-generation forecast technologies being created in universities and national labs. Prior to founding GWC, he was a director at Microsoft, where he was responsible for software innovation such as consumer mobile and 3D weather visualization.
Recently, Gail has been a leader in the call for a U.S. Weather Commission, which would utilize the weather expertise of the meteorological community to advise federal policymakers on forecasting and making the country more weather-ready. He contributed to the NAS/NRC report “Weather Services for the Nation: Becoming Second to None,” and he was a member of a panel that recently spoke to Congress about this topic; he can be seen in this video of the panel, beginning at the 13:15 mark. (The U.S. Weather Commission will be the focus of a Town Hall Meeting at the upcoming AMS Annual Meeting in Austin.)
Newly elected AMS Councilors for 2012 were also announced: Stephen F. Corfidi of the Storm Prediction Center, Sonia Kreidenweis of Colorado State University, Frank D. Marks of the Atlantic Oceanographic and Meteorology Laboratories, Yvette P. Richardson of The Pennsylvania State University, and Elizabeth A. Ritchie of the University of Arizona.
Barack, Mitt . . . and Sandy
In the modern era of presidential campaigns, even with candidates’ every last word and action carefully scripted, there can still be surprises. This year, that surprise came in the form of an interloper named Sandy, a blustery blowhard whose campaign stormed up the East Coast and made bombastic statements all along the way, treating red and blue states with equal disrespect. In the process, Sandy emphatically impacted the race for the presidency. First, she forced both President Obama and Mitt Romney to alter their campaigns while she commanded the attention of most of the Atlantic seaboard. They both had to step away from key battleground states, as the president canceled campaign stops in Florida and Wisconsin and Romney called off events in New Hampshire, Iowa, Ohio, and Wisconsin. The negative rhetoric between the two candidates was toned down while both focused their attention on the storm and its victims.
Sandy also caused the cancellation (and subsequent extension) of early-voting days and interrupted training of polling officials in some states, and her impact on voting day may be considerable even though her whirlwind tour is over. One potential effect could be that fewer voters will be able to get to the polls in hard-hit portions of the Northeast and mid-Atlantic, either due to transportation issues, damage to polling venues, power outages, or other hardships. This probably won’t change the election’s outcome, as Obama has a safe lead in most of the affected states. However, his popular vote might be adversely impacted, and thus accentuating the significance of the electoral college. Additionally, polling and media coverage of the campaign has been cut back. Some organizations have temporarily suspended their polling, and with the news media tabbing Sandy as the new “it girl,” the presidential candidates were sent to the fourth estate’s back burner, at least for a few days, as notedby media reporter Howard Kurtz:
Still, the greatest impact may be on public attention. Go to any news website or flip on any cable news channel, and Sandy is the dominant story by far. No one is talking about tax cuts or unemployment or immigration. Television has a tendency to overhype major storms, but given the breadth and destructive power of Sandy, the saturation coverage seems to match its magnitude.
It’s also worth considering what effect Sandy will have on voters’ thoughts about climate and where the two candidates stand on climate change. New York City Mayor Michael Bloomberg cited Sandy in particular and climate change in general in his endorsement of Obama:
The devastation that Hurricane Sandy brought to New York City and much of the Northeast—in lost lives, lost homes and lost business—brought the stakes of Tuesday’s presidential election into sharp relief. . . .
Our climate is changing. And while the increase in extreme weather we have experienced in New York City and around the world may or may not be the result of it, the risk that it might be—given this week’s devastation—should compel all elected leaders to take immediate action. . . .
When I step into the voting booth, I think about the world I want to leave my two daughters, and the values that are required to guide us there. The two parties’ nominees for president offer different visions of where they want to lead America. . . .
One sees climate change as an urgent problem that threatens our planet; one does not. I want our president to place scientific evidence and risk management above electoral politics.
If many other voters share Bloomberg’s perspective that immediate action on climate change is necessary and the President is more likely to take that action, then Barack and Mitt may come to see Sandy as the October surprise that decided the election.
Help Us Get Dressed for Success in Austin
What comes to mind when you think about the AMS? Can you express it with an interesting and eye-catching graphic?
If so, then we have a contest for you: the Society is looking for a member to create an original design for a tee-shirt that represents the mission of the AMS. The winning shirt will be sold at the upcoming Annual Meeting in Austin, and the designer of the chosen shirt will receive free registration to that meeting. And as an added bonus, it’s all for a good cause: proceeds from sales of the shirts will be donated to the AMS Student Travel Grant fund, which helps senior undergraduate and graduate students attend AMS meetings.
The deadline is November 9, so it’s time to start thinking creatively, and then send your idea to [email protected]. The complete rules for the contest can be found here.
These Observations Get Our Stamp of Approval
The scientific benefits of Earth observation are well known in the atmospheric sciences. But there’s an artistic side to such observations, too, which is spectacularly depicted in the U.S. Postal Service’s new Earthscapes stamps, released last week in celebration of National Stamp Collecting Month and featuring images shot aloft from a variety of platforms, from a micro-light kite to satellites in space.
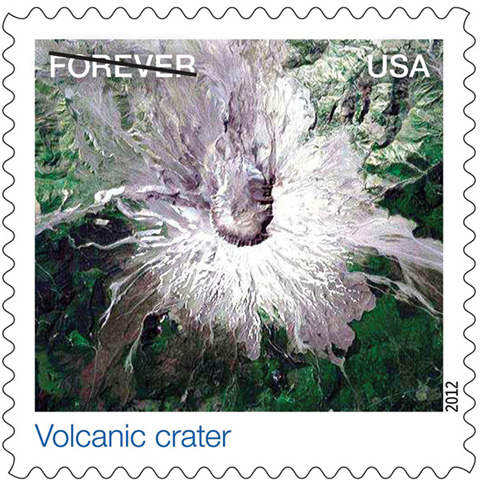
The set of 15 different stamps depicts natural, agricultural, and urban scenes from across the country. The Service’s contracted photo editors and researchers culled hundreds of images, which USPS Art Director Howard Paine narrowed down to the final 15. Some photos were taken by people in private planes and helicopters; others were taken by unmanned instruments, including the one below of the volcanic crater of Mount St. Helens in Washington, which was captured in 1999 by NASA’s Landsat 7. Other images in the set include ice breaking off from Alaska’s Bear Glacier, a cherry orchard in Wisconsin, and a cranberry bog in Massachusetts.
Along with the forever stamps, other Earthscapes collectibles for the philatelist include a first-day cover set, a jigsaw puzzle, and an Earthscapes ceremony program.
A Threat to Antarctic Research
Scientific research in Antarctica is approaching a tipping point of its own, with logistical costs overwhelming the budget, according to a new report written by an independent panel commissioned by the White House. The report recommends fundamental changes to the infrastructure of U.S. scientific facilities in Antarctica; otherwise, according to the report, logistics costs will increase “until they altogether squeeze out funding for science.”
The U.S. Antarctic Program (USAP), which is managed by the National Science Foundation (NSF), supports three year-round stations (McMurdo, Palmer, and Amundsen-Scott South Pole), as well as more than 50 field sites a year that are active during the summer months. The report found numerous infrastructure problems at USAP facilities, including:
a warehouse where some areas are avoided because the forklifts fall through the floor; kitchens with no grease traps; outdoor storage of supplies that can only be found by digging through deep piles of snow; gaps so large under doors that the wind blows snow into the buildings; late 1950s International Geophysical Year-era vehicles; antiquated communications; an almost total absence of modern inventory management systems (including the use of bar codes in many cases); indoor storage inefficiently dispersed in more than 20 buildings at McMurdo Station; some 350,000 pounds (159,000 kilograms) of scrap lumber awaiting return to the U.S. for disposal…
In addition, transportation both to and from Antarctica and on the continent has become increasingly problematic. Despite the recent addition of overland traverse vehicles, delivery of supplies to USAP camps remains costly and inefficient. Meanwhile, the U.S. icebreaker fleet currently consists of just one functioning vessel (and that one doesn’t have the capability to break through thick ice). As a result, the United States has been forced to lease icebreakers from other nations–an expensive and unreliable solution.
“We are convinced that if we don’t do something fairly soon, the science will just disappear,” notes Norm Augustine, former chairman and CEO of Lockheed Martin, who led the review panel. “Everything will be hauling people down and back, and doing nothing.”
Almost 90% of the USAP budget is currently spent on transportation, support personnel, and other logistical matters, leaving few resources for actual scientific research. To rectify that situation, the report recommends decreasing the NSF’s budget for Antarctic research by 6% a year for four years and increasing spending on improving the USAP’s infrastructure and logistics by the same amount over the same period. The short-term result will be a hit to the research currently being conducted in Antarctica, but over the long term the proposal should allow such research to continue to take place there. The report also notes additional savings could be achieved by delivering more supplies to the landlocked Amundsen-Scott base at the South Pole by overland traverse instead of cargo flights, and by reducing support personnel at the three USAP bases by 20%. The report also endorses President Obama’s 2013 budget request for the U.S. Coast Guard to begin designing a new icebreaker.
Ultimately, the review panel’s suggestions are about more than just specific numbers and initiatives. They are about a basic change in the way scientific research is conducted in Antarctica. As the report states:
Overcoming these barriers requires a fundamental shift in the manner in which capital projects and major maintenance are planned, budgeted, and funded. Simply working harder doing the same things that have been done in the past will not produce efficiencies of the magnitude needed in the future; not only must change be introduced into how things are done, but what is being done must also be reexamined.
The full report can be found here.
In Case You Didn't Notice, July Was REALLY Hot
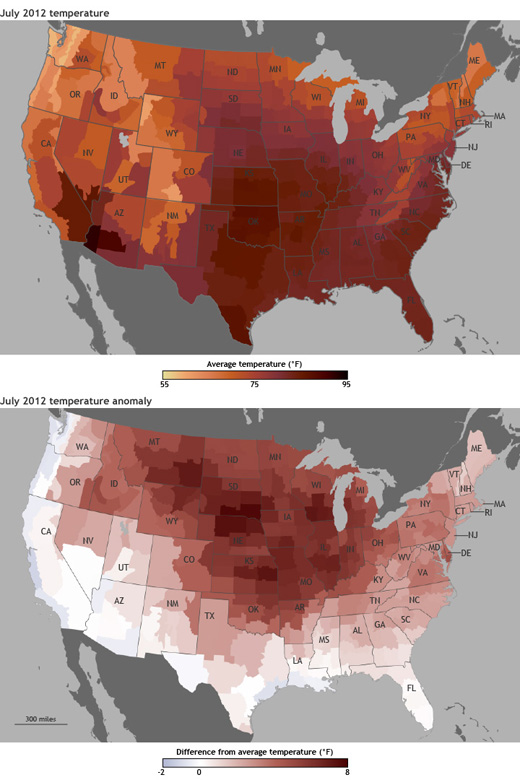
This past July was the hottest month on record in U.S. history, according to NOAA’s National Climatic Data Center. The average temperature throughout the contiguous 48 states was 77.6°F, surpassing the previous mark of 77.4°F set in 1936. The first seven months of 2012 were also the hottest on record in the United States, as was the 12-month period of August 2011-July 2012. (Records go back to 1895.)
Interestingly, only one state–Virginia–experienced its hottest July on record, which goes to show how widespread the heat wave was across the country. Thirty-two states had one of their top-10 hottest Julys of all time this year, with seven states recording their second-hottest ever. July temperatures were 3.3°F warmer than the U.S. twentieth-century average for the month, with particularly intense heat in the Plains, the Midwest, and along the Eastern Seaboard.
The five hottest individual months in U.S. history have all been Julys: 2012, 1936, 2006, 2011, and 1934.
In addition to the historic heat, the U.S. Climate Extremes Index, which NOAA uses to calculate temperature anomalies, severe drought, downpours, tropical storms, and hurricanes, was a record-high 37% in July; the previous maximum occurred last July. And the index for the first seven months of the year was 46%, breaking a 78-year-old record. The average index is 20%.
.”]
Climate and Weather Extremes: Asking the Right Questions
The still-developing field of attribution science examines specific weather events and short-term atmospheric patterns in a broader, longer-term climate context. In such research, communication is key; it’s vital to understand exactly what questions are being asked. A case in point is an article in the July issue of BAMS. “Explaining Extreme Events of 2011 from a Climate Perspective” gives long-term context to some of the significant weather events of 2011 featured in the new State of the Climate, which is also part of the July BAMS.
The authors write:
One important aspect we hope to help promote …is a focus on the questions being asked in attribution studies. Often there is a perception that some scientists have concluded that a particular weather or climate event was due to climate change whereas other scientists disagree. This can, at times, be due to confusion over exactly what is being attributed. For example, whereas Dole et al. (2011) reported that the 2010 Russian heatwave was largely natural in origin, Rahmstorf and Coumou (2011) concluded it was largely anthropogenic. In fact, the different conclusions largely reflect the different questions being asked, the focus on the magnitude of the heatwave by Dole et al. (2011) and on its probability by Rahmstorf and Coumou (2011), as has been demonstrated by Otto et al. (2012). This can be particularly confusing when communicated to the public.
So the new attribution paper in BAMS strives to answer a very specific questions–a series of them, as it turns out, since the paper is actually a collection of a number of studies by different teams, representing several of the cutting-edge approaches to researching attribution in rapid response to the extreme weather. Most of the authors, but not all, seek to answer questions about how global climate change changes odds that extreme events might occur.
Last week, NOAA held a briefing to discuss both the State of the Climate and the new BAMS article. Two coauthors of the article, Tom Peterson of NOAA’s National Climatic Data Center and Peter Stott of the Met Office Hadley Centre, discussed the answers they found. They noted that in some cases, such as the rainfall that caused flooding in Thailand, there was no connection between human activities and the extreme weather. But other events exhibited a clear human influence that increased the possibility of that event occurring. One example is the prolonged heat wave in Mexico and the southwestern United States, which was the region’s hottest and driest growing season on record by a significant margin. The steamy temperatures were connected to the La Niña that was prominent last year, and the study found that such a heat wave is 20 times more likely in La Niña years today than it was in 1960. As the coauthors noted in the briefing, the answer might be completely different in years without a La Niña , pointing out the importance of context–and understanding the questions being asked–in this study.
The State of the Climate itself documents the weather extremes of the recent past and give them context in the historical record. The 282-page peer-reviewed report, compiled by 378 scientists from 48 countries around the world, also provides a detailed update on global climate indicators and other data collected by environmental monitoring stations and instruments on land and ice, at sea, and in the sky. It used 43 climate indicators to track and identify changes and overall trends to the global climate system. These indicators include greenhouse gas concentrations, temperature of the lower and upper atmosphere, cloud cover, sea surface temperature, sea level rise, ocean salinity, sea ice extent, and snow cover. Each indicator includes thousands of measurements from multiple independent datasets.
Among the highlights of this year’s SOC:
- Warm temperature trends continue: Four independent datasets show 2011 among the 15 warmest since records began in the late nineteenth century, with annually-averaged temperatures above the 1981–2010 average, but coolest on record since 2008. The Arctic continued to warm at about twice the rate compared with lower latitudes. On the opposite end of the planet, the South Pole recorded its all-time highest temperature of 9.9°F on December 25, breaking the previous record by more than 2 degrees.
- Greenhouse gases climb: Major greenhouse gas concentrations, including carbon dioxide, methane, and nitrous oxide, continued to rise. Carbon dioxide steadily increased in 2011 and the yearly global average exceeded 390 parts per million (ppm) for the first time since instrumental records began. This represents an increase of 2.10 ppm compared with the previous year. There is no evidence that natural emissions of methane in the Arctic have increased significantly during the last decade.
- Arctic sea ice extent decreases: Arctic sea ice extent was below average for all of 2011 and has been since June 2001, a span of 127 consecutive months through December 2011. Both the maximum ice extent (5.65 million square miles on March 7, 2011) and minimum extent (1.67 million square miles, September 9, 2011) were the second smallest of the satellite era.
- Ozone levels in Arctic drop: In the upper atmosphere, temperatures in the tropical stratosphere were higher than average while temperatures in the polar stratosphere were lower than average during the early 2011 winter months. This led to the lowest ozone concentrations in the lower Arctic stratosphere since records began in 1979 with more than 80 percent of the ozone between 11 and 12 miles altitude destroyed by late March, increasing UV radiation levels at the surface.
- Sea surface temperature and ocean heat content rise: Even with La Niña conditions occurring during most of the year, the 2011 global sea surface temperature was among the 12 highest years on record. Ocean heat content, measured from the surface to 2,300 feet deep, continued to rise since records began in 1993 and was record high.
- Ocean salinity trends continue: Continuing a trend that began in 2004, and similar to 2010, oceans were saltier than average in areas of high evaporation, including the western and central tropical Pacific, and fresher than average in areas of high precipitation, including the eastern tropical South Pacific, suggesting that precipitation is increasing in already rainy areas and evaporation is intensifying in drier locations.
The report also provides details on a number of extreme events experienced all over the globe, including the worst flooding in Thailand in almost 70 years, drought and deadly tornado outbreaks in the United States, devastating flooding in Brazil and the worst summer heat wave in central and southern Europe since 2003.