The best-selling title in the AMS bookstore is The AMS Weather Book: The Ultimate Guide to America’s Weather, by Jack Williams. Its detailed, full-color illustrations display the unique style that Williams developed during his time at USA Today, the newspaper that perfected the art of the infographic, and those images have proven to be so popular that the AMS has released a CD exclusively featuring them. The Weather, Illustrated: Graphics from The AMS Weather Book (available to order here) features more than 100 of the book’s figures, covering a range of atmospheric phenomena including jet streams, polar air masses,wet and dry microbursts, gravity waves, and Earth’s energy budget. There are also graphics about other aspects of meteorology, such as instrumentation and forecasting. By presenting meteorological concepts with images that are both accessible and stylish, the CD can be a valuable educational tool whether utilized in tandem with the book or on its own.

 Matt
Matt
The Silver Lining of Disaster
There aren’t many reasons to consider a volcanic eruption a positive event, but if results from recent research by Amato Evan of the University of Virginia are confirmed, residents of hurricane-prone areas, at least, may have a new reason to welcome volcanoes. Evan studied the effects of two major volcanic events–the 1982 discharge of El Chichón and Mount Pinatubo’s eruption in 1991–on Atlantic hurricane activity. He found that hurricane frequency and intensity both decreased by about 50% in the year following the eruptions, as compared to the year preceding the eruptions. Smaller decreases were still detected two and three years after the eruptions.
The finding is not entirely surprising. Major volcanic eruptions can expel large amounts of sulfur dioxide into the stratosphere; the gas then reacts with water to form sulfuric acid aerosols, which reflect light and absorb radiation, cooling tropical ocean waters while warming the lower stratosphere. The combination of these changes would be expected to dampen the frequency, duration, and power of hurricanes, which thrive on the temperature contrast between the sea surface and the atmosphere high above.
Evan’s study (subscription only) runs into complications that will need to be addressed before the volcano-hurricane link is accepted. For instance, both the El Chichón and Mount Pinatubo eruptions were also followed by strong El Niño events, which by themselves are expected to suppress hurricane activity. (On the other hand, some research suggests that El Niños can be caused by volcanic eruptions.) Further study of the dynamics in play is necessary.
Convincing people on the coasts that hurricanes themselves are a positive force in their lives may be a bit more difficult. At the annual Governor’s Hurricane Conference in Florida last week, however, attendees looked back at the 20-year legacy of 1992’s Hurricane Andrew with mixed feelings. While it is still the costliest disaster in the state’s history, the storm brought about many significant positive changes. For one, the state government revised emergency management funding so that each county could have a full-time emergency manager on staff. The institutionalization of emergency plans and outreach to residents has paid off repeatedly in subsequent hurricanes. Hurricane Andrew also led to stiffer enforcement of building codes and rethinking of the ways buildings must withstand high winds.
All in all, the silver lining of disaster isn’t great consolation, but the conference, like Evan’s research, gives hope for continued improvement in hurricane forecasting, preparedness, and response.
Cracks in the Ice
Floating ice shelves off the western coast of Antarctica are breaking up at their margins, causing them to disengage from the bay walls where they attach to the coastline and retreat inland. This could cause the fracturing ice to be less capable of preventing grounded upstream ice from sliding into the sea. After studying Landsat satellite data taken of the Amundsen Sea Embayment taken from 1972 to 2011, researchers at the University of Texas examined found extensive changes in the ice shelves over time, including significant fracturing of the margins that bound the shelves. The Embayment is a huge hunk of ice that comprises one-third of the West Antarctic Ice Sheet.
“As a glacier goes afloat, becoming an ice shelf, its flow is resisted partly by the margins, which are the bay walls or the seams where two glaciers merge,” says Ginny Catania, a professor at the University of Texas and coauthor of the study, which was published in the Journal of Glaciology. “An accelerating glacier can tear away from its margins, creating rifts that negate the margins’ resistance to ice flow and causing additional acceleration.”
The video below shows a repeating cycle of the coastline (red line) moving seaward (to the left) and then turning around and moving inland as large ice masses break off. Simultaneously, the northern shear margin breaks up and retreats, thus creating the possibility of an increase of inland ice flow to the sea.
New Warnings, New Words
National Weather Service offices in Missouri and Kansas recently initiated an experiment testing new tornado warnings that combine more specific information with more descriptive language than have been used in the past to describe the potential effects of storms. The experiment is called “Impact Based Warning,” and is meant to bluntly tell residents in the path of tornadoes what could result if they don’t seek shelter. By using phrases such as “complete destruction” and “unsurvivable if shelter not sought below ground,” the NWS is hoping to “better convey the threat and elevate the warning over a more typical warning,” according to Dan Hawblitzel of the Pleasant Hill, Missouri NWS office.
The new alerts got their first big test last weekend when more than 100 twisters were reported in Kansas, Oklahoma, Nebraska, and Iowa. While the NWS’s Storm Prediction Center issued a warning of possible life-threatening storms in several midwestern states days before they touched down, in Kansas the words used in the new alerts were particularly trenchant: “You could be killed if not underground or in a tornado shelter. Many well-built homes and businesses will be completely swept from their foundations.” And the warnings seem to have worked. Despite the large number of storms, only six people were killed—all in an overnight tornado that hit Woodward, Oklahoma. In Wichita, Kansas, a twister tore through a mobile-home park during nighttime hours, but there were no fatalities.
The Impact Based Warning experiment was developed by the NWS in consultation with social scientists. Along with the new vernacular, it includes some key additions to regular tornado warnings, including information that identifies the hazard (hail, winds, tornado, etc.), indicates whether the hazard has been spotted by radar or by people on the ground, and describes potential effects of the hazard (loss of life, damage to trees or buildings, etc.). The warnings can be used not only for tornadoes, but also to signify life- or property-threatening thunderstorms. The experiment is scheduled to run through the end of November, at which point it will be evaluated and considered for more widespread use.
The initiative comes 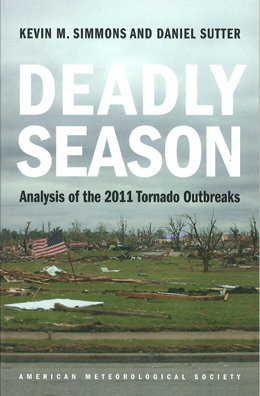 just one year after tornadoes killed more than 500 people in the United States—the deadliest season in almost 60 years. The 2011 year in tornadoes is examined in the new AMS book, Deadly Season: Analysis of the 2011 Tornado Outbreaks, by Kevin M. Simmons and Daniel Sutter. The book is a follow-up to the authors’ Economic and Societal Impacts of Tornadoes, published by AMS in 2011. The new title looks at possible factors contributing to the outcomes of 2011 tornado outbreaks, including assessments of Doppler radar, storm warning systems. and early recovery efforts. Both books can be purchased here.
Solar Storms Are Noisy
A doctoral student at the University of Michigan has created a sonic representation of the intense solar storm that erupted in early March. Robert Alexander gathered 90 hours of raw data from two NASA spacecraft–the MESSENGER and the Solar and Heliospheric Observatory. Through isomorphic mapping, he applied that data to an audio waveform. The resulting sound lasted only a fraction of a second, so Alexander used algorithms to extend the playback length. The final soundtrack portrays a cacophony of solar particles emitted by the storm as they slammed into the spacecraft. Listen for yourself in the clip below.
Upping the Ante on Modeling Climate Change Impacts
There is a growing urgency to produce global projections of how a warming climate could affect life on Earth.
“Impact research is lagging behind physical climate sciences,” says Pavel Kabat, director of the International Institute for Applied Systems Analysis (IIASA) in Austria. “Impact models have never been global, and their output is often sketchy. It is a matter of responsibility to society that we do better.”
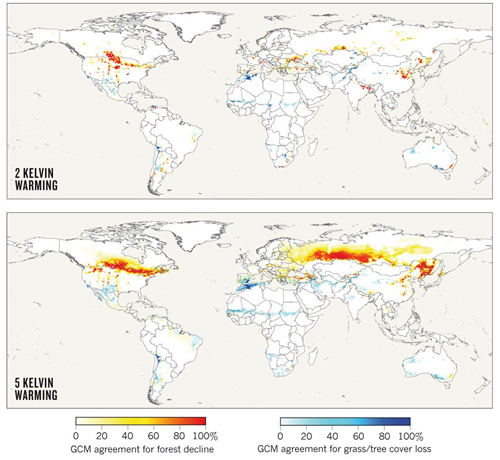
Time is running out for researchers hoping to contribute impact simulations to the IPCC’s Fifth Assessment Report (scheduled for publication in 2014). So last month, the IIASA and the Potsdam Institute for Climate Impact Research (PIK) started a project to compare climate-impact models collected from more than two dozen research groups in eight countries. The Inter-Sectoral Impact Model Intercomparison Project (ISI-MIP) will integrate climate data from state-of-the-art models, using a range of greenhouse-gas emission scenarios (models used in the project can be found here). Because the various emissions scenarios result in a range of projected global temperature increases, potential impacts also can vary widely across a range of scenarios. It is hoped that the project will clarify systematic biases that can cause models to produce disparate results.
The models will investigate the effects of climate change on global agriculture, water supplies, vegetation, and health. Results are due by July 1, and reports on each of the four impact areas are scheduled to be completed by January of 2013. This means the data could be available for the IPCC’s next report–which “will make a real difference for the assessment process,” notes Chris Field of the Carnegie Institution for Science, cochair of IPCC Working Group II. “I greatly appreciate the initiative required to get this activity underway, and I appreciate the commitment to fast-track components that will yield results in time for inclusion in the IPCC Fifth Assessment Report.”
The ISI-MIP is scheduled to continue into 2013 and could be expanded to analyze climatic impacts on transport and energy infrastructures.
The Zones They Are a-Changin'
The United States Department of Agriculture recently released a map of U.S. planting zones to help gardeners across the country determine what they can and can’t grow. It’s the first new map since 1990, and the changes from the previous map reflect climate variability and change over the last 22 years.
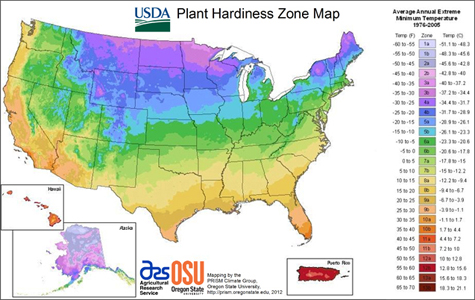
The new map is based on average annual extreme minimum temperatures from 1976 to 2005, whereas the previous map used data from the years 1974-1986. Average temperatures throughout the U.S. were about two-thirds of a degree (F) higher in the more recent time span then they were from 1974 to 1986. As a result, the zones have shifted, and many locations around the country are now in warmer zones than they were on the previous map. Some states, such as Ohio, Texas, and Nebraska, have almost completely migrated to a warmer zone. Of the 34 cities highlighted in the 1990 map, 18 are in warmer zones in the updated version of the map. In general, much of the U.S. is about one-half zone warmer in the new map than in the 1990 edition.
The 2012 version of the planting zones map is the first that is GIS-based. Additionally, a new algorithm used for the 2012 edition enabled more accurate interpolation between weather reporting stations, and the new map also accounts for factors such as elevation changes and proximity to bodies of water, which led to more accurate mapping of the zones. Data used to create the map came from a total of 7,983 stations in the U.S., Canada, and Mexico, including stations of the National Weather Service, the Natural Resources Conservation Service, the Forest Service, the Bureau of Reclamation, the Bureau of Land Management, Environment Canada, and the Global Historical Climate Network.
An in-depth overview of the new map was published in February’s Journal of Applied Meteorology and Climatology. An interactive version of the map and more features can be found here.
Some Good Choices for Your Bookshelf
The Atmospheric Science Librarians International (ASLI) announced their ASLI’s Choice Award winners for 2011 on Wednesday afternoon in the exhibit hall. The awards, now in their seventh year, are presented for the best book of the year in the fields of meteorology/climatology/atmospheric sciences and are judged in the following categories:
- uniqueness
- comprehensiveness
- usefulness
- quality
- authoritativeness
- organization
- illustrations/diagrams
- competition
- references
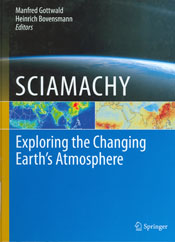
In keeping with the Annual Meeting’s technology theme, the winning book in the science category was SCIAMACHY: Exploring the Changing Earth’s Atmosphere, edited by Manfred Gottwald and Heinrich Bovensmann, published by Springer. ASLI noted the book provided a “comprehensive summary of the milestone SCIAMACHY mission from its initial conception to most recent results.”
There were two honorable mentions in the science category: The Global Cryosphere: Past, Present and Future, by Roger G. Barry and Thian Yew Gan, published by Cambridge University Press, awarded for “the depth and breadth of its coverage of the major aspects of the cryosphere”; and Physics and Chemistry of Clouds, by Dennis Lamb and Johannes Verlinde, published by Cambridge University Press, for “its data-rich, yet readable exploration of clouds across a range of scales.” 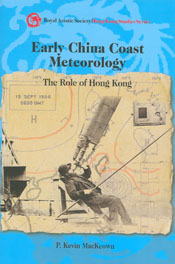
Awards were also given in the history category. The winner was Early China Coast Meteorology: The Role of Hong Kong, by P. Kevin MacKeown, published by Hong Kong University Press, which ASLI lauded for “its account of the scientists and science that comprise the history and accomplishments of the Hong Kong Observatory.” Honorable mention in the history category went to The Warming Papers: The Scientific Foundation for the Climate Change Forecast, edited by David Archer and Ray Pierrehumbert, published by Wiley-Blackwell, awarded “for a compendium of the key scientific papers that undergird the global warming forecast.”
Congrats to all the winners, and it’s never too early to start thinking about next year’s meeting: If you read a good book published this year, you can nominate it for the 2012 award at this page.
Learning to Live with Floods
We all know floods are not friendly. But the NWS and the nonprofit environmental organization Nurture Nature Center (NNC) are taking a new approach to flood education by accepting they are a part of nature that at times cannot be avoided, but can certainly be mitigated. This week’s 21st Symposium on Education will include a poster on the NNC/NWS partnership.
After a series of severe flood events in the Delaware River Valley, the NNC started “Floods Happen. Lessen the Loss,” an education program that emphasizes adaptation over prevention, acceptance over angst, and most importantly, education over ignorance. The program not only provides resources (including interviews with flood experts) and tools, but it also explores the deeper issues of how flooding affects communities and how those communities can live with and adapt to floods. This community-based approach to flood preparation is captured in this animated short film created by the NNC.
One of the key themes of the program is helping communities and individuals learn how to help themselves and then take the initiative to do so. For example, a new NWS flood warning system using Push technology sends out alerts to individuals’ e-mail addresses, internet browsers, and some cell phones . . . but only if the individual takes action and signs up for the alerts. (This link provides a how-to for signing up.) In this video, the NNC’s Rachel Hogan Carr explains how the program addressed another problem–the semantics of the term “100-year floodplain”:
The commonly used, but misleading concept, is the 100-year flood, which leads people to believe falsely that major flooding will occur only every hundred years on average. The truth is that even smaller storms can produce tremendous damage. In many areas along the Delaware River, the flooding in 2004, ’05, and ’06 was much smaller than a 100-year flood, but the damage was nonetheless extensive. And that’s just one problem with the term. The other is that many areas well outside the hundred-year floodplain are liable to flooding, too. In fact, nearly 30% of national flood insurance claims come from outside the 100-year floodplain, often in places where people thought they were safe. That’s why Nurture Nature has started using the terms high, moderate, and low risk to describe various regions of the floodplain.
The NWS/NNC collaboration now has a second initiative: the placement of NOAA’s Science on a Sphere at the NNC’s flood museum, and the creation of the first Science on a Sphere flood-related program, which will explain how climatic and oceanic changes are contributing to the increasing frequency and severity of floods throughout the world.