Improving Tropical Cyclone Forecasts

Tropical cyclones are usually associated with bad news, but a long-term study about these storms now posted online for publication in BAMS has some good news–about the forecasts, at least. The authors, a Japanese group lead by Munehiko Yamaguchi, studied operational global numerical model forecasts of tropical cyclones since 1991.
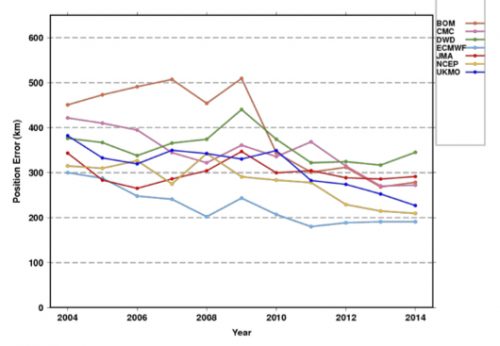
Their finding: the model forecasts of storm positions have improved in the last 25 years. In the Western North Pacific, for example, lead time is two-and-a-half days better. Across the globe, errors in 1 – 5 day forecasts dipped by 6 to 14.5 km, depending on the basin.
Here are the improvements for the globe as a whole. Each line is a different modeling center:
CycloneForecastsGlobal
While position forecasts with a single model are getting better (not so much with intensity forecasts), it seems natural that the use of a consensus of the best models could improve results even more. But Yamaguchi et al. say that’s not true in every ocean basin. The result is not enhanced in the Southern Indian Ocean, for example. The authors explain:

This would be due to the fact that the difference of the position errors of the best three NWP centers is large rather than comparable with each other and thus limits the impact of a consensus approach.

The authors point towards ways to improve tropical cyclone track forecasts, because not all storms behave the same:

while the mean error is decreasing, there still exist many cases in which the errors are extremely large. In other words, there is still a potential to further reduce the annual average TC position errors by reducing the number of such large-error cases.

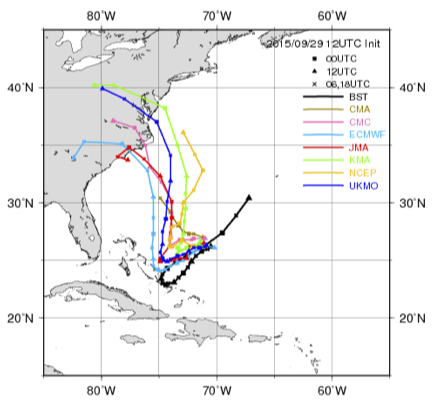
For example, take 5-day track forecasts for Hurricane Joaquin in 2015. Hard to find a useful consensus here (the black line is the eventual track):
JoaquinForecast
Yamaguchi et al. note that these are types of situations that warrant more study, and might yield the next leaps in improvement. They note that the range of forecast possibilities now mapped as a “cone of uncertainty” could be improved by adapting to specific situations:

For straight tracks, 90% of the cyclonic disturbances would lie within the cone, but only 39% of the recurving or looping tracks would be within the cone. Thus a situation-dependent track forecast confidence display would be clearly more appropriate.

Check out the article for more of Yamaguchi et al.’s global perspective on how tropical cyclone forecasts have improved, and could continue to improve.

Whose Flood Is It, Anyway?

When water-laden air lifts up the eastern slope of the Rockies, enormous thunderstorms and catastrophic flooding can develop. Americans may remember well the sudden, deadly inundation of Boulder, Colorado, in September 2013. For Canadians, however, the big flood that year was in Alberta.
Four years ago this week, 19-23 June 2013, a channel of moist air jetted westward up the Rockies and dumped a foot of rain on parts of Alberta, Canada. The rains eventually spread from thunderstorms along the slopes to a broader stratiform shield. Five people died and 100,000 fled their homes, many in Calgary. At more than $5 billion damage, it was the costliest natural disaster in Canadian history until last year’s Fort McMurray fire.
While we might call it a Canadian disaster, the flood had equally American origins. A new paper in early on-line release for the Journal of Hydrometeorology shows why.
The authors—Yangping Li of the University of Saskatchewan and a team of others from Canadian institutions—focused mostly on how well such mountain storms can be simulated in forecast modeling. But they also traced the origins of the rain water. Local snowmelt and evaporation played a “minor role,” they found. “Overall, the recycling of evaporated water from the U.S. Great Plains and Midwest was the primary source of moisture.”
Here is what the distribution of sources looked like. The colors show net moisture uptake from 6 hours to 7 days before the storm:
floodwater2
Some of the water came from as far east as the Great Lakes, and more than half from the United States. While storms along the eastern slopes of the Rockies often get Gulf of Mexico moisture, in this case, Gulf air had already dumped its moisture on the U.S. Plains. In other words, the soaked Plains merely recycled Gulf moisture back into the air to be carried into Canada.
American floods, Canadian floods, and any combination thereof—Li et al. remind us of the cross-border interdependence of weather, water, and climate … a relationship not just for this week but for the future:

The conditions of surface water availability (e.g. droughts) or agricultural activities over the US Great Plains could exert indirect but potentially significant effects on the development of flood-producing rainfall events over southern Alberta. Future land use changes over the US Great Plains together with climate change could potentially influence these extreme events over the Canadian Prairies.

For more perspectives on this noteworthy flood, take a look at another new paper in early online release–Milrad et al. in Monthly Weather Review–or at the companion papers to the Journal of Hydrometeorology paper: Kochtubajda et al. (2016) and Liu et al. (2016) in Hydrological Processes.

Atlantic Hurricane Season Begins

2017 Atlantic hurricane season names
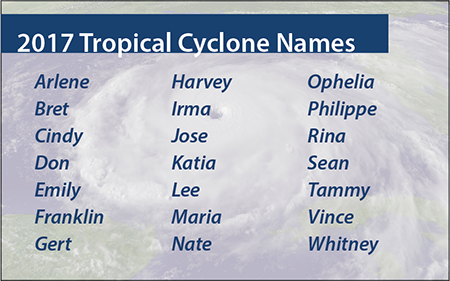
The 2017 Atlantic hurricane season has begun. If they haven’t already, people who could be affected by tropical storms and hurricanes should prepare now for the six-month season, which ends November 30 and encompasses the Atlantic Ocean, Caribbean Sea, and Gulf of Mexico.
Here’s what you need to know. Follow the links for more detailed information:
What’s New
Two new products this year will be issued by the National Hurricane Center in addition to the typical tropical storm and hurricane watches, warnings, and advisories:

  • Storm surge watches & warnings
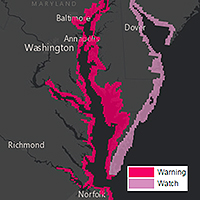
Storm surge watches will be issued within 48 hours of possible life-threatening coastal inundation. Storm surge warnings will be issued at least 36 hours before the danger of life-threatening coastal inundation is realized. The new graphical products will be issued in tandem with NHC’s Potential Storm Surge Flooding Map, which quantifies the expected inundation from storm surge and indicates the depth of the flooding on land.
  • Potential tropical storms and hurricanes growing out of disturbances that have not yet become tropical depressions or storms but that pose the threat of bringing tropical storm or hurricane conditions to land areas in 48 hours will be treated as regular storms, with NHC issuing watches, warnings, advisories, and related graphical products as needed.
  • Arrival of tropical storm winds
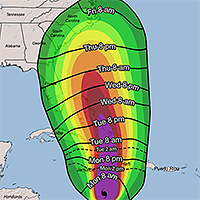
Additionally, NHC will introduce a map to provide guidance on when users should have their preparations completed before a storm. These experimental graphics will show Time of Arrival of Tropical-Storm-Force Winds—a critical planning threshold for coastal communities. Many preparations become difficult or dangerous once tropical storm conditions begin.

Prepare
People living in states bordering the Atlantic Ocean and Gulf of Mexico, as well as in The Bahamas, Bermuda, and Caribbean islands, should know that water could be a life-threatening hazard when a hurricane hits. This threat includes storm surge—the sudden rise of seawater at the coast near and to the right of where a hurricane’s center makes landfall. In the United States, hurricane evacuation maps account for the flooding from storm surge and show areas along the coast that people should evacuate if a hurricane threatens. Or it could be from freshwater flooding triggered by a storm’s torrential rain. If either is a risk, make a plan now to leave when threatened.
If water is not a risk, and your area will only face the threat of strong, damaging winds, the official recommendation from the National Hurricane Center is to shelter in place. Meaning, stay put—rather than evacuate. But stay only if your residence is sufficient to weather the storm. Now is the time to prepare your home and property for the possibility of high winds and heavy rain.
Forecasts
A wide variety of academics, private forecasting companies, and the U.S. government issue seasonal hurricane predictions. They generally tend to agree, particularly when a season is expected to be well above or below average. But this year could be a bit different with some predicting fewer tropical storms and hurricanes than is typical in an average year, and others predicting more than the usual numbers of storms and hurricanes. An average Atlantic hurricane season sees a dozen named storms, with a half-dozen of these becoming hurricanes and two going on to become major hurricanes with sustained winds greater than 110 mph.
A quick look at the five longest-running seasonal forecasts for named storms, hurricanes, and major hurricanes, respectively:

The reason for the low numbers in those forecasts with ranges: there’s uncertainty about whether another El Niño may form midway though the season—El Niño is an anomalous warming of the eastern tropical Pacific that causes air to rise and spread out there, creating wind shear over the Atlantic that inhibits tropical development—as well as whether warmer-than-usual sea surface temperatures in the tropical Atlantic favorable for development will remain that way or cool through the season. Increasing numbers in several forecasts updated since earlier in the spring seem to indicate a lower likelihood of both, although forecasters caution they could reduce the numbers if more than a weak El Niño develops and Atlantic SSTs consequently cool.
Bottom Line
Nearly every weather entity states what Acting FEMA Administrator Robert J. Fenton, Jr. recently expressed after NOAA released its hurricane season forecast last week: “Regardless of how many storms develop this year, it only takes one to disrupt our lives.”
The advice of hurricane forecasters and emergency managers alike is to prepare early and as if this will be the year your neighborhood is hit.
Storm Names
If this year’s list of names the National Hurricane Center will use to keep track of Atlantic storms seems familiar, it’s because it is. NHC made it all the way through this list in the 2005 season. The names of five memorable and deadly hurricanes that year were retired: Dennis, Katrina, Rita, Stan, and Wilma. The updated list was used again in 2011, since NHC rotates through six sets of names, and Irene that year also was retired and replaced.

When Art Is a Matter of (Scientific) Interpretation

We’ve seen plenty of examples of scientists inspiring art at AMS conferences. It is also true that art can inspire scientists, as in the kick-off press conference at this week’s European Geophysical Union General Assembly in Vienna, Austria.
The_ScreamA team of scientists came forward with a new hypothesis about the origins of one of the icons of Western art–Edvard Munch’s The Scream. Since 1892, the man melting down on a bridge under a wavy, blood-red Oslo sunset has been a pillar of the modern age precisely because it expresses interior mentality more than objective observation. Or so art history tells us.
To be fair, some art historians also have made clear that there are honest clouds in Munch’s painting. In a 1973 monograph, the University of Chicago’s Reinhold Heller acknowledged Munch’s “faithfulness to meteorological and topographical phenomena” in a precursor canvas, called Despair. Even so, Heller went on to say that Munch’s vision conveyed “truthfulness solely in its reflection of the man’s mood.”
Take a Khan Academy course on the history of art and you’ll learn that Munch was experiencing synesthesia—“a visual depiction of sound and emotion….The Scream is a work of remembered sensation rather than perceived reality.”
Leave it to physical scientists, then, to remind us that nature, as an inspiration for artists, is far stranger than art historians imagine. Indeed, faced with The Scream, scientists have been acting just like scientists: iterating through hypotheses about what the painting really shows.
In a 2004 article in Sky and Telescope magazine, Russell Doescher, Donald Olson, and Marilynn Olson argued that Munch’s vision was inspired by sunsets inked red after the eruption of Krakatau in 1882.
More recently, atmospheric scientists have debunked the volcanic hypothesis and posited alternatives centered on specific clouds. In his 2014 book on the meteorological history of art, The Soul of All Scenery, Stanley David Gedzelman points out that the mountains around Oslo could induce sinuous, icy wave clouds with lingering tint after sunset. The result would be brilliant undulations very much like those in the painting.
At EGU this week, Svein Fikke, Jón Egill Kristjánsson, and Øyvind Nordli contend that Munch was depicting much rarer phenomenon: nacreous, or “mother of pearl,” clouds in the lower stratosphere. They make their case not only at the conference this week, but also in an article just published in the U.K. Royal Meteorological Society’s magazine, Weather.
Munch never revealed exactly when he saw the sunset that startled him. As a result, neither cloud hypothesis is going to be confirmed definitively.
Indeed, to a certain extent, both cloud hypotheses rest instead on a matter of interpretation about the timing of the painting amongst Munch’s works, about his diary, and other eyewitness accounts.
The meteorology, in turn, is pretty clear: The Scream can no longer be seen as solely a matter of artistic interpretation.
 

Field Tests for the New GOES-16

“Who ever gets tired of looking at this thing?” asked Steve Goodman of an appreciative audience when he presented a slide of the new imagery from GOES-16 at the 97th AMS Annual Meeting this January.
abi_full_disk_low_res_jan_15_2017
The answer was clearly, “Nobody.”
The images from GOES-16 have been dazzling, but the hard work of maximizing use of the satellite is ongoing, especially for Goodman’s agency, the National Environmental Satellite, Data, and Information Service (NESDIS).
The successful launch in November was a major step for the weather community. Compared to the older geostationary satellites, the new technology aboard GOES-16 offers a huge boost in the information influx: 3x improvements in spectral observing, a 4x spatial resolution advantage, and 5x temporal sampling upgrades. But new capabilities mean new questions to ask and tests to perform.
The satellite is barely up in space and already NOAA is targeting its performance for a major scientific study. Last week was the official start of a three-month study by NESDIS to “fine-tune” the data flowing from our new eye in space.
You can learn more about the GOES-16 Field Campaign in the presentation that Goodman gave at the Annual Meeting. He pointed out that it has been 22 years since the imager was updated, and that the satellite also includes the Global Lightning Mapper (GLM), which is completely new to space.
“We thought it would be good, getting out of the gate, to collect the best validation data that we can,” Goodman said.
er2
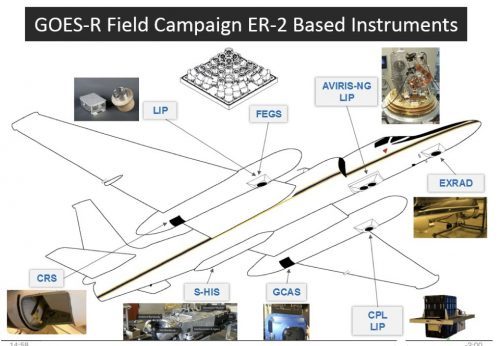
Over a period of 6 weeks, the NASA ER-2 high-altitude jet will fly 100 hours in support of the studies. The flights will be based first from California and then in Georgia, well-timed to coordinate with the tornado field campaign, VORTEX-SE. All the while, the airplane’s downward-looking sensors need to be aimed to match the angle of observation of the satellite-borne sensors. The ER-2 will fly its specially built optical simulator that mimics the GLM.
“That’ll give us optical to optical comparisons,” Goodman noted.
To further check out GLM’s performance, there will also be underpasses from the International Space Station, which now has a TRMM-style lightning detector of its own. “That’s a well-calibrated instrument—we know its performance,” Goodman added.
Meanwhile lower-orbit satellites will gather data from “coincident overpasses” to coordinate with the planes, drones, and ground-based observing systems.
Such field campaigns are a routine follow-up to satellite launches. “Field campaigns are essential for collecting the reference data that can be directly related to satellite observations,” Goodman. He raises a number of examples of uncertainties that can now be cleared up. For example, some flights will pass over Chesapeake Bay, which provides a necessary “dark” watery background: “We didn’t know how stable the satellite platform would be, so there’s concern about jitter for the GLM…so we want to know what happens looking at a bright cloud versus a very dark target in side-by-side pixels.”
Goodman said tests of the new ABI, or Advanced Baseline Imager, involve checking the mirror mechanism that enables north-south scanning. For validation, the project will position a team of students with handheld radiometers in the desert Southwest, but also do a first-time deployment of a radiometer aboard a unmanned aerial system.
The expected capabilities of the ABI, with its 16 spectral channels, are featured in an article by Timothy Schmit and colleagues in the April issue of the Bulletin of the American Meteorological Society.

Great bursting balloons, Batman!

Ever wonder what happens to weather balloons as they reach their peak altitude and can’t take the low pressure anymore? They pop, right? Nope. They shatter! Shred! Explode!
This video shows the unique way a weather balloon bursts at about 30,000 m.

Credit: Patrick Cullis (NOAA/CIRES)
The full explanation and several stills to show the explosion in spectacular “stop-action” are in an upcoming issue of BAMS. For members, the BAMS digital edition with its new multimedia capabilities will show the article with both the stills and an embedded video.

A Scientific Neighborhood

At some point, very early in our meteorological education, we learn that the atmosphere, the oceans—and thus weather and climate everywhere—are inextricably linked across the globe. Your weather is my weather, no matter where you live and where I live.
Weather makes us all neighbors—partners in science across vast distances. The idea is indelibly etched in our science. It was alive as early as Benjamin Franklin, writing to his brother hundreds of miles away to ask if the weather in Boston bore any relation to the weather in Philadelphia. It pervades the insights of Edward Lorenz, who taught that the flap of a butterfly’s wings in Brazil might be the trigger for a tornado in Texas.
The neighbor principle of weather drives discovery and propels the dramatic improvement in forecasting and understanding we continue to witness. We see this ethos in the free exchange of data and sharing of resources to build our Global Observing System. We see it when Europeans and Japanese move their satellites to help us cover gaps in our observing, and when Americans do the same for them. In science and saving lives, we are neighbors, across thousands of miles of ocean.
The good neighbor spirit was alive and well at an AMS Annual Meeting Town Hall on U.S.-International Partnerships this month. The panel featured representatives from AMS, the World Meteorological Organization, and the meteorological societies of China, Japan, South Korea—people who traveled half a world from their families to be with us. They came together to tout the value of close international collaborations. At the Town Hall, it was clear why scientists seek opportunities to confer with each other, across borders. “We need to learn from each other,” the panelists agreed.
Last week the AMS joined 170 other professional, academic, and scientific organizations in signing a letter to President Trump. The letter warned that the Executive Order issued on January 27 regarding visas and immigration has “profound implications for diplomatic, humanitarian, and national security interests, in part because of the negative impact on U.S. science and engineering capacity.”
The letter points out that

In order to remain the world leader in advancing scientific knowledge and innovations, the U.S. science and technology enterprise must continue to capitalize on the international and multi-cultural environment within which it operates.

AMS has been doing more and more to recognize the reality of that international and multi-cultural environment in our disciplines. This reality has a long history. Franklin’s ideas on lightning were quickly celebrated in Europe, for example. And the founder of modern weather services in our country, Cleveland Abbe, encouraged translations of seminal European papers in the pages of Monthly Weather Review, a journal he founded in 1872 to make domestic meteorologists aware of relevant scientific innovations. Throughout the early 20th century revolution of scientific weather forecasting, major advances came through exchanges of scientists traveling to Europe, and from Europeans scientists who came to the United States. Nearly every American in the AMS can trace their personal scientific “lineage” to trans-Atlantic and trans-Pacific exchanges of this kind.
Today, AMS continues this neighborliness of science—through cooperative agreements with societies in Canada, China, Europe, and India and elsewhere, through the programming of its meetings, and through the pages of its widely read journals. Take the latest Annual Meeting: more than 500 attendees came from outside the United States. Look at the latest issue of AMS’s Journal of Climate: fully half of the 50 authors listed there are affiliated with institutions of other countries. A large number of the other half were educated, at least in part, in overseas institutions. Scientific talent, innovative ideas, professional heritage—all flow across the globe as necessarily as wind and water.
This international environment is the scientific neighborhood in which we live. It is one critical reason that AMS and its cosigners offered the President their assistance in “crafting an immigration and visa policy that ensures strong borders while staying true to foundational American principles as a nation of immigrants.”


Observing #AMS2017 through the Lens of Twitter

The twitterverse was abuzz with activity during last week’s Annual Meeting. Here are a few of the highlights:

AMS Editors Discuss Peer Review

Fundamentally, peer review is critical to the proper functioning of science, and yet there can be surprising variations in the subtle variations of what editors are looking for and how they select reviewers and make decisions.
Today at the Publications Workshop of the Annual Meeting, several AMS journal editors will gather in a panel (Room 604, 12:15 PM) to answer your questions about the how’s and why’s of the peer review process.
The editors exploring their common views and differences are: Tony Broccoli, of the Journal of Climate; Walt Robinson, of the Journal of Atmospheric Sciences; Carolyn Reynolds and Yvette Richardson of Monthly Weather Review; and Jeff Rosenfeld, of BAMS.
Snacks will be provided, and there will be discount coupons of MWR Chief Editor Dave Schultz’s book, Eloquent Science: A Practical Guide to Becoming a Better Writer, Speaker, & Atmospheric Scientist for those attending. The book can be purchased at the Resource Center.
To get a head start on some of themes the panel will address, the AMS recorded two interviews–one with Schultz and Weather, Climate, and Society Chief Editor Amanda Lynch–about the role of peer review for two contrasting journals:
Interview with David Schultz:

 
Interview with Amanda Lynch:

A Day of Fun Observations at WeatherFest

There were plenty of entertaining and educational observations made by weather enthusiasts of all ages at WeatherFest on Sunday. Close to 2,00o people visited the Convention Center for an afternoon of weather experiments, exhibits, and festivity. There was even a special appearance by Owllie Skywarn!
Check out a few of the highlights here:
weatherfest3
weatherfest4
weatherfest1
weatherfest6
weatherfest2
weatherfest5
weatherfest7