by Raj Pandya, Annual Meeting Co-Chair
The theme of this year’s annual meeting is communication, and I think one of the hardest parts of communication is listening. I find it embarrassingly easy to slip into broadcast mode, and imagine that simply because I want to say it, others will be interested. My 8-year old daughter can be brutal about this: “Daddy, this is boring, can we talk about horses, please.” (I will say, though, I can sneak in a little thunderstorm talk if we frame it around storms’ impact on horse happiness).
So, I am especially looking forward to this annual meeting as a chance to listen, especially to communities we haven’t interacted with before or in places we haven’t gone. There are lots of opportunities in this meeting. The presidential forum opens the meeting with some suggestions about how to address what audiences may be interested in and how to present information in a way that connects. There is a themed joint session on Thursday called “Ways of Knowing” that will explore things from an indigenous perspective. Sunday night, before the meeting kicks off, students will be presenting their research – a great chance to listen to the next generation. On Tuesday, a panel will tackle the challenge of communicating – and listening –across our various disciplines and another set of talks will focus on communication and diversity. Finally, there are sessions that explore communication from a user perspective – including public health, energy, and people interested in tropical cyclones.
The second hardest part about communicating is adapting. I find myself clinging to my preferred mode of communication, even when the audience and circumstance change. It doesn’t always work – in the words of Hawkeye Pierce, “He doesn’t understand loud English, either, Frank”. Even only in English, there are new social media and devices that are rapidly changing the way we communicate.
There are a number of talks at the Annual that tackle this. There are sessions on mobile devices and e-books and a more general session to explore technology that enables communication. There are special sessions demonstrating technology in education and a special session on Thursday looks at how data publishing may change the way we communicate science.
Yogi Berra is reported to have said a whole lot of things, including “You can observe a lot just by watching.” In the spirit of this year’s Annual Meeting, with the theme of communication, I’d suggest, instead: “You can hear a lot by just listening.”
Have fun.
Columnists
Why We Need Public Education in Earth Science
by William Hooke, AMS Policy Program Director.
From the AMS project, Living on the Real World
Early in the Bush administration, sometime during the winter of 2001-2002, I got to sit in on a remarkable conversation. Three of us were meeting with the president’s new science advisor, John H. “Jack” Marburger, III, in his office. He was just getting his feet on the ground, and reaching out to different sectors of the science community. We were there to speak a bit to the contributions atmospheric science had made to the country, and how these contributions would not have been possible without steady government support, sustained for several decades. We weren’t there to ask for something; we were there to express thanks for past support, from both Republican and Democratic administrations.
At one point Jack invited us to each say something about the work of our respective organizations. I’d been at the American Meteorological Society only a year or so, and felt I’d rather say something about the work of our Education Program rather than my own policy interests. So I described how Ira Geer and his staff had constructed a wonderful Ponzi or pyramid scheme. Many science education programs focused on getting practicing scientists in the classroom; the idea has been that somehow these scientists could convey the excitement of the research bench. Some university faculty have proved better at this than others, but the results have been checkered at best. Ira and the AMS came at this from the opposite direction: public school teachers knew how to relate to the school kids; so why not give these teachers the resources they’d need to teach Earth science content? The AMS focused on reaching into the classrooms of education departments at universities and community colleges. They also chose to work closely, over a period of years, with a small cohort of public school teachers, who in turn would return home each year, and establish and maintain further cohorts (of cohorts) in their home states. In this way, Ira, his successor Jim Brey, and their staff of ten or so have reached 100,000 teachers and ten million students. Good numbers!
Marburger thought so too. He had been polite all along, but now grew animated, leaned forward. “American kids care about three kinds of science,” he said, “space, dinosaurs, and the weather.” He then recounted a story from his Brookhaven National Laboratory days. “We had an open house every year,” he said.
“One year, looking for ways to boost public attendance, we realized we had a National Weather Service Forecast Office on our [extensive] Brookhaven premises. We added them to our open house. The good news was that attendance shot way up! The bad news was everyone flocked to the Doppler radar. No one wanted to see our particle accelerators.”
What does this say? Public education in the Earth sciences provides the United States a badly-needed twofer. First, if educational statistics are leading indicators of the future place of the United States in the world, then our slippage relative to other countries in science, technology, engineering, and mathematics (STEM) education augurs poorly. More emphasis on Earth science education offers a way out of our dilemma. As kids are drawn into Earth science, they quickly realize they need to learn a little physics, a little chemistry, a little biology – and top it all off with some mathematics. That childhood fascination with snowflakes and winter storms; thunder and lightning, downpours, and rainbows; with hurricanes and tornados? Earth sciences tap into this. They are a portal, a doorway, inviting kids into the world of science and technology more broadly.
Second, these school kids, when they reach adulthood, are going to be consulted frequently, through polling, through the voting booth, through their daily viewing choices on television or websites about their environmental preferences. What do they want their elected officials and leaders to decide and do relative to resource use, environmental protection, land use, building codes, preservation of habitat and biodiversity? High school may be the last chance to many to obtain the educational grounding they’ll need to make wise choices.
Sadly, most state educational standards struggle to include Earth sciences in any robust way. The tendency is for Earth sciences to be crowded out by physics, chemistry, biology, and mathematics. Understandable! These subjects are basic – they offer great employment opportunities going forward, and many of the same political challenges. But ideally, educators would use Earth sciences curricula as bookends in the secondary schools. The Earth sciences should be introduced at some point in middle school, to motivate students to learn the science and mathematics that are coming through the rest of the high school years. But then it should be re-offered, at a greater level of complexity and thoroughness in the senior year, when students can see how the physics, chemistry, and biology that they’ve been learning come together in order to explain how the atmosphere, oceans, and land surface work.
Easier said than done? Absolutely. But worth it if we hope to sustain our quality of life on the real world.
On the Road Again!
by William Hooke, AMS Policy Program Director. From the AMS project, Living on the Real World
The meetings and discussions will be of interest in and of themselves. In some areas of our lives, weather is vital, but we can do little more than sigh. Give a

farmer thirty minutes notice of a coming hailstorm? He’s going to lose his wheat crop anyway; he can just start the grieving process half an hour sooner. In other venues, we’ve got plenty of weather information, but we’ve made it less relevant. That’s why offices are housed in buildings… and why we have domed football stadiums.
But roadways are an intersection (forgive me…too tempting!) where (1) weather affects safety and the economy, and where (2) those affected – the drivers, the traffic managers, the roadway maintenance folks, the businesses dependent on supply lines fed by road – if given the right information in the right way, can actually do something about it. A hailstorm is coming? Traffic managers can put out the word; drivers in the hailstorm’s path can divert or stand down until the hazard passes. Snow is on the way? We can get out the trucks with the plows and salt. And people are using the roadways to get from home to the office, or to that football game, aren’t they? Even in this age of virtual connectivity, physical connection still matters, commercially and socially, and much of that connection is made by roadway.
So road weather is a very special topic, rich with potential for improving the human condition.
We also find road weather to be an interesting example – a microcosm, if you will – of policy issues that play across what appears at first blush to be a “stovepiped” landscape. But let’s probe a little deeper. In this instance, we find leaders who see their institutions as the organ pipes they are, and are jamming, playing a little music together (to build on yesterday’s metaphor from my post, “Stovepipes! The Musical“). They’re effectively working across boundaries – boundaries separating::
Federal agencies. The DoC/NOAA/National Weather Service and the DoT/Federal Highway Administration each have a piece of the puzzle, don’t they? To be valuable, weather information must be applied. As the FHWA tries to make road travel and commerce safer and more efficient, it must integrate weather with traffic conditions, road maintenance, and other elements of the mix. To be useful, the agencies need each other! At the policy forum, they’ll be signing an memorandum of understanding (MOU) – a policy document – committing to another five years’ collaboration on road weather research and services.
And by the way, there are policy interfaces within each of those two Cabinet-level Departments, aren’t there? FHWA is competing with its rather larger sister agency, the Federal Aviation Administration, the Federal Railroad Administration, the Maritime Administration (MARAD), and many more, for attention at the top. NWS is always trying to make sure
Science Policy: What Would the Founding Fathers Do?
by William Hooke, AMS Policy Program Director. From the AMS project, Living on the Real World
“Facts are stubborn things, but statistics are more pliable.”
– Mark Twain
When I was a graduate student in physics at The University of Chicago, the department had a weekly seminar. One year Subrahmanyan Chandrasekhar, a faculty member, already a famous astrophysicist (he would go on to win the Nobel prize) and author of over 1000 publications, delivered a talk on his new theory of quasars. The next week’s speaker happened to be Tommy Gold, a Brit, a fellow of the Royal Society, and then on the faculty at Cornell. He laid out a competing theory. When Gold was done, Chandrasekhar was the first person to ask a question. Wearing his signature pinstripe suit and looking like he just stepped out of the pages of GQ, Chandrasekhar cut a dignified figure as he rose from his chair. “Surely you would agree…” he smoothly began…
Can’t remember exactly what he said next, but it was the equivalent of asking Gold whether he believed that 2+2=4. It was also the first step down a line of argument that would lead to Chandrasekhar’s theory. The room was packed, but you could have heard a pin drop. Gold looked at him for what seemed like forever; then finally said “No.”
Maybe for the more senior faculty this was just another day at the lab, but we students had never seen a scientist do that. Every person in the room knew the only right answer was “yes.” Most of us had also been present the week before. Chandrasekhar glowered, then silently took his seat. A serious chill set in the room. The Q&A went on for some time, but never fully recovered.
Tommy Gold knew that you couldn’t separate data and facts from considerations of the end. To defend his theory he was going to have to say “no” at some point, so he might as well do it early.
It was not science’s best day. But in that instant I took to heart – internalized in my gut, not just my head – that while science might be objective, the pursuit of science could be very political – and combative. As a result, the process of collecting and analyzing the data can’t really be separated from considerations of the end use.
I got to see this up close and personal from 1987-1993 . At that time I was the NOAA Deputy Chief Scientist. The National Acid Precipitation Assessment Program (NAPAP) Program, an interagency group, was administratively housed in NOAA under the leadership of the Chief Scientist. The same argument was playing out, but now
…but not THE Bomb
Editor’s note: Having just posted on the record-setting central U.S. bomb below, it’s only fair to hear immediately from the other side (of the continent) about who has the biggest, baddest storms. Only in meteorology do you get both pros and cons in a story about bombs….
by Cliff Mass, Univ. of Washington
reposted from the Cliff Mass Weather Blog
There has been a lot of media attention regarding the storm in the Midwest with claims it was the strongest (lowest pressure) non-tropical storm in U.S history. DON’T BELIEVE IT FOR A MOMENT. This is classic eastern U.S. media myopia….we have had the deepest and most violent storms!
So here is the story. The media is raving about this storm in the Midwest in which the lowest pressure reported was 28.20 inches or 954.8 mb at Bigfork Airport in Minnesota. This is the lowest pressure ever observed in Minnesota! Here is a surface analysis of the storm at its height.
Now this storm has very low pressure but the pressure gradients (pressure changes with distance) are not that impressive and pressure gradient drive winds. Thus, the winds were really not that exceptional.
But we can top that without breaking a sweat. Now take a relatively recent storm around here in the Pacific Northwest: December 12, 1995. During that event the sea level pressure at Buoy 46041 , 52 miles west of Aberdeen, Washington, got to 28.31 inches (958.8 mb) and certainly that did not sample the center of the storm. Since the storm was farther offshore the pressure would to had to have been considerably less. The estimate of local storm uber-expert Wolf Read was the pressure had dropped at least to 953 mb (see track map below).
There are other examples I could cite. The great January 1880 storm was probably much deeper as well and I bet I could find others. And I haven’t even mentioned the Columbus Day Storm of 1962, which clearly was the most powerful extratropical cyclone in U.S. history. Furthermore, our storms generally have larger pressure gradients and thus more extreme winds.
The media is going nuts about a storm that had maximum gusts of 81 mph. Big deal. Our storms regularly have winds over 100 mph and sometimes over 125 mph
If you want to read detailed accounts of major Northwest windstorms, check out the WONDERFUL web pages created by Wolf Read available on the Washington State Climatologist website. Hours of good reading there.
And Bri Dotson and I recently published a paper on our storms.
Now I know how these tricky east-coasters work. They will say that our storms are generally over water during their early lives and don’t count. Don’t let them get away with this. Their fabled “Nor’easters” –which they count–spend plenty of time of water. And don’t forget the Great Lakes! And why did they call one of their storms “The Perfect Storm” when many of ours far outrank it by any mark?
Michio Yanai, 1934-2010
by Robert Fovell, UCLA, and Wen-Wen Tung, Purdue Univ.
Professor Michio Yanai passed away suddenly at his home in Santa Monica on October 13th, at the age of 76.
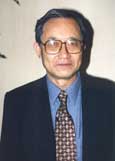 A seminal figure in tropical meteorology, Professor Yanai grew up in Chigasaki, Japan. He received a D. Sc. in geophysics at the University of Tokyo in 1961 and was an assistant professor at the same university from 1965-1970 before being appointed to a full professorship at UCLA in 1970.
Professor Yanai published a 1964 review paper on the formation of tropical cyclones that served as the most comprehensive reference on the topic for more than a decade. Much of his groundbreaking work continues to guide research even today, including his observations of the mixed Rossby-gravity wave (also known as the Yanai wave), his systematic approach of estimating apparent heat sources (Q1) and moisture sinks (Q2) and associating them with the bulk properties of convective systems, and his diagnostic studies of the Asian monsoon, in particular his pioneering works on the impacts of the Tibetan Plateau on the Asian Monsoon. In 1986, the American Meteorological Society honored him with the Charney Award. In 1993, he received the Fujiwara Award from the Meteorological Society of Japan. His UCLA Tropical Meteorology and Climate Newsletter has been an invaluable resource to the community since its founding in 1996.
This year, Professor Yanai was selected by the AMS to be honored at a special symposium dedicated to his life and career at the 2011 annual meeting in Seattle (Thursday, 27 January). Professor Yanai was thrilled by this selection, which certainly helped maintain his passion and energy as his health declined, and was a very enthusiastic contributor as the symposium program took shape. He was scheduled to deliver the closing remarks at the symposium.
The occasion led Professor Yanai to reminisce not only about his life and career but also about the histories and contributions of his colleagues, especially his fellow meteorologists who emerged from post-war Japan. He also recently embarked on a project to document the evolution of the Atmospheric and Oceanic Sciences program at UCLA, which was still called the Department of Meteorology when he joined in 1970. Professor Yanai was in the midst of collecting oral histories of the department from past and present members of the UCLA family when he passed away. The last UCLA Tropical Meteorology and Climate Newsletter was issued on October 8th.
Although we will greatly miss his presence at the Michio Yanai Symposium, we know he will be there in spirit when we gather to honor his accomplishments, his legacy and his memory. No one who is so fondly remembered can ever truly be lost.
Professor Yanai is survived by his wife, Yoko; two sons, Takashi and Satoshi; four grandchildren, and a sibling, Tetsuo Yanai of Japan. The family requests that memorial donations may be made to the Professor Emeritus Michio Yanai Memorial Fund in Atmospheric and Oceanic Sciences at UCLA. E-mail Dawn M. Zelmanowitz ([email protected]) for information. Readers are also encouraged to share their memories of Professor Yanai in the comments to this blog post.
The Meteorology of the Chilean Mine Rescue
by Cliff Mass, Univ. of Washington; reposted from Cliff Mass Weather Blog

Now that all of the miners are safe, it is interesting to think about some of the meteorological aspects of the disaster–and of the misinformation provided by the media.
Some of the media suggested that the miners could get the bends from “rapid decompression”, but this is nonsense!
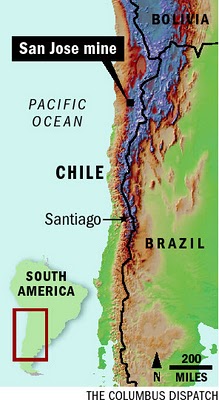
The level of the mine entrance, where the drilling is taking place, is at roughly 2400 ft above sea level, and the miners were trapped at a level a few hundred ft above sea level. Clearly, the pressure was higher where the miners were–roughly 8 % higher. And it took them about 15 minutes to make the change as they were lifted out. This is nothing to worry about! Virtually all of you experience this change many times each year. An example: drive to Snoqualmie Pass (elevation roughly 3200 ft) from the west. The last fifteen minutes you gain roughly the same elevation in the same amount of time! Or when you take off in a plane, take a long lift ride while skiing, take that gondola ascent on vacation, etc., you experience the same or worse!
Then there was the “steam” coming out of the hole (click on picture to see video):
Why the cloud coming out of the hole? The temperature down in the mine was very warm (90-105 from various reports) and there were sources of moisture down there. The air had sufficient water content that when it hit the cool nighttime air, it was cooled to saturation–thus the fog. It looked to me that temperatures were fairly cold during the evening rescues—40s F perhaps from the jackets people were wearing. A small contribution could also have come from the expansion cooling of the air as it rose.
The region surrounding the mine is very, very dry–in fact one of the driest places on earth…the Atacama Desert (see map). Some locations have never observed rain, and in others they receive perhaps a few hundredths of an inch per year. Why so dry? Sinking air from a subtropical high, the high Andes preventing moisture from moving from the east,
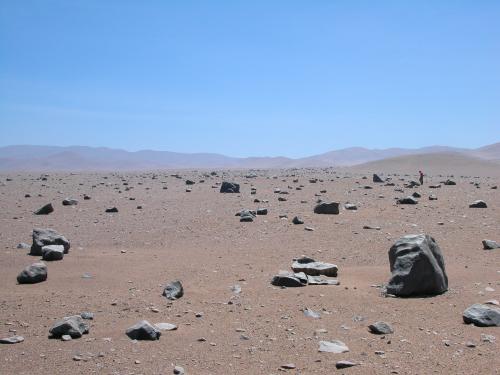
 and the coastal mountains preventing moisture movement from the west. Plus an inversion aloft that stops the air from moving over the coastal mountains.
The Storm That Started a Drought?
by Robert V. Sobczak, National Park Service, Big Cypress National Preserve.
Reposted from his blog, The South Florida Watershed Journal.
Do all storms end with drought?
I know you’re thinking. I mean the opposite instead:
That “all droughts end with a flood,” right?
A meteorologist in the snow-bound climes of the Red River Basin introduced me to the latter saying. To what degree it holds any statistical truth I cannot say. My initial gut reaction was that an observational bias was in play, plus some seasonal slight of hand. But no matter how much I tried to deny it, the saying kept sneaking up on me wherever I roamed.
Take Tropical Depression Nicole for example. It threatened to make our already high-water rendition of the Big Cypress Swamp all the more wetter but by the flap of the wings of the butterfly bypassed to the east and then onward north to the Atlantic Coast where it drenched those watersheds instead.
Now here’s the catch:
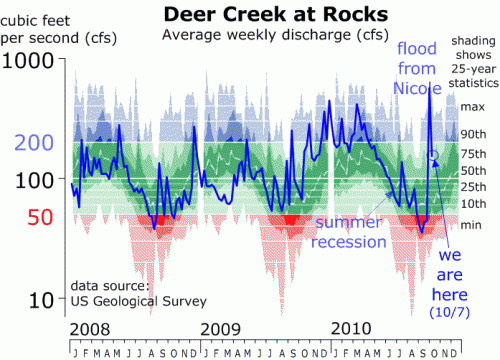
Those watersheds were at the end of their seasonal drought, better known as the summer recession, transforming currents from trickles into torrents overnight.
So yes, chalk one on the board for that old reliable saying!
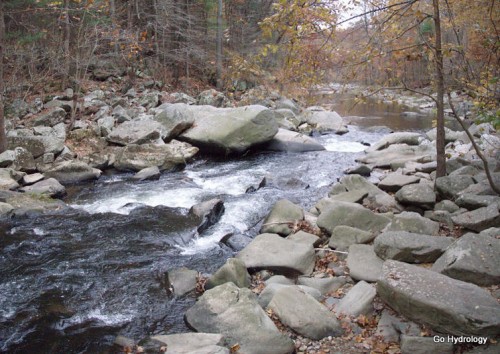
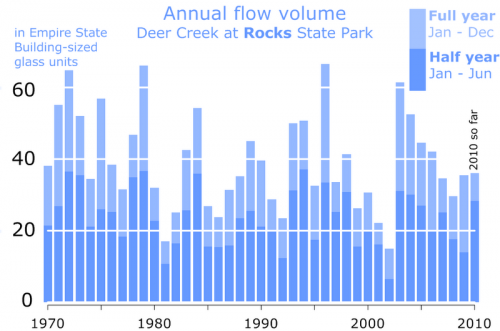
Case in point is Maryland’s Deer Creek, as measured at Rocks State Park (or just “Rocks” as us Harford Countians call it). Thanks to Nicole it now has a chance to top 40 Empire State Buildings (ESBs) worth of water flow for the year. That would make it an above average year, but not a “chart topper,” a term I reserve for the biggest of big flow years which pass 60 or more ESBs worth of water. That’s happened just four times in the modern era (aka my lifetime), the most recent of which (2003) which was, as predicted by that old reliable saying, preceded by the drought of record in 2002 when less than 20 ESBs worth of water flowed through Maryland’s famed Rocks State Park for the year.
Ha, there it is again! So, cherry picking not withstanding, I guess that means that, yes, all drought do seem to end with floods.
Does the same saying apply to the Florida swamps?
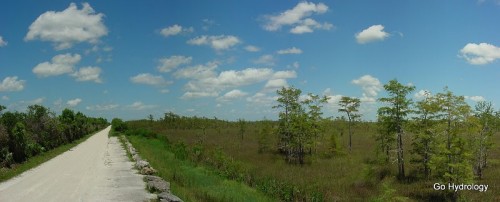
Seasonally it happens each year with our winter dry season. By spring the swamps are nearly 100 percent water free and crunchy, just a single lightning strike away from an uncontrollable blaze. But along with the lighting are the thunder that beckon the wet season’s arrival … and the floods that will soon be to follow.
Which brings me back to Nicole:
Instead of flushing flood waters even higher into the swamp it paradoxically reversed the tables by ushering in a week’s worth of dry air in its wake instead.
Meteorologists are calling it an early start to the dry season.
Or in other words…
Call it the storm that started the drought!
Scientists 4.0
by William Hooke, AMS Policy Program Director. From the AMS project, Living on the Real World
Scientists periodically undergo similar upgrades, but with little or no fanfare. Let’s start to correct this….I’m a scientist version 3.0, but if you’re a scientist and reading this, chances are good you’re a scientist version 4.0.
Got your attention? Let’s peel this onion:
Scientist version 1.0 This generation comprises greats such as Empedocles (ca. 490-ca.430 BC), Aristotle (384-322 BC), Hippocrates (ca.460-ca.370BC), Galen (129-217[?]AD), and others. These men didn’t think of themselves as scientists. Instead, they saw themselves as philosophers, as thinkers. And the scientific method, the rules for thinking which we regard as commonplace today – based on evidence, logic, and rigor; developing testable hypotheses, subject to proof or disproof by experiment – were either under construction or lay still ahead. Peer review? Out of the question. It was therefore possible for Empedocles to suggest that all matter was composed of a blend of four basic elements – earth, water, air, and fire. Aristotle could assert that porcupines shoot their quills. Hippocrates could intuit a link between the environment and health even though at a loss to explain just why. Galen might decide (versus, say, determine) that the function of the heart was to heat the body. All of these notions were flawed at best, or failed to survive subsequent scrutiny. However each, even the theories about disease, contained (ahem!) a germ of truth. Each helped burnish the reputation of these men as among the foremost intellectuals of their time. They got us started down the road to the science of today. They will always remain giants.
Remember, as we’ve discussed in previous posts, that the pace of progress and social change was once much slower than it is today. So this state of affairs persisted for maybe 2000 years. Then along came
Scientist version 2.0 Just to make things concrete, suppose we name Galileo (1564-1642) and Newton (1643-1727) two of the first of this new breed. Their contributions? To elevate the idea of controlled experimental tests, quantitative measurement, meticulous observation – and to inject a little mathematics. They may have thought of science as an activity, but still thought of themselves more as natural philosophers. The term scientist probably didn’t come into widespread use until later in this period, the 19th century, say. Science was still seen less in terms of career or profession and more in terms of avocation. As we pointed out in an earlier post, even as recently as Darwin, scientists were either independently wealthy or forced to cobble together funding and resources for their work. These folks succeeded in picking up the pace of innovation quite a bit. Version 2.0 prevailed for a little more than 300 years.
Scientist version 3.0 This pretty much covers every scientist alive today who’s been out of graduate school for at least 5-10 years. The version was launched during and immediately following World War II, per yesterday’s post. Thanks to Vannevar Bush, scientists-version-3.0 have operated under the most unusual social contract ever envisioned, let alone implemented, by the mind of man: “Give us lots of money, and stand back – and someday you’ll be glad you did.”
What’s even more amazing is that scientists-version-3.0 have provided an extraordinary return on this investment. Society got a bargain! This scientist-upgrade provided
No One of Us Can Solve the Whole Problem
by William Hooke, AMS Policy Program Director, from the AMS Project, Living on the Real World
“Go to the ant, you sluggard; consider its ways and be wise!”
This Biblical proverb warns against laziness, and exhorts each of us to higher levels of diligence and industry. A good idea! However, there’s more here. The ant also demonstrates the power of effective policy. Before turning to the ant, a brief segue…
Have you ever watched a flock of birds? (Or, equivalently, a school of fish?) Scientists are getting clever about why birds (and fish) exhibit such behavior. The motives are apparently social and include protecting against predators, staying warm in winter, and sorting out dominance. But how do they do it, given that they’re under the control of birdbrains? We don’t know for sure, but here you will find a video of “boids”: what flocking would look like if birds operated on the basis of three rules:
- matching speed and direction with nearby birds
- maintaining a minimum separation, to avoid in-flight collisions, and
- always flying toward the center of the flock
The rules seem pretty simple, don’t they? Reading them, it’s pretty easy to imagine that birds are able to operate, and cooperate, on this basis. And sure enough, the video looks pretty realistic, doesn’t it? In essence, flocking birds seem to have a policy, a framework for making decisions. By the way – and this is important to tuck away for later – this kind of behavior is called “emergent.” If you study a few birds in the laboratory, you would never know about this ability. It’s only when birds are present in large numbers, and free to behave as they want, that this behavior emerges. If you’ve got the time (six minutes), check out this YouTube video: starlings on Otmoor to see flocking in its fullest grandeur:
But back to the ants. Though birdbrains are the subject of ridicule, birds are mental giants compared with insects. And ants exhibit their own emergent behavior, don’t they? Again, study
