“Once in a Generation”: The 2022 Buffalo Blizzard

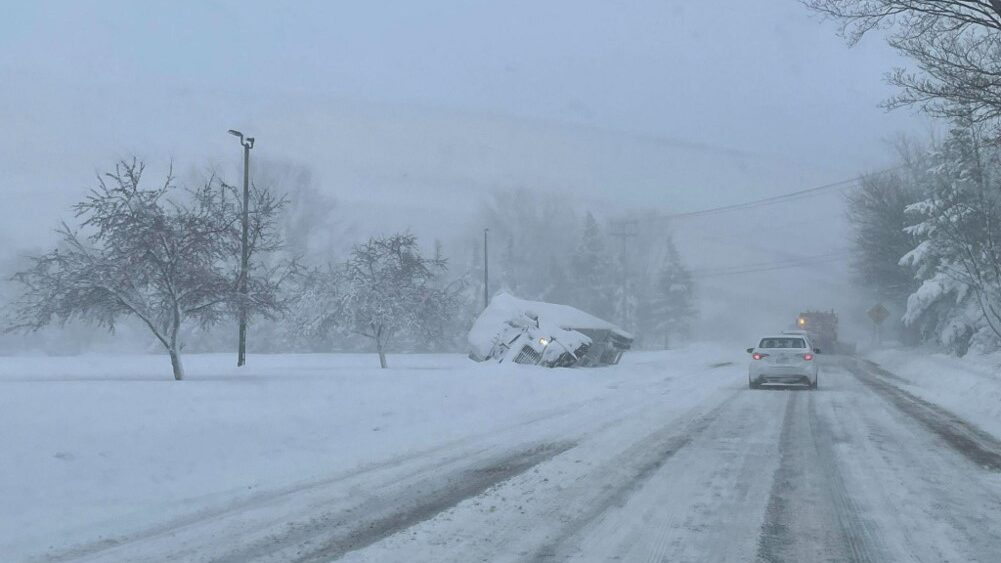
Truck in snowdrift

A Research Spotlight from 32WAF/28NWP/20Meso

On 23 December, 2022, David Zaff of the National Weather Service’s Buffalo office walked out into a blank white world of howling wind. He headed to his car to get supplies, knowing there was no way to get home. He and his coworkers were trapped at the office, in the middle of one of the most deadly and disastrous blizzards Buffalo has ever seen.

Video by David Zaff, showing whiteout conditions outside NWS Buffalo office, December 23, 2022.

At the height of the 2022 holiday travel season, the four-day blizzard and lake-effect snow event knocked out power for more than 100,000 people, paralyzed emergency services and holiday travel, and left at least 47 dead. New York Governor Kathy Hochul described it as “the most devastating storm in Buffalo’s long, storied history.” Yet days earlier, Zaff and colleagues encountered skepticism from the public as they worked to warn the region.

Presenting at the J3 Joint Session at the 32nd Conference on Weather Analysis and Forecasting, the 20th Conference on Mesoscale Processes, and the 28th Conference on Numerical Weather Prediction, Zaff talked about the disaster and how the NWS countered accusations of hyperbole to get the word out.

Sounding the Alarm

The December 2022 snow was shocking, but not surprising. The pattern was easy enough to recognize, even 7–10 days earlier: a large high-pressure ridge forming over the western U.S., with a major trough in the east. “We knew something big was coming,” said Zaff. Five days before the storm, even low-resolution models suggested a major event. Four days ahead, the NWS started ringing the alarm bell. “We started saying, ‘A powerful storm will impact the region heading into the holiday weekend.’”

Three days out, the NWS issued an unusually emphatic Area Forecast Discussion (AFD):

“Some of the parameters of this intense storm are forecast to be climatologically ‘off the charts’ … One could certainly describe this storm system as a once in a generation type of event.”

NWS Lead Forecaster Robert Hamilton, Tuesday, December 20, 2022

That caused a stir, but many on social media dismissed it as hype. “People started saying, ‘There goes the weather service again,’” says Zaff.
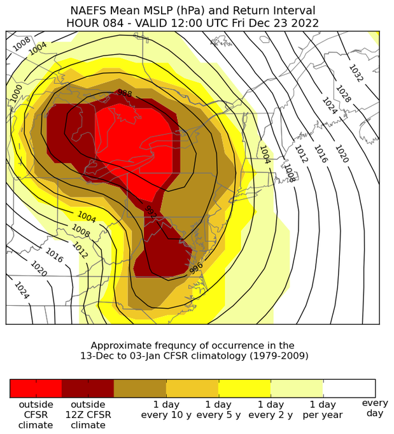
He tried to find a way to show the science graphically, highlighting the forecast as “‘outside’ the climatology” for the time of year.

The graphic and its accompanying description got attention. By then, NWS Buffalo was communicating in earnest, including on social media. A tweet with a text-filled screengrab of the Winter Weather Message received 485,000 views. “A picture is worth a thousand words,” Zaff said, “except when people actually read the words, and see how impressive this event might be.”

Left: Graphic showing forecast surface pressure for Friday, December 23, 2022, with shading showing the relative frequency of the forecast MSLP values in the Buffalo region at that time of year. Source: David Zaff.

Surviving the Storm

Before noon on 23 December, visibility dropped to near zero, and it remained that way until around midnight on 25 December. 500 Millibar heights were “extraordinary” as the pressure trough moved into the Ohio Valley, and surface-level pressure was similarly unbelievable. A top wind speed of 79 mph was measured in downtown Buffalo at 10:10 a.m. on the 23rd, and winds in the 60–70 mph range lasted for 12 hours. “[It was] just an incredible bomb cyclone,” Zaff said. “An incredible storm.”
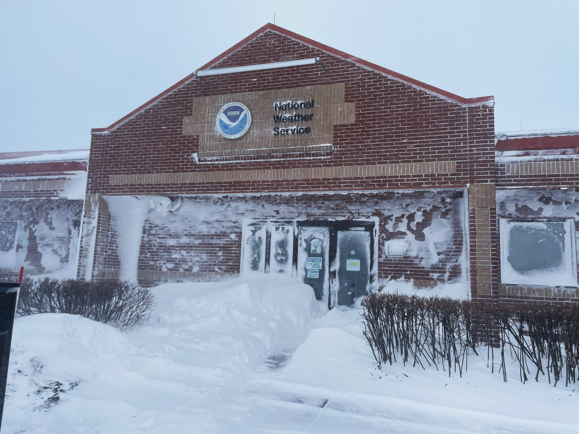
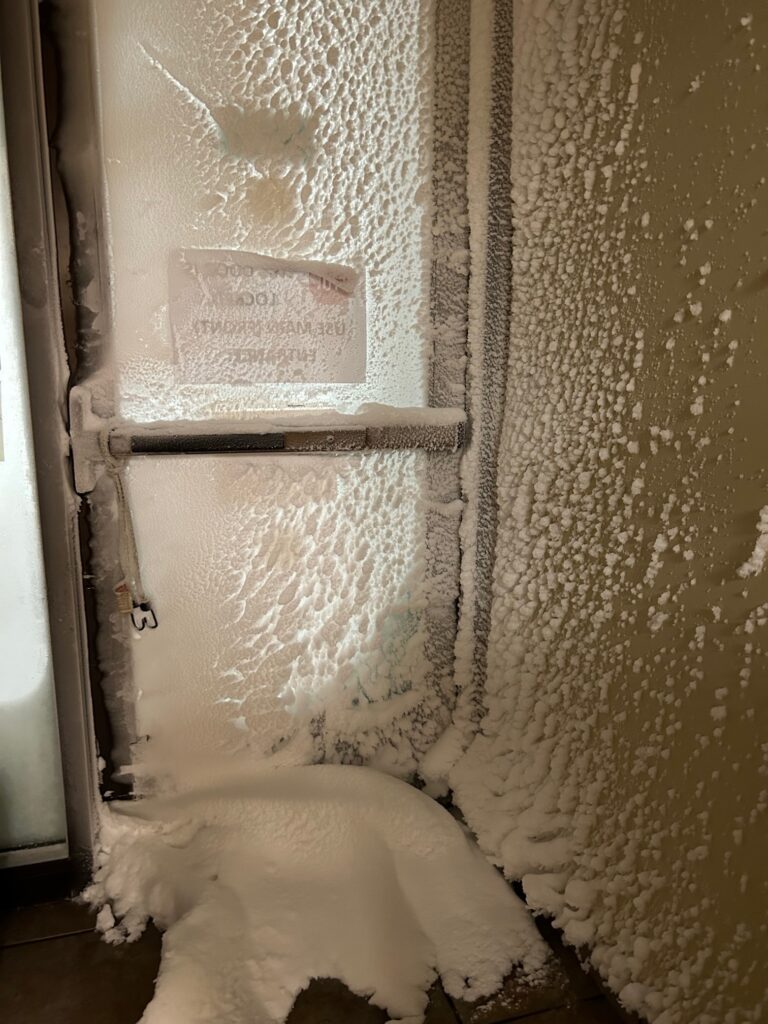
Zaff and some colleagues slept at the office; others attempted to drive in whiteout conditions using GPS alone, while some got stuck in drifts near the office and had to leave their cars to hike the rest of the way. Meanwhile, firefighters and airport employees worked to rescue motorists trapped nearby.

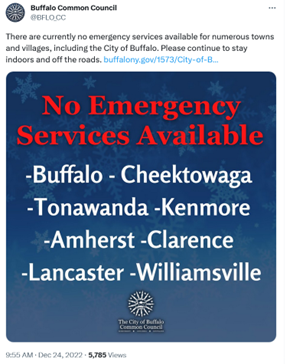
On December 24, the City of Buffalo issued “the scariest tweet I’ve ever seen,” said Zaff. The tweet stated that there were “no emergency services available” for Buffalo and numerous other towns.

“We knew by this time that there were fatalities occurring,” Zaff said. “And it just got worse and worse.”

Blizzard conditions lasted a full 37 hours–and lake effect snow wouldn’t stop for another two days. Three power substations shut down, frozen solid. Hundreds of power poles fell, and a significant percentage of locals were without power during the storm’s peak (some for days afterwards).
The 47 fatalities included people stranded outside, others who died from hypothermia in their homes, and some deaths due to delayed EMS response, according to Erie County. Hundreds of motorists were stranded on roadways during the storm. The Buffalo Niagara International Airport, with a proud legacy of operating under even the most horrific conditions, was closed for six days.

Zaff didn’t return home until late afternoon on the 25th, 18 hours after official blizzard conditions were over and having clocked 50+ hours at the office. On the drive, he saw iced-over buildings and trucks buried in snowdrifts. “It reminded me of [the movie] The Day After Tomorrow. … The impacts were tremendous.”

In his AMS presentation, Zaff compared the 2022 event to disastrous storms in 1977 (20+ fatalities, 69 mph winds, only 12” of snow yet drifts swallowed homes) and 1985 (5 fatalities, 53 mph winds, 33” snow), as well as the “Great Christmas Storm” of 1878, one of the first well-documented lake effect snow events, though lake-effect processes weren’t understood at the time. “This will likely be the storm of comparison now,” he says. “Once-in-a-generation” turned out to be right.

Future Lessons

Moving forward, said Zaff later, “Our intention is to further our relations with our Core Partners, including elected officials, emergency management, and the media [and] provide more probabilistic information that supports our ongoing Impact Decision Support Services. We hope to improve our outreach as well, instilling more confidence with the public.”

NWS will continue to provide improved decision support for partners, which may lead to more proactive road and school closures that could save lives in the future.

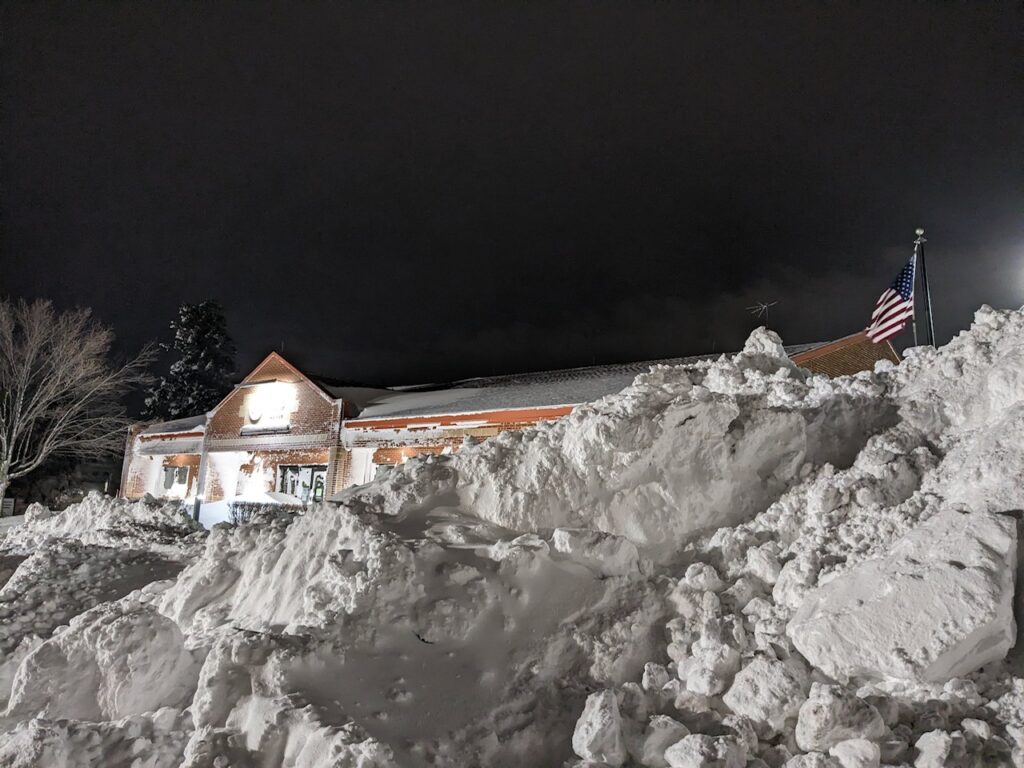
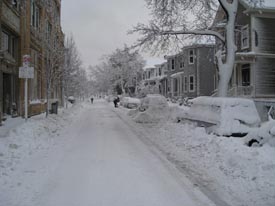
Photo at top: Buffalo roadways at 4 p.m. on December 25, 2022, 18 hours after blizzard conditions had passed. Photo credit: David Zaff.

About 32WAF/20Meso/28NWP

Predicting and understanding storms and other weather events is a complex business with real-world impacts. The American Meteorological Society’s 32nd Conference on Weather Analysis and Forecasting/28th Conference on Numerical Weather Prediction/20th Conference on Mesoscale Processes brought researchers, forecasters, emergency managers, and more together to learn about and discuss the latest scientific developments. The conferences took place in Madison, WI, and online 17–21 July, 2023. Recordings of the sessions are available here.
Even without a White Christmas….Snow Measurements Must Go On

The Pacific Northwest still is one of the few shining spots on the snow map for this holiday, but if Seattle is waiting with bated breath (and outstretched tongue)  for a big, beautiful White Christmas, Cliff Mass throws a bucket of cold (flakes?) on hopes for deep cover. He explains how numerical prediction models can overstate snow possibilities in low elevations near mountains. But also: he explains the commonly misunderstood difference between accumulated snow (what fell from the sky) and snow depth (what remains to pile up).

If you are one of the lucky few with snow on Christmas Day (and one of the many who will celebrate a holiday unimpeded by snowy roads), we have to ask: what are you going to do with that snow, anyway?

If you’re not sure, ask some experts. Maybe ask your friends in the Northeast who so far this winter are bereft of drifts. Would they make snow angels? Sculpt snow people, with carrots, or with buttons of coal dug out of stockings?
When meteorologists catch snowflakes—and not on outstretched tongues!—they measure. Science means quantifying snowfall.  Accuracy matters: the measurements are meaningful. For example, they figure in aircraft deicing, forecasts of spring melt, stream runoff, flooding prospects, and more. They are also tracked over many years in climate records.
Unfortunately, while measuring snow depth might be easy to imagine if you have a ruler, it’s not so simple, and measuring ongoing snowfall is not easy. Ultimately…like most things scientific: there’s more to learn and important refinements to make!

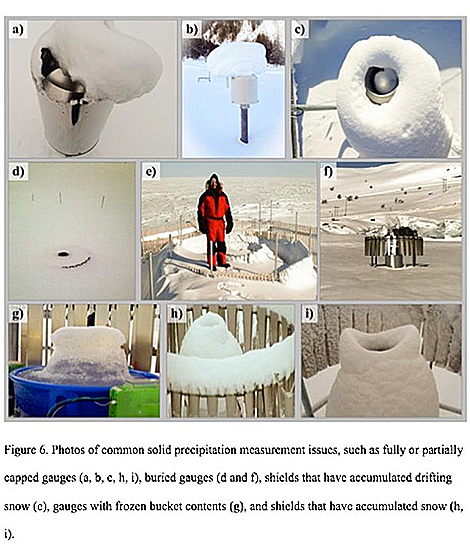
Recently the Bulletin of the American Meteorological Society published a new review of snowfall measurement techniques. The authors, John Kochendorfer of NOAA’s Air Resources Laboratory (Oak Ridge, Tennessee), and colleagues write “snowfall measurements are subject to significant errors and biases.”

For years meteorologists have realized that not all observers and networks measure snowfall the same way. For instance, methods of shielding gauges from wind errors, or accounting for evaporation, vary. And the results vary. To clear this snow observing problem the World Meteorological Organization put together a team of scientists who compared and evaluated the various methods and devices used worldwide. Kochendorfer et al. followed up to see what progress can be made from this WMO report. They write:

Snowfall is one of the most difficult meteorological variables to measure using automated sensors. …. Despite recent advancements in sensor technology, measurement techniques, and communications, snow cover measurements, such as snow depth and snow water equivalent (SWE), are still primarily recorded manually, and require specialized equipment and well-trained personnel. …. Measurement of the liquid water equivalent of precipitation falling as snow, or other forms of solid precipitation, typically requires heated precipitation gauges to prevent full or partial blockage (capping) of the gauge inlet by snow and ice. In addition, precipitation gauges can significantly underestimate the true amount of solid precipitation, primarily due to wind effects. For these reasons, the improvement of snow cover and solid precipitation measurements is an important subject of climatological and hydrological research in cold regions.

All-season measurement methods that catch precipitation (such as tipping-buckets) can handle snow, as can weighing gauges. Methods that catch snowflakes ultimately require weighing the melted water of snow. For these common methods, Kochendorfer et al. note that evaporation and response delays can be a problem (because it is necessary to warm and melt the snow and weigh the catch). The wind shields protecting the gauges can also accrue or redirect snow, however.

One piece of advice from the article may seem perfectly attuned with a White Christmas. If you’ve got family coming over for dinner, and a weighing-gauge catchment device for snow, put the snow in the pan and of course, heat it, but also add a layer of oil. The idea is not to fry up a side dish. But to prevent evaporation (and freezing—in fact antifreeze is used in some snow measurement techniques). Yes, that’s basically a way to keep track of snow as its falling and not lose too much in the process.

The ways of “undercatchment” are multifarious:
Snow measuring issuesMeanwhile, Kochenderfer et al. note a proliferation of automated gauges and new non-catchment methods that involve using laser disdrometers and “present-weather” detectors to remotely determine what type of precipitation is falling.
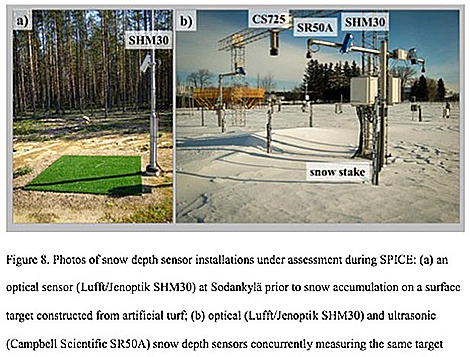
Think of it as measuring free-ranging, versus, captive snow. Data processing methods allow calculations of snowfall rate. So far, according to the WMO comparisons, these devices solve some of the problems of “catchment” measurements, but they are still susceptible to over- and under-counting snowfall accumulation, due to wind direction and other factors. Results so far look better for observations on long periods like full seasons, rather than for a one-day holiday.  The new disdrometers can also be used in tandem with simple evaporative plates that use mass heat transfer to measure amounts.

Even if a White Christmas isn’t in the immediate future for many of us, the future of snow measurement may already have arrived anyway, if not for every observer.

New snow devices

Wilder Weather: Data and Science in the Novel, The Long Winter

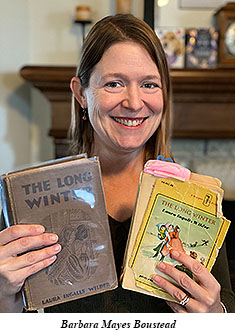
Even tall tales have their facts, but in historical fiction the myriad factual details often far outshine the story itself. In the ever popular books of Laura Ingalls Wilder, the telling details turn out to be the truly epic—and real—weather of the past. Barbara Mayes Boustead (University of Nebraska—Lincoln) and her coauthors show us in a recent BAMS article that Wilder’s, The Long Winter, isn’t just good history wrapped into a great novel–it’s also valuable climate data.

The cold, snowy season of 1880-81 featured in The Long Winter was strikingly difficult across much of the Plains and Midwest. A number of accounts have referred to it as the “Hard Winter” or “Starvation Winter.” Wilder’s story, set in De Smet, Dakota Territory (present-day South Dakota; 60 km west of Brookings), is fiction, but it contains many verifiable facts about the weather.

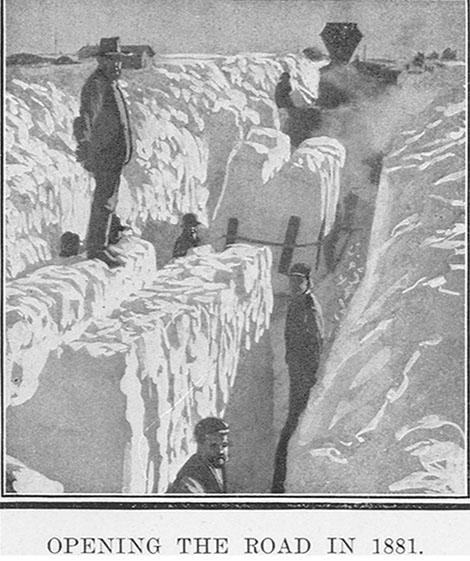
Clearing snowBoustead and co-authors Martha D. Shulski and Steven D. Hilberg set out to determine which parts of Laura’s stories are based in fact, and in the process, filled in the gap left by the absence of analysis or documentation in scientific literature about the Hard Winter of 1880-81. In the process, Boustead et al. show that the Hard Winter places recent severe winters, such as 2013-14, into context.
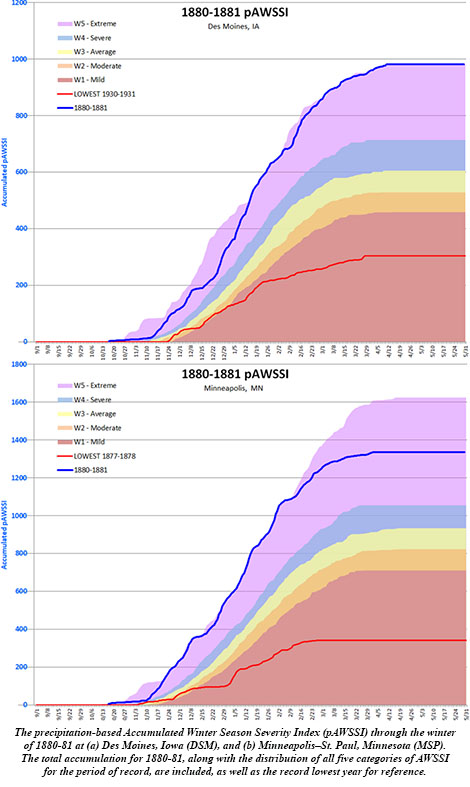
The winter began early, with a blizzard in eastern South Dakota and surrounding areas in mid October. Following a respite thereafter, wintry conditions returned by mid-November, followed by a number of snow and potential blizzard events in December. After a cold but relatively snow-free period, storm frequency increased from early January through February, producing snow almost daily in eastern South Dakota. In March, most days remained below freezing, though snowfall frequency decreased. Cold conditions continued into the first half of April. The BAMS article goes into detail describing why the winter of 1880-81 was so severe.

pAWSSIBAMS asked a few questions of Boustead to gain insight into her research. A sampling of answers are below:
BAMS: What would you like readers to learn from your article?

Barbara Mayes Boustead: Literature and other creative work can provide windows into past weather events and climates – including everything from documentary evidence to the impacts of those events on individuals and communities. We can connect those works to other historical weather data sources, from observations to reanalysis data, to reconstruct what occurred during these noted events, and why. By researching weather and climate related to a popular-interest subject like Laura Ingalls Wilder and the Little House stories, I have been able to reach audiences that otherwise might not have been so engaged, sparking interest in weather and climate by presenting it through Laura’s perspective.

BAMS: How did you become interested in investigating the weather of Wilder’s book?

Boustead_PhotoBarbara Mayes Boustead: The Long Winter research began over a decade ago as I reread the book as a “comfort read” on the tail end of a winter, reminding myself that even the longest winters do eventually end. I’ve been reading Laura Ingalls Wilder’s books since I was in elementary school, and I had always wondered if the winter was really as Wilder had described it. And then I got to thinking – I am a meteorologist, and I have the tools to look it up! The deeper I dug, the more that my questions led to more questions. I especially got excited as I found data that verified much of the weather that Wilder had described. And I knew I had found a resonant topic when I presented the work at a conference called LauraPalooza in 2010 (it’s real and it’s serious!) and was overwhelmed with questions and discussion following my presentation.
BAMS: What got you initially interested in weather and, more importantly, these novels?

Barbara Mayes Boustead: It seems that many meteorologists started with either a memorable event or a fear of a weather phenomenon. I was in the latter group, afraid of thunderstorms in my preschool years. My mother and sister took me to the library so that I could read books about weather, hoping that understanding would help me conquer fear. I had plowed through all of the books in the library in about a year, and I was hooked! As for my interest in Laura Ingalls Wilder, I can again thank my mom and books. She purchased Little House on the Prairie for me at a garage sale when I was in first grade and ready for chapter books. I turned my nose up at it, but she encouraged me to give it a chance. I did, and of course, Mom knows best – I was hooked and plowed through the rest of the book series, too.

BAMS: What surprised you the most in doing this research?

Barbara Mayes Boustead: Laura Ingalls Wilder was an excellent weather observer. Having researched the winter of 1880-81 extensively, as well as the rest of the identifiable weather and climate phenomena throughout the Little House books, I found that while many elements of the books were fictionalized, she recounted weather and climate events with great accuracy. Almost every weather or climate detail in her books really did occur and usually occurred just as she described it. She occasionally moved some timelines around, but the events themselves were spot-on.

BAMS: What was the biggest challenge you encountered in the research?

Barbara Mayes Boustead: There were times during my research that I would have gone to great lengths to obtain true snowfall measurements from one of the observing sites near the area of interest, or to fill in the spatial gaps. Snowfall data just don’t exist for the central U.S. in the early 1880s.

BAMS: What’s next?

Barbara Mayes Boustead: Research into the weather and climate of Laura Ingalls Wilder’s books and life continues as I work to document other weather and climate events from her other books and stories. Given the popular interest in Laura Ingalls Wilder, some of the research is and will be written for broader audiences, providing a window into the world of science (meteorology and climatology) for non-specialists by standing on the shoulders of Laura Ingalls Wilder’s storytelling and characters. What began as a side project has transitioned into decades worth of research and storytelling! Her books include everything from tornadoes and hail storms to blizzards, droughts to floods, extreme cold to extreme heat. There is fodder for research for years to come!

Japan’s “Gosetsu Chitai” (Heavy Snow Area) Illuminates Sea- and Lake-effect Precip Processes

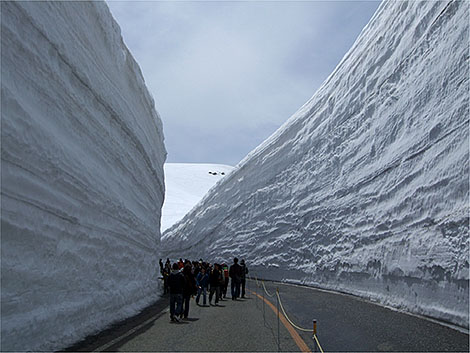
Snow WallNorth American meteorologists, welcome to the snow climate of western Japan. Every year in winter lake effect-like snow events bury coastal cities in northern and central Japan under 20-30 feet of snow. Above is the “snow corridor” experienced each spring when the Tateyama Kurobe Alpine Route through the Hida Mountains reopens, revealing the season’s snows in its towering walls. The Hida Mountains, where upwards of 512 inches of snow on average accumulates each winter, are known as the northern Japanese Alps.
The tremendous snow accumulations largely occur from December to February during the East Asian winter monsoon when sea-effect snowbands form behind frequent cold outbreaks. But their snowfall isn’t just pretty to look at and play in — extreme snowfalls combined with dense populations in cities adjacent to the Sea of Japan such as Sapporo (pop. 1.95 million) are public safety hazards, turning exceptionally deadly every year. On average 100 people die and four times that number are injured from snow and ice in Japan, not only from snow removal but also from “roofalanches” — masses of snow sliding off roofs onto people.

Similar to their counterparts downwind of North America’s Great Lakes, the Sea of Japan snowbands invite research from Japanese scientists and those in many other locales where bodies of water enhance snowfall over populated lands. A new paper in BAMS by Jim Steenburgh (University of Utah) et al. not only highlights what’s known about the Japanese snow events but also is designed to “stimulate increased collaborations between sea- and lake-effect researchers and forecasters in North America, Japan, East Asia, and other regions of the world” who can collectively realize the “significant potential to advance our understanding and prediction of sea- and lake-effect precipitation.”

Snowflake Selfies as Meteo Teaching Tools

Undergrads at Penn State recently took to their cellphones to mingle with and snap pics of tiny snowflakes to reinforce meteorological concepts. The class, called “Snowflake Selfies” and described in a new paper in BAMS, was designed to use low-cost, low-tech methods that can be widely adapted at other institutions to engage students in hands-on field research.

In addition to photographing snow crystals, students measured snowfall amounts and snow-to-liquid ratios, and then gained meteorological insight into the observations using radar data and thermodynamic soundings. The goal of the course was to reinforce concepts from their other undergraduate meteorology courses, such as atmospheric thermodynamics, cloud physics, and radar and mesoscale meteorology.

As a writing intensive course at Penn State that meets the communication skills requirement of the AMS guidance for a Bachelor’s Degree in Atmospheric Science, “Snowflake Selfies” also was designed to help students communicate meteorological science. Students shared their observations with the local National Weather Service office in State College and also wrote up their work in term papers and presented their pics and findings to the class.

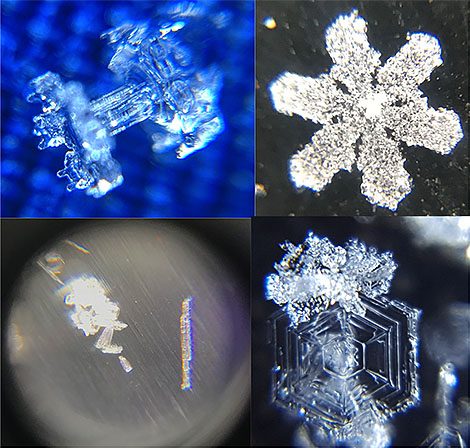
Snow crystal photographs taken by students in the "Snowflake Selfies" class.
Snow crystal photos taken by students in the “Snowflake Selfies” class.


Of course to have such a class, you need snow, and “the relative lack of snowfall events during the observational period” in winter 2018 was definitively a challenge for students, the BAMS paper states. Pennsylvania’s long winters often see many opportunities to photograph snow, but the course creators caution that perhaps a longer observational period is needed in case nature doesn’t cooperate. It also would allow students enough time to closely observe snowflakes while juggling their other classes and activities.

A survey conducted at the end of the class found that “Snowflake Selfies” was well received by students, engaging them and encouraging their introduction to field science. And they “strongly agreed [it] helped reinforce their understanding of cloud physics and physical meteorology compared to” a previous such course where students designed, built, and deployed their own 3-D printed rain gauges to measure precipitation.

Actually, that previous course sounds like a lot of fun, too!

The Perils of Rime Mushrooms

Mountain climber Dmitry Golovchenko captured tremendous video of the February 27 collapse of a “rime mushroom” atop Patagonia’s Cerro Torre. These are bulbs of massively accumulated rime—built up in the freezing of moisture in winds pounding at the peak over time. The mushrooms increase the difficulty of this infamous climb of more than 3,000 meters, but never more so than when their precariousness increases in summer—just when conditions might otherwise seem calm enough for climbing. Here is the video via an Instagram from patagoniavertical, the site of Rolando Garibotti, who co-authored a BAMS article on these infamous mushroom features:


View this post on Instagram

CERRO TORRE – Escarcha escrachadora / Crushing rime. . Esto sucedió el 27 de febrero a las 11:25am. Si hubiese habido cordadas en la Via dei Ragni, las consecuencias hubiesen sido gravísimas. El video y las fotos las tomó @golovchenko.dmitry, el conocido alpinista ruso. . Los factores que influencian la rotura de los hongos de escarcha son desconocidos, pero parece probable que se comporten como un manto de nieve, y que la combinación de gravedad, calor y humedad, puedan llevar a este tipo de ocurrencias. Esta temporada hay mucha escarcha, que con el calor veraniego, y lluvia en altura, pueden haber sido el disparador. No sabiendo cuales son los factores que afectan las capas profundas de los hongos, es difícil hipotetizar un protocolo, pero parece razonable evitar periodos con la isoterma zero por encima del pie de vía (2300m), o periodos posteriores a lluvia en altura. . Del link en nuestro perfil se puede bajar un artículo sobre la formación de la escarcha en la montaña, publicado en el boletín del American Meteorological Society, escrito por Dave Whiteman, con ayuda de quien escribe. . . . This happened on February 27th, at 11:25am. Had there been any parties on the Ragni Route, the consequences would have been serious. The video and images were shot by @golovchenko.dmitry, the well-known Russian alpinist. . The factors that influence rime mushrooms to result in break off are not known, but it seems plausible that they behave in part like a snowpack, and that the combination of gravity, heat and moisture can result in events like this one. This summer there is ample rime, which combined with heat, and rain at higher altitudes could have lead to this. Not knowing what factors affect the deeper layers of rime mushrooms, it is difficult to hypothesize a protocol to minimize exposure, but avoiding periods with the freezing-line above the base of the route (2300m) would be a wise first step. . Link in our profile to an article about rime formation in the mountains published in the Bulletin of the American Meteorological Society, written by Dave Whiteman, with help from yours truly. . #rime #cerrotorre #patagonia #chalten

A post shared by Patagonia Vertical – guidebook (@patagoniavertical) on


In their BAMS article, David Whiteman and Garibotti introduced rime mushrooms, well known to alpinists, but not previously to many meteorologists:

Rime mushrooms, commonly called ice mushrooms, build up on the upwind side of mountain summits and ridges and on windward rock faces. These large, persistent, rounded or bulbous accretions of hard rime range from pronounced mounds to towering projections with overhanging sides….[They] form when clouds and strong winds engulf the terrain. Supercooled cloud droplets are blown onto subfreezing surfaces and freeze rapidly, making an opaque “hard” rime with air trapped between granular deposits. The mushrooms are most frequent and best developed on isolated summits and exposed ridges in stormy coastal areas.

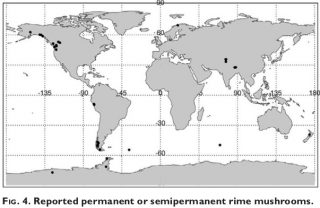
They showed the distribution of these mountain features around the world.

mushroomsThanks to Dr. Whiteman’s Univ. of Utah colleague Jim Steenburgh for bringing the video to our attention via social media. Jim’s own newly published BAMS article features the often well-rimed sea-effect snows of Japan and their similarities to lake-effect snows in the United States. The article explains how the heavy snowy accumulations of crunchy graupel (loose, rimed, large icy particles) in lowlands of the Japanese coast can be quite avalanche prone, too.
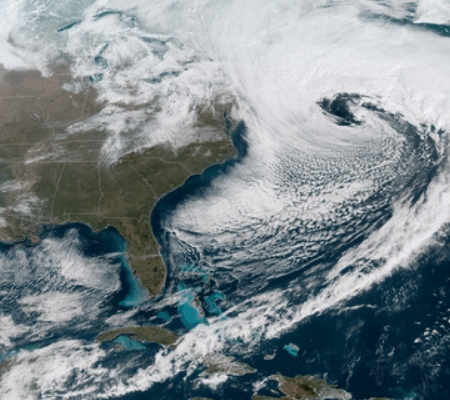
Satellites Capture Weather History in the Making

Geostationary Operational Environmental Satellite 16, now GOES-East, became operational in December and this eye in the sky is capturing stunning color weather imagery daily. Today, it’s the third nor’easter in two weeks explosively developing into a blizzard off the Northeast Coast.

GOES-16 GeoColor image of the March 13, 2018 blizzard wrapping up off the New England coast. Image from 10:47 a.m. EDT. Click here for a loop of the storm.

 
Following on the heels of the deadly and damaging storm of March 2, which cranked out onshore wind gusts of nearly 100 mph flooding the eastern New England coastline while dropping more than three feet of snow inland, and last week’s barrage of heavy wet snow that knocked out power to more than a million customers, today’s storm is delivering blizzard conditions to eastern New England, with the potential to bury the region with as much as two feet of late-season snow.
And it’s hitting on an auspicious date. Twenty-five years ago today the infamous Superstorm of 1993 (March 13-14) exploded into the history books with crippling snowfall and ferocious winds from the Gulf Coast to the Northeast, and with severe thunderstorms, tornadoes, and deadly storm surge in Florida.
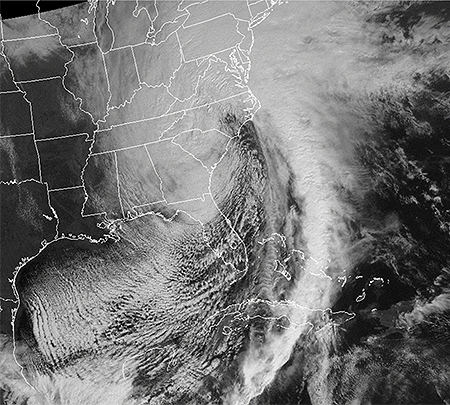
The massive comma-shaped cloud of the Superstorm of March 13-14, 1993, envelopes the entire eastern United States. Click here for an animation of this "Storm of the Century."
The massive comma-shaped cloud of the Superstorm of March 13-14, 1993, envelopes the entire eastern United States. Click here for an animation of this “Storm of the Century.”

 
GOES H, which launched on February 26, 1987, and became operational as GOES-7 captured the image of the Superstorm above.
Also known as the “Storm of the Century,” it set record-low barometric pressures across the Southeast and Mid-Atlantic states and ranks among the costliest and deadliest storms of the twentieth century, killing hundreds of people. Jeff Halverson of NASA reports in a Washington Post article the five most remarkable attributes of the Storm of the Century, including that in 2017 dollars the storm cost $10 billion.
The NWS office in Wilmington, North Carolina has an online report of the Superstorm, including its meteorological history, animated satellite imagery, observations, weather maps, links to local newspaper stories, personal accounts, photos, video, and links to technical reports on the storm.
Three papers were published in BAMS just two years following the epic storm. One was an overview of the meteorology of the storm, another looked at forecasting the storm from an operational perspective, while the third looks at what computer models of the day were seeing beforehand.
Similar to today’s blizzard, and arguably even better for such a huge event, the Superstorm of 1993 was well forecast; as many as 5-6 days in advance computer models of the day depicted it run-after-run.
What’s different today is the crisp imagery of weather systems in the Eastern United States from the most advanced GOES satellite in orbit so far. GOES-East employs an Advanced Baseline Imager (ABI) that is state-of-the-art, enabling visible and infrared imagery as well as the generation of many high-level products. A paper published in BAMS in 2017 takes a closer look at the ABI on the GOES-R series, highlighting and discussing the expected improvements of each of its attributes.

Dual Pol Radar Shedding Light on "Wintry Mix"

A recent article in the New Yorker tried in vain to dissect and understand the term “wintry mix,” only to grimly report it’s a weather phenomenon vile and disgusting and that forecasters state it to cover their backsides when a variety of winter precipitation is to descend upon man.
Far from vile and disgusting, a wintry mix is just that: a mixture of winter precipitation—snow, sleet, freezing rain—falling from the sky. No more, no less. Its mention will return to forecasts this weekend as a moisture-laden storm in the nation’s midsection plows into Arctic air and treks across the inland South and into the East next week. Rest assured: research and new technology are ready and are allowing forecasters to view wintry mix in amazing detail, better than ever before, improving predictions of the phenomena by leaps and bounds.
Recently published research on dual polarization (dual pol) weather radar in use, in a handful of AMS journals, is shining a spotlight on its capability to determine different types of precipitation falling at the same time, including the once-dreaded wintry mix. Instead of shying away from such forecasts, meteorologists using the nation’s network of Doppler radars, upgraded in recent years to include polarimetric technology, are beginning to get really good at chronicling the wintry mix in their forecasts.
While the New Yorker implied meteorologists disdain for the term, wintry mix actually is looking more beautiful than ever to scientists–so nice we put the words on the cover of the latest BAMS: “Snow Globe: Dual Pol Deciphers Wintry Mix.”
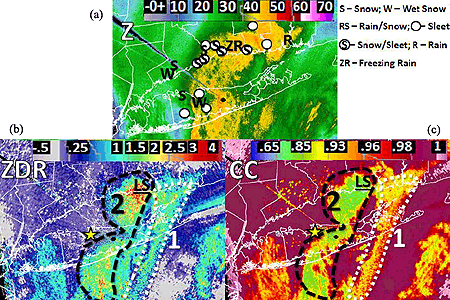
This cover article in BAMS, by Picca et al., looks at New England’s monster blizzard of 9 February 2013, which unloaded more than 3 feet of snow on much of central Connecticut and Long Island. Dual pol radar’s unique modes deciphered the wintry mix inside an intense snowband producing lightning and snowfall rates of 3-6 inches per hour.

DualPol_BAMS7
A composite of products from the dual pol radar on Long Island, New York (KOKX) shows reflectivity (ZH; top), differential reflectivity (ZDR; middle), and correlation coefficient (CC; bottom) of a heavy band of now and ice in the Northeast blizzard of 9 February 2013 (from Picca et al., BAMS). (Top) Reports of precipitation types around the time of the radar products provide ground-truth to the radar signatures. The speckled areas of reduced CC in southern Connecticut and around KOKX are a result of ground clutter. The black dot indicates the location of KOKX, and the star represents the location of the Stony Brook University surface observations. The dashed and dotted outlines indicate the two areas 1 and 2 of mixed phase precipitation. The underlined “LS” is the location of a “large sleet” report.

 
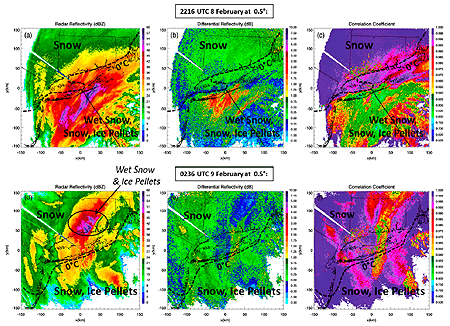
A similar article in Weather and Forecasting, by Griffin et al., documents for the first time polarimetric radar signatures of the same intense convective band of snow. The transition zone from freezing to non-freezing air (0°C isotherm) was exceptionally distinct in the radar signatures.
PPI displays of the polarimetric variables at (a)–(c) 2216 UTC 8 Feb and (d)–(f) 0236 UTC 9 Feb 2013 at 0.58 elevation. The 08C RAP model TW at the surface is overlaid (boldface, dashed). At 2216 UTC, pure dry snow was located within colder temperatures north of the 08C isotherm, while wet snow and mixed-phase hydrometeors occurred within warmer temperatures south of the 08C isotherm in (a)–(c). The solid black line indicates the location of the 1448 azimuth RHI. At 0236 UTC, dry snow was predominant, while wet snow and ice pellets were also observed within the max ZH region, within negative surface temperatures, north of the 08C isotherm in (d)–(f).
Displays of the polarimetric (i.e., dual pol) variables at (a)–(c) 2216 UTC 8 Feb and (d)–(f) 0236 UTC 9 Feb 2013 — during the Northeast blizzard (from Griffin et al., WAF). At 2216 UTC, pure dry snow was falling within colder temperatures north of the model-indicated 0°C isotherm (bold black dashed line), while wet snow and mixed-phase hydrometeors occurred within warmer temperatures south of the 0°C isotherm in (a)–(c).  At 0236 UTC, dry snow was predominant, while wet snow and ice pellets were also observed within the max ZH region, within below-freezing surface temperatures north of the 0°C isotherm in (d)–(f).

 
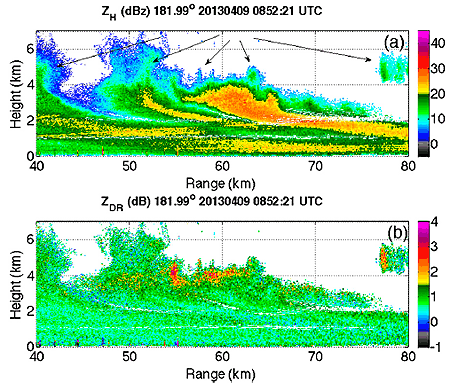
In the Journal of Applied Meteorology and Climatology (JAMC), the article by Kumjian et al. discusses the use of intensive radar measurements to study the finescale structure of more than a dozen Colorado Front Range snowstorms. And in Monthly Weather Review, Geerts et al. explain in their article how a specifically synthesized dual Doppler radar technique in an airborne platform was able to directly measure hydrometeor vertical motion, improving the accuracy of the radar.
CSU-CHILL RHI along the 181.998 azimuth at 0852 UTC 9 Apr 2013 for (a) ZH and(b) ZDR. Arrows show the locations of generating cells.
Vertical slices through a 9 April 2013 Colorado snowstorm from Colorado State University’s CHILL dual-pol radar show (a) reflectivity (ZH) as well as (b) differential reflectivity (ZDR), which indicates particle shape and size (from Kumjian, JAMC). Arrows show the locations of generating cells.

 
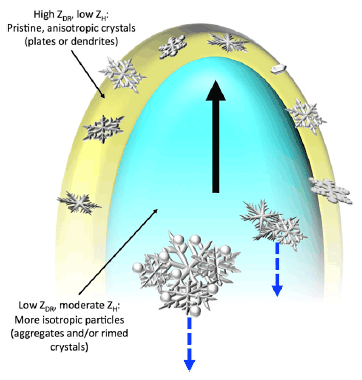
Conceptual model of a vertical slice through a generating cell with a shroud echo with example particle types present. The shroud of large ZDR and low ZH values (yellow color) indicates the presence of pristine anisotropic crystals with platelike or dendritic habits. The core of the generating cell (bluish color) is characterized by more snow aggragates or rimed crystals, the larger of which are descending (blue dashed lines) The core is also where the strongest updraft speeds (and thus supersaturations with respect to ice) are located, indicated the black vertical arrow).
In Kumjian’s JAMC article, a conceptual model of a vertical slice through a generating snow cell reveals example particle types. The yellow color indicates the presence of pristine anisotropic snow crystals with platelike or dendritic habits. The core of the generating cell (bluish color) is characterized more by snow aggragates or rimed crystals, the larger of which are descending (blue dashed lines) The core is also where the strongest updraft speeds (black arrow) are located.


Commutageddon, Again and Again

Time and again this winter, blizzards and other snow and ice storms have trapped motorists on city streets and state highways, touching off firestorms of griping and finger pointing at local officials. Most recently, hundreds of motorists became stranded on Chicago’s Lake Shore Drive as 70 mph gusts buried vehicles during Monday’s mammoth Midwest snowstorm. Last week, commuters in the nation’s capital became victims of icy gridlock as an epic thump of snow landed on the Mid Atlantic states. And two weeks before, residents and travelers in northern Georgia abandoned their snowbound vehicles on the interstate loops around Atlanta, securing their shutdown for days until the snow and ice melted.
Before each of these crippling events, and historically many others, meteorologists, local and state law enforcement, the media, and city and state officials routinely cautioned and then warned drivers, even pleading with them, to avoid travel. Yet people continue to miss, misunderstand, or simply ignore the message for potentially dangerous winter storms to stay off the roads.
Obviously such messages can be more effective. While one might envision an intelligent transportation system warning drivers in real time when weather might create unbearable traffic conditions,  such services are in their infancy, despite the proliferation of mobile GPS devices that include traffic updates. Not surprisingly, the 2011 AMS Annual Meeting in January on “Communicating Weather and Climate” offered a lot of findings about generating effective warnings. One presentation in particular—”The essentials of a weather warning message: what, where, when, and intensity”—focused directly on the issues raised by the recent snow snafu’s. In it, author Joel Curtis of the NWS in Juneau, Alaska, explains that in addition to the basic what, where, and when information, a warning must convey intensity to guide the level of response from the receiver.
Key to learning how to create and disseminate clear and concise warnings is understanding why useful information sometimes seems to fall on deaf ears. Studies such as the Hayden and Morss presentation “Storm surge and “certain death”: Interviews with Texas coastal residents following Hurricane Ike” and Renee Lertzman’s “Uncertain futures, anxious futures: psychological dimensions of how we talk about the weather” are moving the science of meteorological communication forward by figuring out how and why people are using the information they receive.
Post-event evaluation remains critical to improving not only dissemination but also the effectiveness of warnings and statements. In a blog post last week following D.C.’s drubbing of snow, Jason Samenow of the Washington Post’s Capital Weather Gang (CWG) wondered whether his team of forecasters, and its round-the-clock trumpeting of the epic event, along with the bevy of weather voices across the capital region could have done more to better warn people of the quick-hitting nightmare snowstorm now known as “Commutageddon.” He concluded that, other than smoothing over the sometimes uneven voice of local media even when there’s a clear signal for a disruptive storm, there needs to be a wider effort to get the word out about potential “weather emergencies, or emergencies of any type.” He sees technology advances that promote such social networking sites as Twitter and Facebook as new ways to “blast the message.”
Even with rapidly expanding technology, however, it’s important to recognize that simply offering information comes with the huge responsibility of making sure it’s available when the demand is greatest. As CWG reported recently in its blog post “Weather Service website falters at critical time,” the NWS learned the hard way this week the pitfalls of offering too much information. As the Midwest snowstorm was ramping up, the “unprecedented demand” of 15-20 million hits an hour on NWS websites led to pages loading sluggishly or not at all. According to NWS spokesman Curtis Carey: “The traffic was beyond the capacity we have in place. [It even] exceeded the week of Snowmageddon,” when there were two billion page views on a network that typically sees just 70 million page views a day.
So virtual gridlock now accompanies road gridlock? The communications challenges of a deep snow continue to accumulate…

Nowhere to Hide from Snow . . . Except Florida

It snowed throughout the Northeast on Wednesday, but very few are feeling sorry for everyone in that region who had to pull out their shovels. The odds are good that you or someone you know in your state has had to deal with snow lately, too–no matter where you live in the country. According to the NWS’s National Operational Hydrologic Remote Sensing Center, which collects snow cover and depth data from ground reports and satellite observations, 49 of the 50 states currently have some snow cover…even Hawaii (this video was taken last month)! Only Florida has avoided a recent visit from Jack Frost.

Cambridge, Massachusetts, or Anytown, USA?

This isn’t an unprecedented event–in fact, all 50 states had snow on the ground last February 12th, and University of Oklahoma meteorology student and AMS student member Patrick Marsh obtained pictures from every state of that day’s snow.
But “it’s not typical,” says James Peronto, public affairs officer for the NWS, who noted that recent snowfall throughout the Southeast has created the unusually white map.
“The Southern states don’t typically get significant snow amounts through the year,” Peronto said. “It takes a special kind of weather scenario to allow that to happen.”
(This quick history lesson on Southern snow illustrates how rarely such a scenario occurs.)
NWS observations show that 70.9% of the country was covered by snow as of yesterday, compared to an average of 35% snow cover in December.
A NOAA map of U.S. snow depth and cover yesterday.

Snow cover and depth analyses like these are not just for interstate precipitation bragging rights or cabin-fever consolation. At the AMS Annual Meeting in Seattle, a number of science presentations will show the value of snow cover observations.
For example, Patricia de Rosnay et al. will present recent “major changes implemented” in the operational surface analysis of the European Center for Medium-range Weather Forecasting’s Integrated Forecasting System,” including a method of combining satellite observations of snow cover for the land surface conditions for weather modeling. (Tuesday, 25 January, 1:45 p.m.; WSCC 611).
Sujay Kumar et al. (poster 42, 9:45 a.m.-11:15 a.m., Tuesday, 25 January), will discuss snow cover from active microwave remote sensing and look at the value of assimilating snow observations from multiple satellites for hydrological modeling. They point out that “Snow conditions on the land surface are … key components of the global hydrological cycle as they play a critical role in the determination of local and regional climate.”
One way in which this is true is in regions where melted snow dominates water supply. On Thursday 27 January (4:15 p.m., WSCC 611) Randal Koster et al. will “examine how knowledge of mid-winter snow accumulation and soil moisture contributes to our ability to predict streamflow months in advance.” In an experiment with multiple land surface models,  “snowpack information by itself contributes, as expected, to skill attained in streamflow prediction, particularly in the mountainous west.” (They go on to show the additional importance of soil moisture conditions to long-lead forecasts, particularly in winter.)
Meanwhile, as a basis for the observations used in such studies, Ding Liang et al. (Poster 595; 8:30 a.m-4 p.m., Wednesday, 26 January) will delve into improvements for modeling of microwave emissivity of snow—an important step toward constructed improved snow cover data retrieved from satellite remote sensing.