A Year Ago in Oso: Wrong Place at the Wrong Time

At 10:36 a.m. on 22 March 2014, near Oso, Washington, the earth began to move.  At first the lower section of slope rising from the North Fork Stillaguamish River slipped. Then the rise above that collapsed, ultimately sliding so fast that nothing could stand in its way. An eyewitness near the river saw water tossed aside and turn black. A 30 m high wall of turbulent earth roared across and along the valley. About 8 million cubic meters of dirt and rock buried the village of Steelhead Haven and killed 43 people. The slide ultimately dammed the river as it raced at 60 km/h along a 1 km wide, 1 km long swath. USGS_MR_Oso_Aerial_clipped_adjusted
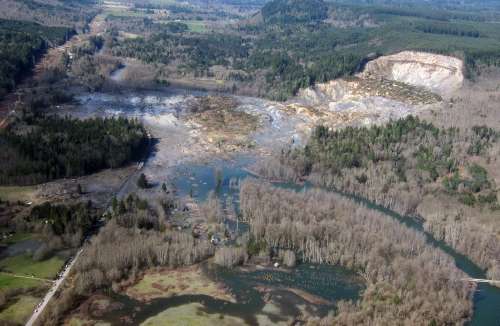
The Oso landslide (aftermath photo above, Mark Reid/USGS) was a scientific mystery. There was no obvious geological trigger, like an earthquake. And the slope itself, while prone to slides, was not precariously steep. Meteorologically, it was a rain-free day in a week of no precipitation. However, two new studies—one of them forthcoming soon in the Journal of Hydrometeorology—show why Steelhead Haven was in the wrong place at the wrong time, both geologically and meteorologically.
An overview paper this January in Earth and Planetary Science Letters showed how the Oso landslide underwent two stages of motion. The lower slope slipped slowly for about 50 seconds until the more radical collapse from above led to a high mobility liquid state called a “debris avalanche.” As the landslide spread across the river the debris picked up more moisture. The flow of dirt and rock spread the damage far beyond the initial slip of earth. The gushing mud and rock actually splashed against the opposite slope across the river and spread back upslope on top of itself.
Previous landslides in the Oso area had never attained that extremely mobile second stage. The slope of the 180 m high rise above the river is less than 20 degrees, and scientists have found highly mobile landslides usually start with greater than 20 degree slope—typically more than 30 degrees. What made this one different?
The paper’s authors, Iverson et al. say one reason was the porous geology of local sediments and silt. This porosity may have increased suddenly as the base of the slope started to slip. Then as ground slid the pores contract, raising water pressure and increasing liquefaction that greases the skids for faster movement and more contraction. Furthermore, as rock and dirt overran the river, the slide picked up another 50,000 cubic meters of water and scoured the river bed for more debris.
But if a critical sensitivity to initial geological conditions existed why did the land give way on a sunny day like 22 March 2014 instead of during an earlier, rainier part of the season?
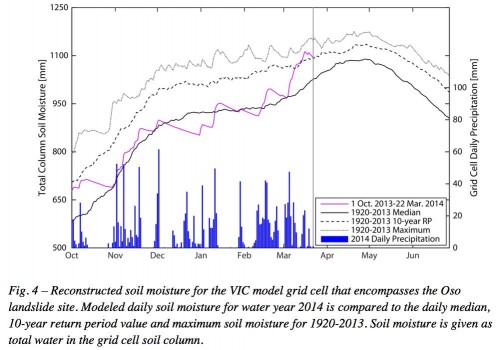
The analysis by Brian Henn et al. in Journal of Hydrometeorology shows that the precipitation in the three weeks before the landslide was unexceptional (such periods are expected every two years or so) if compared to the soaking that the area can get during the rainy season. But the rain was exceptional (an 88-year expected return period) when compared to similar March periods of the past, and that is a bad time to get wet.
Since March is late for the rainy season, this meant additional water charged deep soils that were already wet. Heavy rains earlier in the year encountered soils that contained less moisture. The late rains came on top of an already wet season as well as four wet years before that.
OsoFigure

As a result, six days before the landslide soil moisture for the water year peaked and was wetter than would be expected every 40 years at that date. The soil moisture had surged beyond median levels in just a few weeks. [See figure above from Henn et al. 2015]
In other words, Oso was primed for a landslide, even on a dry day, partly because some of the rain had fallen late in the season—poor meteorological timing for the village of Steelhead Haven.
Science Run Amuck


Let no one claim that student hydrologists do not gain a deep understanding of their subject. The University of Wisconsin-Parkside press release explains:

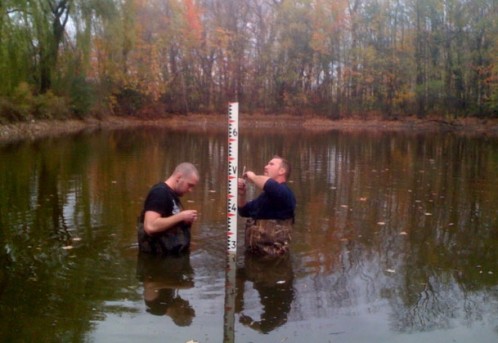
Students continue to use the campus environment as a natural laboratory. The latest case of this is the recent installation of a water level gauge in Greenquist Pond by researchers from Geosciences Professor John Skalbeck’s Environmental Sampling, Monitoring, and Assessment (GEOS 445) course.
Students Jacob Jazefowski, left in the above photo, and John Rasch pulled on hip waders and immersed themselves in their research work. Greenquist Pond will soon be filled and the gauge they installed will monitor future pond water levels.
Students in this course are assessing groundwater levels from campus monitoring wells and measuring water quality in the pond and in the Pike River. They are investigating wetland soils, vegetation, and hydrology characteristics near the Pike River and in the Willow Swamp near the campus’ Wood Road entrance and are evaluating the potential for additional rain gardens to capture storm water from Ranger Hall.
“The different types of soils, water lands, and bodies of water on our campus provide an ideal outdoor laboratory for this course, which is highly experiential-based,” Skalbeck said.

Follow the Water

As the world’s population grows, so does water usage. As a result, the rate we pump water out of the ground to satisfy our thirst and, more frequently, the thirst of the plants we grow, has been exceeding the rate that precipitation can replenish that water. From the news page of the International Groundwater Resources Assessment Centre about a study in Geophysical Research Letters:

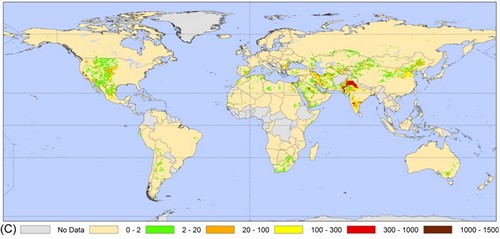
The results show that the areas of greatest groundwater depletion are in India, Pakistan, the United States and China. Therefore, these are areas where food production and water use are unsustainable and eventually serious problems are expected. The hydrologists estimate that from 1960 to 2000 global groundwater abstraction has increased from 312 to 734 km3 per year and groundwater depletion from 126 to 283 km3 per year.

The gravity of the water situation: relative ground resource depletion rates. Note the prominent depletion in the central United States: Steven Mauget of the US Department of Agriculture will discuss a new software tool for agricultural water management in the Ogallala region (Wednesday, 26 January) at the upcoming AMS Annual Meeting.

Not only does the depletion threaten food supplies in the long run, but it also adds to global level rise. The GRL article quantified this effect, showing that a quarter of the sea level rise since 2000 is due to aquifer depletion. Water that would have stayed underground 50 years ago is now used by people and their plants, then evaporated; eventually most of it finds its way back to the oceans.
As Roger Pielke points out in a recent post, there is much to be learned about the effect of this water on climate. Not all water under the surface of  the Earth is a renewable resource. While some aquifers indeed are readily replenished by recent precipitation, others have been (or were) locked away from ground sources for many years, due to geology. These isolated reserves, called “fossil water,” were formed long before humanity and have yet to be adequately inventoried. Some of them, like the Ogallala aquifer, have been tapped for agriculture. Thus fossil water is being returned to the water cycle (hence, climate) after a long absence.
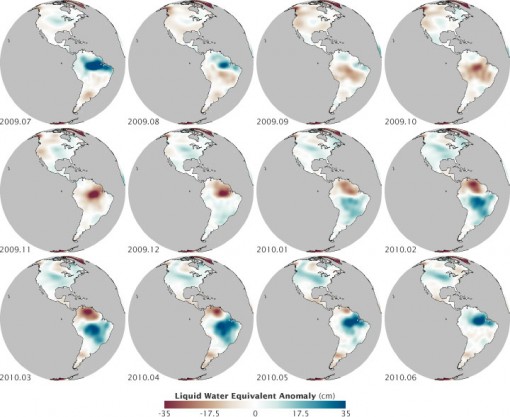
All of this fuss over emptying ground water is a good introduction to the “image of the day” from NASA’s Earth Observatory. Not surprisingly, heavy liquid shifting to and from land has a significant local effect on the gravitational pull of the planet. (Fluctuations of the water table are also hypothesized by some geologists to trigger mid-continental plate earthquakes, but that’s an obscure intersection of geology and meteorology, reviewed in this month’s Bulletin of the Seismological Society of America, to explore in your spare time.) The gravitational effect of water is the basis of water distribution observations from the GRACE (Gravity Recovery and Climate Experiment) mission:

the satellites measured how Earth’s gravity field changed as water piled up or was depleted from different regions at different times of year.

Below is GRACE data from 2009-10 mapped by NASA’s Robert Simmons, showing how the water year giveth (blue) and taketh away (red). (There will be more on watching water resources carefully from space in presentations at the AMS Annual Meeting, including NASA’s David Toll on the NASA Water Resources Program on Tuesday 25 January.)

The Storm That Started a Drought?

by Robert V. Sobczak, National Park Service, Big Cypress National Preserve.
Reposted from his blog, The South Florida Watershed Journal.
Do all storms end with drought?
I know you’re thinking. I mean the opposite instead:
That “all droughts end with a flood,” right?

Deer Creek
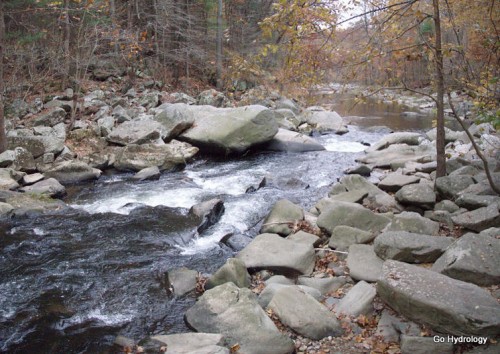
Deer Creek, Maryland at low-water autumn ebb.

A meteorologist in the snow-bound climes of the Red River Basin introduced me to the latter saying. To what degree it holds any statistical truth I cannot say. My initial gut reaction was that an observational bias was in play, plus some seasonal slight of hand. But no matter how much I tried to deny it, the saying kept sneaking up on me wherever I roamed.
Take Tropical Depression Nicole for example. It threatened to make our already high-water rendition of the Big Cypress Swamp all the more wetter but by the flap of the wings of the butterfly bypassed to the east and then onward north to the Atlantic Coast where it drenched those watersheds instead.
Now here’s the catch:
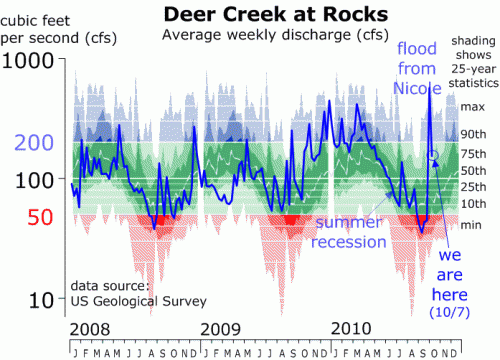
Those watersheds were at the end of their seasonal drought, better known as the summer recession, transforming currents from trickles into torrents overnight.
So yes, chalk one on the board for that old reliable saying!

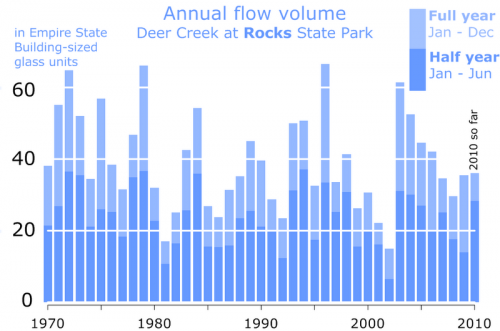
Case in point is Maryland’s Deer Creek, as measured at Rocks State Park (or just “Rocks” as us Harford Countians call it). Thanks to Nicole it now has a chance to top 40 Empire State Buildings (ESBs) worth of water flow for the year. That would make it an above average year, but not a “chart topper,” a term I reserve for the biggest of big flow years which pass 60 or more ESBs worth of water. That’s happened just four times in the modern era (aka my lifetime), the most recent of which (2003) which was, as predicted by that old reliable saying, preceded by the drought of record in 2002 when less than 20 ESBs worth of water flowed through Maryland’s famed Rocks State Park for the year.
Ha, there it is again! So, cherry picking not withstanding, I guess that means that, yes, all drought do seem to end with floods.

Does the same saying apply to the Florida swamps?
Seasonally it happens each year with our winter dry season. By spring the swamps are nearly 100 percent water free and crunchy, just a single lightning strike away from an uncontrollable blaze. But along with the lighting are the thunder that beckon the wet season’s arrival … and the floods that will soon be to follow.
Which brings me back to Nicole:
Instead of flushing flood waters even higher into the swamp it paradoxically reversed the tables by ushering in a week’s worth of dry air in its wake instead.
Meteorologists are calling it an early start to the dry season.

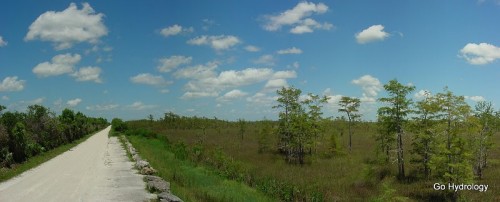
Loop Road near Gator Hook Strand at the wet-season peak.

Or in other words…
Call it the storm that started the drought!

Walking a Fine Hydrologic Line

by Robert V. Sobczak, National Park Service, Big Cypress National Preserve.
Reposted from his blog, The South Florida Watershed Journal.

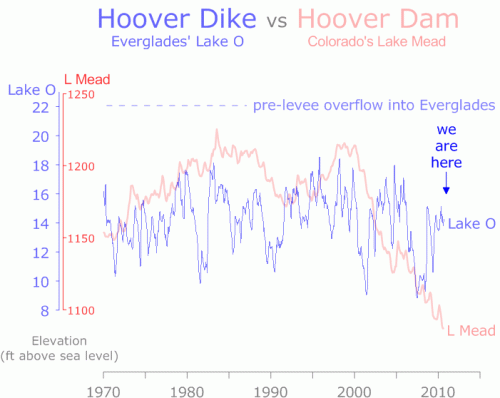
Are Florida’s Lake Okeechobee and Colorado River’s Lake Mead comparable?

After all, a Hoover Dam (or dike) surrounds them both.

Lake O bounces from deep drought to levee-lapping flood stage from one year to the next. We’ve had two deep drops into drought this past decade: the first in 2001 and the second (and longer one) in 2007, plus those couple high years during the hurricane frenzy of 2003-2005.
Keep in mind the difference between extreme drought (9 ft above sea level, 1.7 million acre feet) and extreme flood stage (18 ft above sea level, 5.3 million acre feet) is less than 10 feet.

Compare that to Lake Mead’s decade-long decline:
In 1999 it was flush at over 1200 ft above sea level high and holding 28 million acre feet of water, but has steadily dropped ever since.
Current stage is around 130 feet lower and only 10 million acre feet (and dropping). Here’s a recent article describing how water planners are trying to cope.
Why the difference?
Flat south Florida is rain rich but storage poor, while the arid West has storage galore (with its deep canyons) but not much rain …
And more recently, hardly any snow melt either.

“The drought can’t last forever,” Western water planners seem to think/hope.
Here in Florida, as much as we like seeing those storms veer away “safely out to sea,” the Lake is a couple more near misses and a dry (and warm) La Niña winter ahead from a plummet into spring time drought.
On the other hand, all it takes is one big “rain maker” to send us up into flood stage.
Florida walks a fine line between flood and drought.