As we mentioned in the first post in this series of potential “Virtual” Pathways through the rich AMS Annual Meeting program of parallel conferences, this year’s overarching theme is especially powerful:
“Strengthening engagement with communities through our science and services.”
This is a statement of needs, accomplishments, and future priorities all in one. After the recognitions so many people have had in 2020—a year of isolation and social distancing, of reliance on community, and of recognition that science is at the heart of cures and solutions for society, but also the recognition that the progress of science depends on cooperation with the greater community—the Annual Meeting theme guiding the program offerings reflects not only powerful future directions for the weather, water, and climate community, but also the unique experience of the year 2020.
Community Engagement is a viable pathway through the meeting—we can only touch on a few highlights of this path, because AMS members have resoundingly responded to the call for presentations on the theme with many perspectives on the need for community engagement. Many of your colleagues have been forging ahead already by forming their science, services, and products as a part of a community engagement process.
As he often does, AMS Associate Executive Director William Hooke gets to the heart of the issue, encapsulating the theme in a marriage metaphor in his Core Keynote for the Conference on Societal Applications, “Let’s Get Hitched.”
The metaphor of a marital commitment between scientists and communities expresses a shared destiny, as Hooke explains in his abstract:
… we need to build community relationships that are founded on trust and equity; that celebrate cultural and other forms of diversity, but focus on shared purposes that can’t be achieved except through concerted effort; that can accommodate social change and accompanying scientific and technological advance; and that offer joy and satisfaction in the moment, while ratcheting the community and even the larger world toward a better place over the long haul. Success requires we remain motivated, (multi-) disciplined and evidence-based in our approach toward these ends over a sustained period of years. Sound familiar? Perhaps it should; it mirrors attributes of successful engagements of a more romantic sort.
Hooke sets the stage for seeing this ongoing integration of community engagement through many steps of the scientific process—as a natural outgrowth of the focus on social justice that many presenters are bringing to the AMS Annual Meeting.
In the previous Front Page post, we traced a virtual pathway through the meeting for attendees who are interested in social justice. So, naturally, one could construct a similar pathway through the meeting devoted to Community Engagement. We’ll propose an abbreviated path of that kind—just touching on a few of the highlights by hopping between some of the conferences. Naturally because this is the meeting theme itself, there are potential discussions about Community Engagement in almost every session. It’s going to be a special meeting and a busy week, if this is your particular interest.
And you might as well follow Hooke’s presentation with a double dose of community engagement in this Core Science Keynote from Vernon Morris (Arizona State University), bringing together the mutual interdependence of social justice and community engagement themes:
“A Tale of Two Cities: Comparing Lessons Learned from Community Engagement in Geohealth/Environmental Justice Studies in Washington, D.C., and Gondar, Ethiopia.”
From the abstract we learn that the presentation discusses dual projects in communities at the nexus of air quality – health research. The work for an open-air hospital in Northern Ethiopia involved medical doctors, pharmacists, virologists, and microbiologists….and “the scope of the study was significantly modified based on community engagement,” Morris states. “The additional diversity in perspective inspired novel inquiry, drove creativity in the implementation of the study, and resulted in greater use-inspired research.”
Morris’s presentation is one of many that offer practical experience in community engagement.
For example, at the Conference on Transition of Research to Operations,”Nicholas Schmidt (National Ocean Service) is presenting “NOAA’s Digital Coast—A Service Delivery Best Practice.” He writes:
The Digital Coast is … a website focused on providing the data, tools, and training coastal communities need to protect their citizens, infrastructure, and economy from coastal hazards and other threats. The Digital Coast …is successful because of the Digital Coast Partnership, a group of eight non-profit organizations who work with NOAA providing input for the effort. The Digital Coast is built on the interaction between the Digital Coast Partners and user community and the website… Effective implementation of service delivery requires relationships between information producers and consumers built on mutual trust and respect. Key to developing and maintaining these relationships is sustained engagement and collaboration that will facilitate the integration of services into actionable information.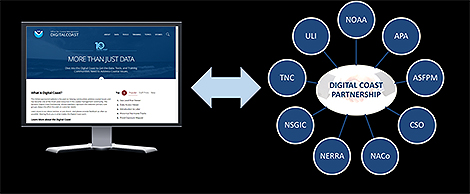
A number of presentations emphasize the need for translation of meteorological terms into Spanish as part of better service to Spanish speaking communities of the United States.
Community Feedback and Participation
The Annual Meeting will showcase a variety of ways to elicit feedback and participation from community members For example …
In the Conference on Environment and Health, Margaret Orr (NOAA, George Mason University) presents “Lessons Learned from Heat Watch Interviews.” The interview process offers a hybrid of objective “Citizen Science” participation and subjective opinions from the community. She writes:
While satellite data is effective in identifying urban heat islands, ground-level measurements help tell the full story on a more personal and local level, and community engagement is necessary for publicizing data and galvanizing reform. The Heat Watch program, a collaboration between NOAA and CAPA Strategies, engages community scientists in taking air temperature measurements via car or bicycle to create detailed maps of urban heat islands throughout cities. Through interviews with city officials in the 2020 Heat Watch cohort, it was found that the program’s resulting data and anecdotal observations were significant and spoke directly to community concerns about heat. Participants indicated that the personalization of the heat island phenomenon, community engagement through citizen science, and the emphasis on heat’s effects on health and infrastructure were drivers for other city officials and agencies to implement solutions to the heat island problem.
On the other hand, these days the objective and subjective collection of community feedback and channeling of participation is possible through social media. Indeed, this presentation from Iain McConnell (University of Wisconsin-Madison), “Modeling Public Attention to Weather Alerts in Social Media” takes advantage of microblogging in the public as a vehicle for understanding public attention and response to warnings, but it is easy to imagine how such techniques could also constitute an advance in community engagement through objective/subjective gathering of community feedback timely enough to empower participation in the weather warnings process. McConnell writes:
Here tweets are collected relating to US weather alerts reported by the National Weather Service. For each alert event the public’s interaction with the evolving weather hazard information system is documented. The severity of the alerts (e.g., warned or not) is compared to the degree of public interaction. The public response is then generalized via a model that predicts the public response to a given weather alert. The prediction includes the expected degree of response, and from which part of the public this would be expected, for example weather enthusiasts or the general public. This approach may uncover ways to strengthen engagement of the community with weather forecasting through Twitter.
Of course, you could argue that this is an advance parallel to the movement toward connected vehicles in surface transportation, an extension of the Internet of Things world to driving and weather forecasting—the real-time data-sharing and engagement between the community that drives and the scientific community that forecasts For more on that, see the presentation by Danny Cheresnick et al. (Global WeatherCorp), “Improving Operational Road Weather Forecasts with Connected Vehicle Data,” in the Conference on Environmental Information Processing Technologies.
In the Conference on Atmospheric Chemistry, Lucy Piacentini (City College New York) et al. are presenting a web-based means for connecting qualitative feedback from community members with high resolution satellite information. In “Connecting Communities and Research: The Urban Heat Island Effect in Bedford-Stuyvesant, Brooklyn, New York,” they write:
In partnership with the Magnolia Initiative community advocacy group in Bedford-Stuyvesant, Brooklyn, New York, various facets to increase community engagement in STEM (Science, Technology, Engineering and Math) in general and in the geosciences in particular, were explored.
Using Landsat 8 and Moderate Resolution Imaging Spectroradiometer (MODIS) Aqua satellite data, comparisons were made between the land surface temperatures of Bedford-Stuyvesant and other neighborhoods within New York City. Micro-level survey data was also collected from Bedford-Stuyvesant residents to assess factors that contribute to heat wave exposure and heat-related health risks. The COVID-19 pandemic has created an importance in connecting with the community in a socially distant setting. Interactive maps and a website were developed on an online platform for the community to emphasize how socioeconomic and geophysical factors compound to exacerbate the urban heat island effect in the community.
Preliminary results show that Bedford-Stuyvesant is one of the most heat vulnerable communities in New York City and highlight the importance of sharing mitigation and adaptation strategies with community-folk in a manner that they can comprehend and easily implement in a neighborhood bid for sustainability and the amelioration of heat-health risks. The survey and the interactive map have been implemented and have proven to be a positive community engagement tool!”
At the Symposium on Diversity, Equity, and Inclusion, Carolyn S. Brinkworth (UCAR) et al. are presenting “Cocreating Hydrological Research between Earth Science Institutions and Indigenous Scientists and Communities: Success Stories and Lessons Learned.” Previewing it, they state:
In 2016, a group of Earth Science organizations and Indigenous scientists affiliated with the Rising Voices Center for Indigenous and Earth Sciences worked together to submit an ANSF proposal … to bring together NCAR scientists with Indigenous communities to co-develop research of mutual interest and benefit; to involve Indigenous undergraduate and K-12 students in that research as part of a pathway into the geosciences; and to provide Indigenous mentorship to the NCAR scientists to help them create culturally responsive spaces for the communities and students they were working with, and to develop guidance and good practices for Earth science institutions wishing to develop similar partnerships in the future.
Here we describe the challenges encountered in implementing the project as planned, the changes we made in order to be responsive to the situations, the ultimate successes that emerged from the communities and students we engaged through the re-imagined program, and the lessons learned for future collaborations.
In community engagement at an even larger scale—for full cities, across the world: Susan C. Anenberg (George Washington University) is presenting an invited Core Science Keynote on “Recent Advances in Integrating Climate Change, Air Quality, and Public Health into Urban Decision-Making.” She writes:
Cities contribute the majority of greenhouse gas emissions globally, are challenged by high air pollution levels, and experience substantial health disparities. Many cities are committing to dramatic reductions in greenhouse gas emissions and in sustainability improvements. These actions have the potential to mitigate climate change globally and over centuries, as well as improve air quality and public health locally and in the near term. Decision-support tools to assess climate, air quality and health benefits of alternative emission policies exist at the national scale, but are not widely available at the city scale, where clean air interventions are often targeted. This talk will address recent advances …[among many things]… novel methods and tools for integrating climate change, air pollution, and public health into urban decision-making on clean air interventions, including in efforts led by the Climate and Clean Air Coalition and C40 Cities.
An Invitation to Crowdsource: Citizen Science as Community Engagement
In this AMS Annual Meeting “citizen” or “community” science appears frequently, as it has in previous years’ meetings, but in the context of this meeting’s overall theme. The projects that solicit nonscientists to collect data and/or analyze data or imagery can be seen as a special participatory form of community engagement. In fact, in the spirit of crowdsourced science, we’ll go ahead now and invite you to share your favorite citizen science examples from the Annual Meeting—including your own presentations—in the Comments section of this Post. And furthermore, send comments with your recommendations for non-traditional viable virtual pathways that you see through the Annual Meeting program this year.


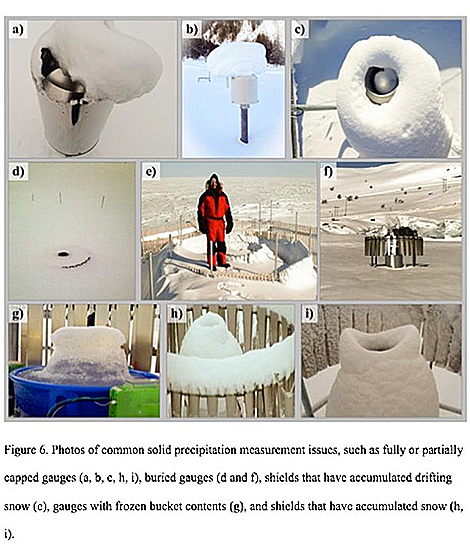 Meanwhile, Kochenderfer et al. note a proliferation of automated gauges and new non-catchment methods that involve using laser disdrometers and “present-weather” detectors to remotely determine what type of precipitation is falling.
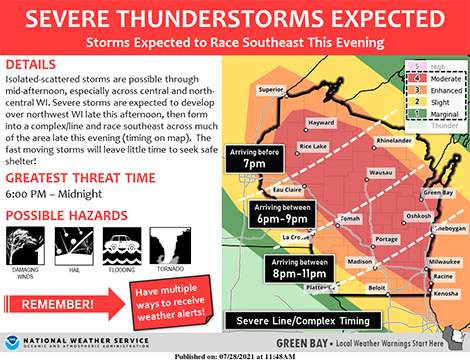
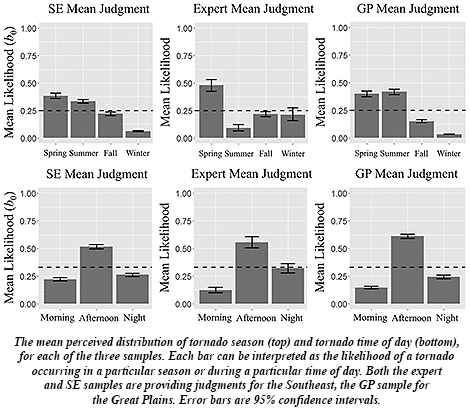 For starters, unlike in infamous “Tornado Alley” states of Texas and Oklahoma north through Nebraska and Iowa into South Dakota, the Southeast lacks a single, “traditional” tornado season, with tornadoes “spread out across different seasons,” Broomell along with his coauthors report, including wintertime. The Southeast also endures more tornadoes overnight, as happened last week in North Carolina. And they spawn from multiple types of storm systems in the Southeast, more so than in the Great Plains. This makes knowledge about residents’ regional tornado likelihood especially critical in Southeastern states.