Website Tracks Public Understanding of Tornadoes

Imagine you live in a part of the country where few people have experienced tornadoes. It would make sense that your neighbors wouldn’t know the difference between a tornado watch or warning, or know how to seek safety.

A new, openly available online tool shows exactly that, by combining societal databases with survey results about people’s understanding of weather information. But there are some surprising wrinkles in the data. For example, the database drills down to county-level information and finds “noteworthy differences” within regions of similar tornado climatology.

How is it that Norman, Oklahoma, residents score higher in what people think they know of severe weather information than those in Fort Worth, Texas? And why is there a similar gap between what people actually do know, as tested in Peachtree City, Georgia, versus Birmingham, Alabama?

“Differences like this create important opportunities for research and learning within the weather enterprise,” say Joseph T. Ripberger and colleagues, who describe the weather demographics tool in a recently published Bulletin of the American Meteorological Society article. “The online tool—the Severe Weather and Society Dashboard (WxDash)—is meant to provide this opportunity.”

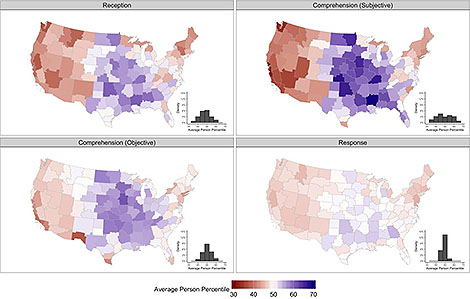
For example, in one key set of metrics, the WxDash website looks at survey data on how well people receive and pay attention to tornado warnings (reception), how well they understand that information (both “subjective” comprehension—what people think they know—and “objective” comprehension—what they actually know), and response to tornado warnings.

From the BAMS article, a figure showing knowledge and response to average person percentile (APP) estimates of tornado warning reception, subjective comprehension, objective comprehension, and response by county warning area (CWA). The inset plots indicate the frequency distribution of APP estimates across CWAs. These estimates compare the average percentile of all adults who live in a CWA to the distribution of all adults across the country. For example, an APP estimate of 62 indicates that, on average, adults in that CWA score higher than 62% of adults nationally. The range of APP scores is wide. CWAs range from 38 to 61 on the reception scale, 32 to 69 on the subjective comprehension scale, and 37 to 60 on the objective comprehension scale. Response scores vary less. Not surprisingly, all categories broadly reflect the higher frequency of tornadoes in middle and southeastern CWAs.


WxDash combines U.S. Census data with an annual Severe Weather and Society Survey (Wx Survey) by the University of Oklahoma Center for Risk and Crisis Management. The database then “downscales” the broader scale information to the local level, in a demographic equivalent to the way large scale climate models downscale to useful information on regional scales.

The site also provides information on public trust in weather information sources, perceptions about the efficacy of protective action, vulnerability to beliefs about a variety of tornado myths, and other weather-related factors that can then be studied in light of regional and demographic factors.

Some of the key findings seen in the database:

  • Men and women demonstrate roughly comparable levels of reception, objective comprehension, and response, but men have more confidence in subjective warning comprehension than women.
  • Tornado climatology has a relatively strong effect on tornado warning reception and comprehension, but little effect on warning response.
  • The findings suggest that geography, and the community differences that overlap with geographic boundaries, likely exert more direct influence on warning reception and comprehension than on response.

Even the relatively expected relation of severe weather climatology to severe weather understanding is problematic, Ripberger and colleagues write.

Tornadoes are possible almost everywhere in the US and people who live on the coasts can move—both temporarily and permanently— throughout the country. These factors prompt some concern about the low levels of reception and comprehension in some communities, especially those in the west.

In addition to interacting with these data, you can download one of the calculated databases for community-scale information, the raw survey data, and the code necessary to reproduce the calculations.

The idea is social scientists can dig in and figure out why what we know about weather isn’t nearly as closely correlated with what we experience as we might think. The hope is an improvement in public education and risk communication strategies related to severe weather.

Japan’s “Gosetsu Chitai” (Heavy Snow Area) Illuminates Sea- and Lake-effect Precip Processes

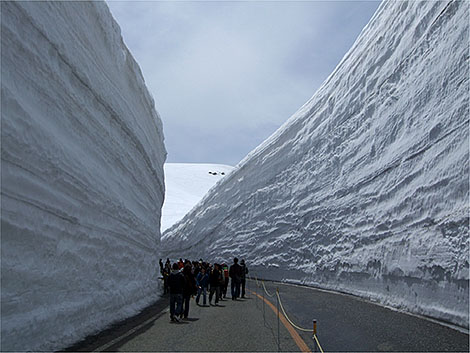
Snow WallNorth American meteorologists, welcome to the snow climate of western Japan. Every year in winter lake effect-like snow events bury coastal cities in northern and central Japan under 20-30 feet of snow. Above is the “snow corridor” experienced each spring when the Tateyama Kurobe Alpine Route through the Hida Mountains reopens, revealing the season’s snows in its towering walls. The Hida Mountains, where upwards of 512 inches of snow on average accumulates each winter, are known as the northern Japanese Alps.
The tremendous snow accumulations largely occur from December to February during the East Asian winter monsoon when sea-effect snowbands form behind frequent cold outbreaks. But their snowfall isn’t just pretty to look at and play in — extreme snowfalls combined with dense populations in cities adjacent to the Sea of Japan such as Sapporo (pop. 1.95 million) are public safety hazards, turning exceptionally deadly every year. On average 100 people die and four times that number are injured from snow and ice in Japan, not only from snow removal but also from “roofalanches” — masses of snow sliding off roofs onto people.

Similar to their counterparts downwind of North America’s Great Lakes, the Sea of Japan snowbands invite research from Japanese scientists and those in many other locales where bodies of water enhance snowfall over populated lands. A new paper in BAMS by Jim Steenburgh (University of Utah) et al. not only highlights what’s known about the Japanese snow events but also is designed to “stimulate increased collaborations between sea- and lake-effect researchers and forecasters in North America, Japan, East Asia, and other regions of the world” who can collectively realize the “significant potential to advance our understanding and prediction of sea- and lake-effect precipitation.”

Blending Satellite Imagery is Both ‘Science and Art’ to Maximize Information Delivery

Monitoring the atmosphere by satellite has come a long, long way technologically since TIROS sent back its first snapshots of Earth in 1960. Along with marked advances in spectral, spatial, temporal, and radiometric resolution of state-of-the-art instrumentation, however, come copious volumes of new data as well as unique challenges with how to view it all.

We as users are hardly up to the task alone — there’s insufficient time, especially for operational forecasters. The solution: blended imagery. In short, the seamless display of multivariate atmospheric information gleaned from today’s advanced satellites.

Value-added imagery from NOAA’s GOES-R satellite series, for example, isn’t just useful, but rather at its best it’s “a balance of science and art,” report Steven Miller (Colorado State University) and colleagues of a new paper in the Journal of Atmospheric and Oceanic Technology. Such multidimensional blending of key weather parameters into visually intuitive products maximizes the information available to users.

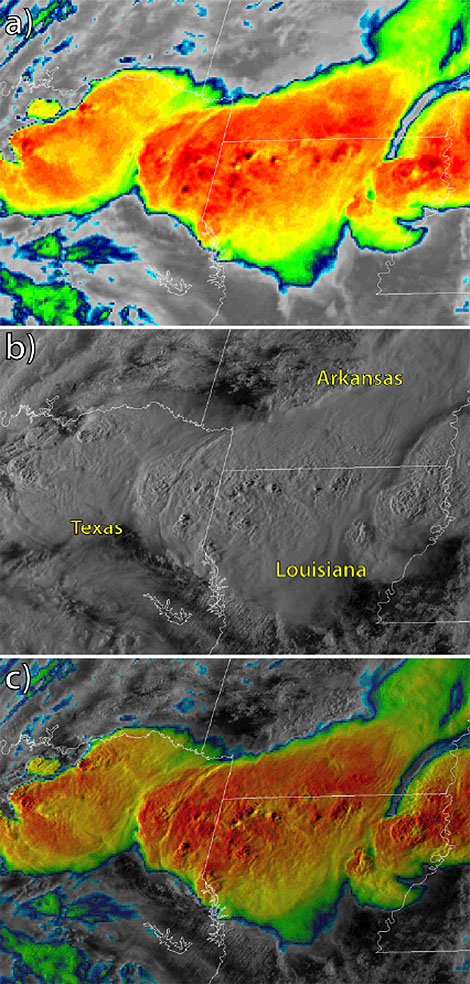
To illustrate this, the author’s applied the blending technique to new GOES-16’s GEOCOLOR imagery. Below is an example of a “sandwich product” in which (a) color-enhanced infrared imagery with a transparency of 70% is superimposed upon (b) visible reflectance imagery of thunderstorms over Texas, Louisiana, and Arkansas at 2319 UTC April 6, 2018, to dynamically (c) blend the images.

PoN_miller

This “partial transparency” blending technique highlights the overshooting cloud tops in the convection, enabling forecasters to pinpoint the most intense cells. It’s just one of a number of methods the paper highlights to simultaneously display satellite information and thereby present valuable insight.

The technique, Miller et al. state, blurs the line between qualitative imagery users want and quantitative products they need.

To the trained human analyst, capable of drawing context from such value-added imagery, combining the best of both worlds provides a powerful new paradigm for working with the new generation of information-rich satellites.

"Decision-making under meteorological uncertainty" for D-Day's Famous Forecast

The success of the D-Day Invasion of Normandy was due in part to one of history’s most famous weather forecasts, but new research shows this scientific success resulted more from luck than skill. Oft-neglected historical documentation, including audio files of top-secret phone calls, shows the forecasters were experiencing a situation still researched and practiced today: “decision-making under meteorological uncertainty.”
New research recently published in BAMS into that weather forecast for June 6, 1944, which enabled the Allies in World War II to gain a foothold in Europe, answers questions about three popular perceptions: were the forecasts, which predicted a break in the weather, that good? were the German meteorologists so ill-informed, missing that weather-break? and was the American analog system for prediction so great and better than what the Germans had?
The “alleged” weather break
An expected ridge and fair weather between two areas of low pressure, one departing and one arriving over the area, didn’t materialize. The departing low instead lingered and created a lull in visibility and lifted the cloud ceiling height, but it didn’t slow winds much. They blew at Force 4-5 (~13-24 mph), creating very choppy seas that sickened many troops prior to the invasion.

Synoptic analyses at 00 UTC from 5 to 8 June 1944. The low that was supposed to move northeast to southern Norway remained over the North Sea for some days. On 6 and 8 June the observed winds in the Channel were force 4 and occasionally force 5.
Synoptic analyses at 00 UTC from June 5-8, 1944. The low that was supposed to move northeast to southern Norway remained over the North Sea for some days.

 
A blown German Forecast?
Because the invasion came as a complete surprise to the Germans it has been surmised their weather forecast for June 6 had to be bad. German forecasters prior to the war were the best at “extended” forecasts, and their synoptic maps and forecast for that day were more realistic than the Allies, with a less optimistic speculation of any break in the weather.
The German's European-Atlantic map at 00 UTC June 6, 1944, where the analysis over the North Atlantic appears not to be based on observations but intercepted American coded analyses.
The German’s European-Atlantic map at 00 UTC June 6, 1944, where the analysis over the North Atlantic appears not to be based on observations but intercepted American coded analyses.

 
A historically debated forecast
The analog weather prediction system employed by the Allies for the invasion was claimed by its creators to have correctly identified the weather break. But historical analysis and review doesn’t bear this out. What it does find, though, is that the system correctly identified a transition from zonal to meridional flow, which delivered the break the Allies needed for success. History’s finding: The forecast was “Overoptimistic.”
The 1984 Fort Ord meeting about the D-Day forecast got coverage in the local Monterey newspapers. The invasion was said to have occurred in a "break" or a period of a "brief lull" in the weather.
The 1984 Fort Ord, California, AMS meeting about the D-Day forecast got coverage in the local Monterey newspapers. The American forecasting group was led by Lt. Col. (Dr.) Irving Krick of Caltech. The president of the Naval Post Graduate School, Robert Allen, Jr., at the time an Air Force officer conducting high-level weather briefings at the Pentagon, also spoke at the meeting.

 
As a lesson learned from this most famous of weather forecasts, the paper’s author, Anders Persson of Swedin’s Uppsala University, concludes:

It was 75[+] years ago and the observational coverage has improved tremendously since then, both qualitatively and quantitatively. Our understanding of the atmosphere is much better,and the forecast methods have reached a standard that could hardly have been dreamt of in 1944. However, there’s one element that has a familiar ring to it and is of great interest today. That is when Air Marshall Tedder [Deputy Supreme Commander of the Invasion under General Eisenhower] asks about an assessment of the confidence in the forecast he has just heard … This illustrates that the D-day forecast is a significant early example of decision-making under meteorological uncertainty.

“Decision-making under meteorological uncertainty” for D-Day’s Famous Forecast

The success of the D-Day Invasion of Normandy was due in part to one of history’s most famous weather forecasts, but new research shows this scientific success resulted more from luck than skill. Oft-neglected historical documentation, including audio files of top-secret phone calls, shows the forecasters were experiencing a situation still researched and practiced today: “decision-making under meteorological uncertainty.”

New research recently published in BAMS into that weather forecast for June 6, 1944, which enabled the Allies in World War II to gain a foothold in Europe, answers questions about three popular perceptions: were the forecasts, which predicted a break in the weather, that good? were the German meteorologists so ill-informed, missing that weather-break? and was the American analog system for prediction so great and better than what the Germans had?

The “alleged” weather break

An expected ridge and fair weather between two areas of low pressure, one departing and one arriving over the area, didn’t materialize. The departing low instead lingered and created a lull in visibility and lifted the cloud ceiling height, but it didn’t slow winds much. They blew at Force 4-5 (~13-24 mph), creating very choppy seas that sickened many troops prior to the invasion.

Synoptic analyses at 00 UTC from 5 to 8 June 1944. The low that was supposed to move northeast to southern Norway remained over the North Sea for some days. On 6 and 8 June the observed winds in the Channel were force 4 and occasionally force 5.
Synoptic analyses at 00 UTC from June 5-8, 1944. The low that was supposed to move northeast to southern Norway remained over the North Sea for some days.


A blown German Forecast?

Because the invasion came as a complete surprise to the Germans it has been surmised their weather forecast for June 6 had to be bad. German forecasters prior to the war were the best at “extended” forecasts, and their synoptic maps and forecast for that day were more realistic than the Allies, with a less optimistic speculation of any break in the weather.

The German's European-Atlantic map at 00 UTC June 6, 1944, where the analysis over the North Atlantic appears not to be based on observations but intercepted American coded analyses.
The German’s European-Atlantic map at 00 UTC June 6, 1944, where the analysis over the North Atlantic appears not to be based on observations but intercepted American coded analyses.


A historically debated forecast

The analog weather prediction system employed by the Allies for the invasion was claimed by its creators to have correctly identified the weather break. But historical analysis and review doesn’t bear this out. What it does find, though, is that the system correctly identified a transition from zonal to meridional flow, which delivered the break the Allies needed for success. History’s finding: The forecast was “Overoptimistic.”

The 1984 Fort Ord meeting about the D-Day forecast got coverage in the local Monterey newspapers. The invasion was said to have occurred in a "break" or a period of a "brief lull" in the weather.
The 1984 Fort Ord, California, AMS meeting about the D-Day forecast got coverage in the local Monterey newspapers. The American forecasting group was led by Lt. Col. (Dr.) Irving Krick of Caltech. The president of the Naval Post Graduate School, Robert Allen, Jr., at the time an Air Force officer conducting high-level weather briefings at the Pentagon, also spoke at the meeting.


As a lesson learned from this most famous of weather forecasts, the paper’s author, Anders Persson of Swedin’s Uppsala University, concludes:

It was 75[+] years ago and the observational coverage has improved tremendously since then, both qualitatively and quantitatively. Our understanding of the atmosphere is much better,and the forecast methods have reached a standard that could hardly have been dreamt of in 1944. However, there’s one element that has a familiar ring to it and is of great interest today. That is when Air Marshall Tedder [Deputy Supreme Commander of the Invasion under General Eisenhower] asks about an assessment of the confidence in the forecast he has just heard … This illustrates that the D-day forecast is a significant early example of decision-making under meteorological uncertainty.

COVID-19 and the Weather, Water, and Climate Enterprise

by Mary Glackin, AMS President

In normal times, our thousands of AMS professionals and colleagues are completely dedicated to helping people make the best possible weather-, water-, and climate-related decisions. In this COVID-19 period, were not just providing critical information; we are also receiving it. We are each of us following guidance from public health experts and local officials so that we can keep ourselves, our families, and our friends safe and well. We’re joining in the national and global efforts to “flatten the curve.”

amsseal-blueWe all continue to work, but these duties are now competing with new ones: caring for children who would normally be in school, searching for basic necessities that would routinely be in stock on supermarket shelves, protecting elderly friends and family members. With campuses and laboratories shut down, professors and students have scrambled to adjust to online teaching and reimagining plans for field experiments. Nonetheless, critical weather and hydrologic services are provided with sharp eyes for spring floods and convective weather. Preparations for the coming hurricane season are moving forward.

COVID-19 doesn’t “slightly tweak” the task of building a Weather-Ready Nation; it completely rearranges the landscape. Goals of shelter-in-place and evacuation have to be reconfigured for a world where we are advised by health experts to maintain physical separation from others—more than a challenge in a communal evacuation center.

COVID-19 provides a unique learning opportunity for all of us in the Enterprise. We can experience firsthand how even the best-intended top-down risk communication can sound to someone in harm’s way—and step up our own communications accordingly.

Finally, it’s worth noting as AMS embarks on its second century that our founding coincided with the 1918-19 influenza pandemic. The link between weather, water, climate, and public health (enshrined in the AMS seal) has been integral to building a sustainable and resilient world, and it will likely play a larger role in the future.

Thank you for maintaining essential services and supporting research and education during such a critical, difficult time. Stay well, and stay safe—and at the same time, stay focused, on our contributions to a safer, healthier world.

AMS's New Culture and Inclusion Cabinet

by Keith L. Seitter, CCM, AMS Executive Director
One of the AMS Core Values is: “We believe that a diverse, inclusive, and respectful community is essential for our science.”
AMS lives this value, which is articulated in the Centennial Update to the AMS Strategic Goals. We work to foster a culture that celebrates our diversity, strives for equity in all we do, and encourages inclusion across all activities so that everyone can experience a sense of belonging in the Society.
To formalize these efforts and provide a clearer path for providing resources toward them, the Council approved the creation of a new entity in AMS in fall 2019. At its meeting this past January, the Council approved the terms of reference for this new component of the Society’s structure and that Dr. Melissa Burt would serve as its first chair. This Culture and Inclusion Cabinet (CIC) has the following charge:

To accelerate the integration of a culture of inclusion, belonging, diversity, equity, and accessibility across the AMS and evaluate and assess progress towards culture and inclusion strategic goals within the Society. Meaningful integration into all areas and components of the AMS will require time and sustained effort. Fully integrating diversity, equity, inclusion, and belonging (DEIB) will result in an organizational culture that is accessible, advances science, serves society, and is responsive to social justice.

The Council designates this new body as a “Cabinet” to reinforce that it is not quite like any of the other entities making up the volunteer structure of the Society (council, commission, board, committee, task force, etc.). The CIC will play a unique role and therefore was given a unique name.
The CIC sits at the highest level of the organizational structure for AMS save the Council itself, to which it reports directly. Being at this level it can more readily ensure that issues of diversity, equity, inclusion, accessibility, social justice, and belonging are addressed throughout all AMS programs and activities.
The CIC does not replace any of the other components of the Society that work in these arenas—most notably the Board on Women and Minorities (BWM), which has a long record of addressing equity and inclusion issues in AMS. The BWM will continue to oversee specific programs aimed at diversity, equity, and inclusion, and will likely expand its role in AMS programs as the CIC helps integrate those efforts more broadly in the Society.
AMS has a strong record of addressing diversity and equity issues and a culture of inclusivity that other organizations could learn from. The creation of the CIC builds on those strengths and puts AMS in a position of leadership among scientific organizations in elevating these issues to the highest levels so that they can be threaded through every program in foundational ways.
For many of us, the sense of belonging in AMS is an important part of what makes the Society so special, and we want everyone in the community to feel that sense of belonging as an intrinsic aspect of the AMS culture. I am confident the new Culture and Inclusion Cabinet will take us there and will assist our entire community in creating an even more inclusive environment—strengthening our enterprise in the process.

AMS’s New Culture and Inclusion Cabinet

by Keith L. Seitter, CCM, AMS Executive Director

One of the AMS Core Values is: “We believe that a diverse, inclusive, and respectful community is essential for our science.”

AMS lives this value, which is articulated in the Centennial Update to the AMS Strategic Goals. We work to foster a culture that celebrates our diversity, strives for equity in all we do, and encourages inclusion across all activities so that everyone can experience a sense of belonging in the Society.

To formalize these efforts and provide a clearer path for providing resources toward them, the Council approved the creation of a new entity in AMS in fall 2019. At its meeting this past January, the Council approved the terms of reference for this new component of the Society’s structure and that Dr. Melissa Burt would serve as its first chair. This Culture and Inclusion Cabinet (CIC) has the following charge:

To accelerate the integration of a culture of inclusion, belonging, diversity, equity, and accessibility across the AMS and evaluate and assess progress towards culture and inclusion strategic goals within the Society. Meaningful integration into all areas and components of the AMS will require time and sustained effort. Fully integrating diversity, equity, inclusion, and belonging (DEIB) will result in an organizational culture that is accessible, advances science, serves society, and is responsive to social justice.

The Council designates this new body as a “Cabinet” to reinforce that it is not quite like any of the other entities making up the volunteer structure of the Society (council, commission, board, committee, task force, etc.). The CIC will play a unique role and therefore was given a unique name.

The CIC sits at the highest level of the organizational structure for AMS save the Council itself, to which it reports directly. Being at this level it can more readily ensure that issues of diversity, equity, inclusion, accessibility, social justice, and belonging are addressed throughout all AMS programs and activities.

The CIC does not replace any of the other components of the Society that work in these arenas—most notably the Board on Women and Minorities (BWM), which has a long record of addressing equity and inclusion issues in AMS. The BWM will continue to oversee specific programs aimed at diversity, equity, and inclusion, and will likely expand its role in AMS programs as the CIC helps integrate those efforts more broadly in the Society.

AMS has a strong record of addressing diversity and equity issues and a culture of inclusivity that other organizations could learn from. The creation of the CIC builds on those strengths and puts AMS in a position of leadership among scientific organizations in elevating these issues to the highest levels so that they can be threaded through every program in foundational ways.

For many of us, the sense of belonging in AMS is an important part of what makes the Society so special, and we want everyone in the community to feel that sense of belonging as an intrinsic aspect of the AMS culture. I am confident the new Culture and Inclusion Cabinet will take us there and will assist our entire community in creating an even more inclusive environment—strengthening our enterprise in the process.

Snowflake Selfies as Meteo Teaching Tools

Undergrads at Penn State recently took to their cellphones to mingle with and snap pics of tiny snowflakes to reinforce meteorological concepts. The class, called “Snowflake Selfies” and described in a new paper in BAMS, was designed to use low-cost, low-tech methods that can be widely adapted at other institutions to engage students in hands-on field research.

In addition to photographing snow crystals, students measured snowfall amounts and snow-to-liquid ratios, and then gained meteorological insight into the observations using radar data and thermodynamic soundings. The goal of the course was to reinforce concepts from their other undergraduate meteorology courses, such as atmospheric thermodynamics, cloud physics, and radar and mesoscale meteorology.

As a writing intensive course at Penn State that meets the communication skills requirement of the AMS guidance for a Bachelor’s Degree in Atmospheric Science, “Snowflake Selfies” also was designed to help students communicate meteorological science. Students shared their observations with the local National Weather Service office in State College and also wrote up their work in term papers and presented their pics and findings to the class.

Snow crystal photographs taken by students in the "Snowflake Selfies" class.
Snow crystal photos taken by students in the “Snowflake Selfies” class.


Of course to have such a class, you need snow, and “the relative lack of snowfall events during the observational period” in winter 2018 was definitively a challenge for students, the BAMS paper states. Pennsylvania’s long winters often see many opportunities to photograph snow, but the course creators caution that perhaps a longer observational period is needed in case nature doesn’t cooperate. It also would allow students enough time to closely observe snowflakes while juggling their other classes and activities.

A survey conducted at the end of the class found that “Snowflake Selfies” was well received by students, engaging them and encouraging their introduction to field science. And they “strongly agreed [it] helped reinforce their understanding of cloud physics and physical meteorology compared to” a previous such course where students designed, built, and deployed their own 3-D printed rain gauges to measure precipitation.

Actually, that previous course sounds like a lot of fun, too!

Observations without Fear: NOAA's Drones for Hurricane Hunting

Nowhere is it more dangerous to fly in a hurricane than right near the roiling surface of the ocean. These days, hurricane hunting aircraft wisely steer clear of this boundary layer, but as a result observations at the bottom of the atmosphere where we experience storms are scarce. Enter the one kind of plane that’s fearless about filling this observation gap: the drone.
NOAA’s hurricane hunter aircraft in recent storms has been experimenting with launching small unmanned aircraft systems (sUAS) into raging storms–and these devices show promise for informing advisories as well as improving numerical modeling.

Lead author Joe Cione of NOAA's hurricane research division holds a Coyote sUAS. The drones are being launched into hurricanes from the P-3 hurricane hunter aircraft in the background.
Lead author of a new paper in BAMS, Joe Cione of NOAA’s Hurricane Research Division, holds a Coyote sUAS. The drones are being launched into hurricanes from the WP-3D Orion hurricane hunter aircraft in the background.

 
The observations were made by a new type of sUAS, described in a recently published paper in BAMS, called the Coyote that flew below 1 km in hurricanes. Sampling winds, temperature, and humidity in this so-called planetary boundary layer (PBL), the expendable Coyotes flew as low as 136 m in wind speeds as high as 87 m s-1 (196 mph) and for as long as 40 minutes before crashing (as intended) into the ocean.
In the BAMS article, Joe Cione at al. describe the value of and uses for the low-level hurricane observations:

Such high-resolution measurements of winds and thermodynamic properties in strong hurricanes are rare below 2-km altitude and can provide insight into processes that influence hurricane intensity and intensity change. For example, these observations—collected in real time—can be used to quantify air-sea fluxes of latent and sensible heat, and momentum, which have uncertain values but are a key to hurricane maximum intensity and intensification rate.

Highs-lows
Coyote was first deployed successfully in Hurricane Edouard (2014) from NOAA’s WP-3 Orion hurricane hunter aircraft. Recent Coyote sUAS deployments in Hurricanes Maria (2017) and Michael (2018) include the first direct measurements of turbulence properties at low levels (below 150 m) in a hurricane eyewall. In some instances the data, relayed in near real-time, were noted in National Hurricane Center advisories.
Turbulence processes in the PBL are also important for hurricane structure and intensification. Data collected by the Coyote can be used to evaluate hurricane forecasting tools, such as NOAA’s Hurricane Weather Research and Forecasting (HWRF) system. sUAS platforms offer a unique opportunity to collect additional measurements within hurricanes that are needed to improve physical PBL parameterization.

Coyote launch sequence: (a) Release in a sonobuoy canister from a NOAA P-3. (b) A parachute slows descent. (c) The canister falls away and the Coyote wings and stabilizers deploy. The main wings and vertical stabilizers have no control surfaces; rather, elevons (i.e., combined elevator and aileron) are on the rear wings, controlled by the GPS-guided Piccolo autopilot system with internal accelerometers and gyros. (d) After the Coyote is in an operational configuration, the parachute releases. (e) The Coyote levels out after starting the electric pusher motor, which leaves minimally disturbed air for sampling at the nose. The cruising airspeed is 28 m s-1. (f) The Coyote attains level flight and begins operations. When deployed, the Coyote’s wingspan is 1.5 m and its length is 0.9 m. The 6-kg sUAS can carry up to 1.8 kg. Images were captured from a video courtesy of Raytheon Corporation.
Coyote launch sequence: (a) Release in a sonobuoy canister from a NOAA P-3. (b) A parachute slows descent. (c) The canister falls away and the Coyote wings and stabilizers deploy. The main wings and vertical stabilizers have no control surfaces; rather, elevons (i.e., combined elevator and aileron) are on the rear wings, controlled by the GPS-guided Piccolo autopilot system with internal accelerometers and gyros. (d) After the Coyote is in an operational configuration, the parachute releases. (e) The Coyote levels out after starting the electric pusher motor, which leaves minimally disturbed air for sampling at the nose. The cruising airspeed is 28 m s-1. (f) The Coyote attains level flight and begins operations. When deployed, the Coyote’s wingspan is 1.5 m and its length is 0.9 m. The 6-kg sUAS can carry up to 1.8 kg.
Images were captured from a video courtesy of Raytheon Corporation.

 
The authors write that during some flights instrument challenges occurred. For example:

thermodynamic data were unusable for roughly half of the missions. Because the aircraft are not recovered following each flight, the causes of these issues are unknown. New, improved instrument packages will include a multi-hole turbulence probe, improved thermodynamic and infrared sensors, and a laser or radar altimeter system to provide information on ocean waves and to more accurately measure the aircraft altitude.

Future uses of the sUAS could include targeting hurricane regions for observations where direct measurements are rare and models produce large uncertainty. Meanwhile, the article concludes, efforts are underway to increase sUAS payload capacity, battery life, and transmission range so that the NOAA P-3 need not loiter nearby.