Even with a modest amount of global warming, future hurricanes will become nastier. They’ll push ashore higher storm surges, grow into superstorms like Hurricanes Dorian and Irma more often, and unleash inundating rains similar to Hurricanes Harvey and Florence more frequently.
That’s the assessment of published, peer-reviewed research in the past decade, according to an assessment by Thomas Knutson (NOAA) and colleagues, recently published in the Bulletin of the American Meteorological Society. It’s the second in a two part study conducted by the author team, 11 experts in climate and tropical cyclones (TCs). Part 1 found there are indeed already detectable changes in tropical cyclone activity attributable to human-caused climate change. Part 2, in the March 2020 BAMS online, project changes in the climatology of these storms worldwide due to human-induced global warming of just 2°C.
Highest confidence among the experts was in storm surge flooding. Rising sea levels due to warming and expanding oceans, responding to atmospheric warming and glacial ice melt, are already making it easier for hurricanes and even tropical storms to drive greater amounts of seawater ashore at landfall. And this will only worsen.
With CO2 levels climbing to about 414 ppm in March, as measured atop Mauna Loa in Hawaii, Earth is on track to reach a 2°C average global temperature increase by mid century. Already global average surface temperature has risen 1.2°C since the Industrial Revolution began.
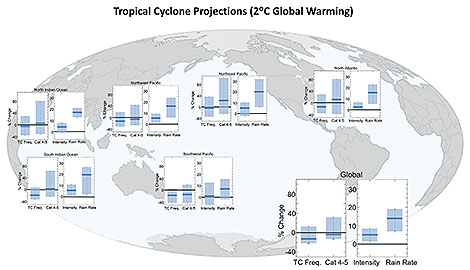
In the assessment the authors have medium-to-high-confidence that rainfall rates in tropical cyclones will increase globally by 14% due to the increasing amount of water vapor available in a warmer atmosphere. They project a 5% global increase in tropical cyclone intensity along with an increase in the number of Category 4 and 5s ̶ although the range of opinions among the experts involved is 1-10%. In the Atlantic Basin, which includes the Caribbean Sea and Gulf of Mexico, the number of storms is projected to decrease while intensity as well as the number of intense hurricanes increases.
Other studies found that hurricanes will slow down, making them even more prolific rainmakers, among other changes. Authors of the new assessment discussed these additional changes, but cited less confidence in general and that different tropical basins around the world had different projections:
Author opinion was more mixed and confidence levels generally lower for some other TC projections, including a further poleward expansion of the latitude of maximum intensity of TCs in the western North Pacific basin, a decrease of global TC frequency, and an increase in the global frequency (as opposed to proportion) of very intense (category 4–5) TCs. The vast majority of modeling studies project decreasing global TC frequency (median of about −13% for 2°C of global warming), while a few studies project an increase. It is difficult to identify/quantify a robust consensus in projected changes in TC tracks across studies, although several project either poleward or eastward expansion of TC occurrence over the North Pacific. Projected TC size metric changes are on the order of 10% or less, and highly variable between basins and studies. Confidence in projections of TC translation speed is low due to the potential for data artifacts in the observed slowdown and a lack of model consensus. Confidence in various TC projections in general was lower at the individual basin scale than for the global average.