“It’s a big relief.”
That’s how Karl Erb, head of National Science Foundation’s Office of Polar Programs, sums up the feelings of most researchers at McMurdo Station, the headquarters of U.S. scientific research in Antarctica. The station was in danger of having its operations limited–or even of being shuttered–for at least this austral summer after the Swedish government recently announced that they would not be able to provide the Oden, the icebreaker/research vessel that the NSF has been leasing and which has been carving a path to McMurdo since 2006. Sweden claimed it needed to keep the vessel close to home after two consecutive severe winters bottled up shipping lanes in the Baltic Sea. (More recently, the Swedish government announced a five-year agreement to lease the ship to Finland for use in the Baltic’s Gulf of Bothnia.)
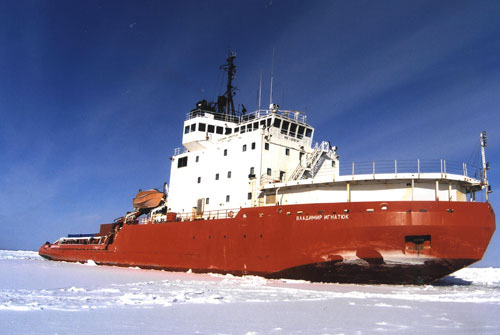
So the NSF, which oversees the U.S. Antarctic Program, looked elsewhere. Unfortunately, the three U.S. Coast Guard icebreakers are unable to handle the task: one is scheduled for decommission this month, one is being renovated and won’t be ready for at least two years, and the third is simply not designed for such a strenuous task as breaking through to McMurdo. With time running out to guarantee shipment of fuel and other supplies necessary to keep McMurdo operating through this austral summer, the NSF secured an agreement with a Russian vessel, the Vladimir Ignatyuk, to cut through the ice this year, and perhaps for the following two years if it’s needed. The Ignatyuk has carried out similar duties for other nations in the past, but unlike the Oden, it is not a research vessel. Scientists hoping to conduct ship-based research will have to scramble to hitch a ride on other vessels headed for the Antarctic region.
 Matt
Matt
It's Not the Heat, It's the Aridity
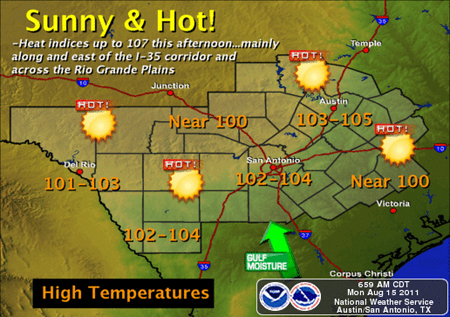
Monday’s NWS weather map looked all too familiar to most Texans. It’s been a summer of blazing sunshine and record-setting heat throughout most of the state, with so many new milestones being reached that it’s been hard to keep up.
According to the National Climatic Data Center’s national overview, July was the warmest month in state history (87.1°F; the previous average high was 86.5°F in July of 1998). Additionally, state climatologist John Nielsen-Gammon recently announced that Texas just went through its worst one-year drought on record (rainfall data goes back to 1895). At the end of July, the state had received only 15.16 inches of rain over the previous 12 months, breaking an 86-year-old record. And the year-to-date precipitation total of 6.53 inches was also a record low through the end of July, and 9.5 inches less than the historical average. According to the U.S. Drought Monitor, more than 75% of Texas is now in “exceptional” drought conditions, and last month’s rainfall total of 0.72 inches was the 3rd-driest July in state history.
“Never before has so little rain been recorded prior to and during the primary growing season for crops, plants, and warm-season grasses,” said Nielsen-Gammon.
And there appears to be no immediate end to the oppressive heat: recent forecasts predict at least another week of 100-degree temperatures in most of the state.
The conditions in Texas are typical of what much of the South has been experiencing this summer. Here are a few other numbers to chew on (preferably while you’re sitting in the shade with a tall glass of lemonade):
- According to NCDC, Oklahoma’s average temperature in July was 88.9°F, which is not only the warmest month in the state’s history, but the warmest month in any state, ever! (Oklahoma also held the previous record, which was 88.1°F in July of 1954.)
- The South climate region–which comprises Arkansas, Kansas, Louisiana, Mississippi, Oklahoma, and Texas–had an average July temperature of 86.1°F, making it the hottest month of any climate region on record. The previous record, also set in the South region, was 85.9°F in July of 1980.
- The average July temperature for the nation was 76.96°F, the 4th-warmest July–as well as the 4th-warmest month–on record, after Julys in 1936 (77.43°F), 2006 (77.26°F), and 1934 (77.00°F).
Every state in the country had at least one day of record-high temperatures in July. More U. S. climate records set during the month can be found here.
Industrial Air Pollution State by State
According to a study conducted by the Natural Resources Defense Council, an environmental advocacy organization, Ohio emits more toxic air pollution emitted from electricity-producing coal- and oil-fired power plants than any state in the country. The study utilized 2009 data taken from the Environmental Protection Agency’s Toxics Release Inventory, a database of emissions self-reported by industrial and other facilities across the United States. The report notes that 771 million pounds of toxic chemicals were released into the air in 2009 by U.S. industries, including metal, paper, food and beverage, and chemical companies. Of all the sectors mentioned in the study, power plants emitted by far the most air pollution (almost 382 million pounds), with Ohio contributing more than 44 million pounds to that figure, or about 12%. The full report can be viewed here.
The 20 states with the most toxic air pollution from power plants are:
- Ohio
- Pennsylvania
- Florida
- Kentucky
- Maryland
- Indiana
- Michigan
- West Virginia
- Georgia
- North Carolina
- South Carolina
- Alabama
- Texas
- Virginia
- Tennessee
- Missouri
- Illinois
- Wisconsin
- New Hampshire
- Iowa
Bridging Disciplines: Joint Sessions at the 2012 Annual
by Ward Seguin, 2012 AMS Annual Meeting Chair
For many years, organizers of the Annual Meeting have encouraged conferences to join forces to host joint sessions for the purpose of sharing presentations of mutual interest. A few years ago, organizers of the Annual Meeting proposed themed joint sessions that focused on the theme of the Annual Meeting.
Concerned that conferences participating in the Annual Meeting might not understand the purpose of joint sessions and, in particular, themed joint sessions, this year’s organizers decided to start the planning process early. At the 2011 Annual Meeting in Seattle, organizers for the 2012 meeting met with all of the conference committees holding meetings in Seattle to encourage future participation in the themed joint sessions. This was followed by e-mail contacts in February designed to reach those conference committees not present at the Seattle meeting.
In April, the conferences were asked to propose themed joint sessions focusing on AMS President Jon Malay’s 2012 theme of “Technology in Research and Operations–How We Got Here and Where We’re Going.“ The response from the conferences was outstanding, as 20 themed joint sessions are currently being organized. With so many conferences holding meetings in January, themed joint sessions encourage sharing of information among the government, academia, and the private sector in diverse subdisciplines. Participants are able to share their experiences of common problems and solutions, and attendees are able to take in papers related to the theme without having to move from one session to another.
Because the 2012 Annual Meeting theme is so broad, the range of topics being covered by the joint sessions provides an excellent opportunity for diverse conferences to come together. For example, one session–jointly hosted by the 10th Conference on Artificial Intelligence Applications to Environmental Science and the 18th Conference on Satellite Meteorology, Oceanography, and Climatology–is titled “Artificial Intelligence Methods Applied to Satellite Remote Sensing.” Another themed joint session, “Recent Advances in Data Management Technologies and Data Services,” will be hosted by the 28th Conference on Interactive Information Processing Systems (IIPS) and the Second Conference on Transition of Research to Operations: Successes, Plans, and Challenges. Still another session will focus on “Extreme Weather and Climate Change” and will be hosted by the Seventh Symposium on Policy and Socio-Economic Research, the 24th Conference on Climate Variability and Change, and the 21st Symposium on Education.
The format of themed joint session will include distinguished invited speakers, panel discussions, and submitted papers. Jon Malay’s chosen theme is allowing some very diverse conferences to focus together on some of today’s research and operations challenges through technology.
The deadline for abstract submissions for these sessions is August 1, and abstracts can be submitted on the AMS website at the abstracts submissions page.
Increasing Clouds with a Greater Chance of Hits
If you’ve ever stepped into the batting cage at your local amusement park, you know how difficult it is to hit a baseball. As Ted Williams once said, “Making good contact with a round ball and round bat even if you know what’s coming is hard to do. That seems to be the one major thing that all young players have difficulty with. Why? It’s the hardest thing to do in sports. ” That being the case (and who are we to argue with the man whom many consider to be the greatest hitter who ever lived), baseball players at all levels would be wise to check out the study published in the latest issue of Weather, Climate, and Society that analyzes the influence of weather conditions on the performance of Major Leaguers. 
Wes Kent and Scott Sheridan of Kent State University examined statistics from more than 35,000 Major League games played in 21 different stadiums between 1987 and 2002, as well as NCDC cloud-cover data taken from the closest NWS office to the ballparks for all of the day games during the studied period. They found that hitters performed better on cloudy days, while pitchers’ statistics improved when the sun was shining. For hitters, this trend was most noticeable in batting averages, which when comparing clear-sky and cloudy-sky conditions improved from .259 to .266 for home teams and from .251 to .256 for road teams. For pitchers, strikeouts were the most salient statistic, increasing by almost half a strikeout per game on days with clear skies. The study also looked at a number of other statistics, including home runs, earned run average, errors, and winning percentage, with the results showing varying levels of weather influence. Additionally, the research made some interesting findings related to ballparks, with certain stadiums reflecting much more consistent trends than others, perhaps at least partially due to their architectural design.
In examining the batting and pitching stats, it really comes down to that fundamental skill of putting bat to ball that Williams talked about. As the authors write in the article:
One of the most crucial aspects to the pitcher-batter interaction is how well the batter can see the pitch. Changing cloud cover presents different playing conditions, with some playing conditions potentially helping a batter see a pitch, whereas others may make reading a pitch more difficult. For example, brighter conditions may result in increased eye strain for a batter and a higher level of glare in a ballpark. These factors could contribute to less than favorable conditions for a batter trying to focus on a pitch, impacting performance in a number of areas.
In a recent interview, the New York Mets’ David Wright supported this premise, saying, “When it’s overcast, your eyes are a little more relaxed, I think. There’s not as much squinting. Sometimes, when it’s really bright, it’s a little tougher to see as a hitter. I always prefer a little cloud cover.”
After all, according to Williams, you can’t understand hitting without understanding the science: “If there is such a thing as a science in sport, hitting a baseball is it. As with any science, there are fundamentals, certain tenets of hitting every good batter or batting coach could tell you.” If he were still alive and hitting, we bet Williams would use this new research to his advantage at the plate.
Observing Memphis Flooding from Above
The floodwaters of the Mississippi River continue their inexorable flow toward New Orleans and the Gulf of Mexico. Residents in Louisiana’s Atchafalaya Basin–most of them, anyway–continue to pack up their belongings and evacuate their homes after the opening of the Morganza Spillway (video of the opening can be seen here), which is diverting 763,000 gallons of water per second from the bloated Mississippi, but now threatens the homes and properties of as many as 25,000 people in the Atchafalaya River basin.
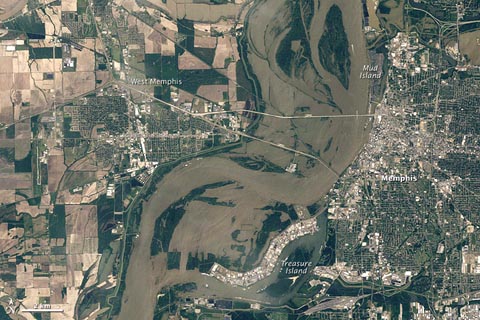
Meanwhile, other communities are already starting the recovery process from the flooding. In Memphis, Tennessee, the river is slowly receding after unofficially cresting at 47.8 feet last Tuesday, the second-highest level ever recorded in the city (it reached 48.7 feet in 1937). The satellite images below were taken by the multispectral imaging sensor called the Thematic Mapper on NASA’s Landsat 5 satellite. The top image shows Memphis in April of 2010, while the bottom image was taken last Tuesday, at the height of the flooding, with the flood waters clearly visible on both sides of the river. About 1,500 people in the Memphis area have applied for FEMA assistance in the wake of the flooding. (Photos courtesy of NASA’s Earth Observatory; more satellite pictures of the flooding can be found here.)

Clearing Up Aviation Ice Forecasting
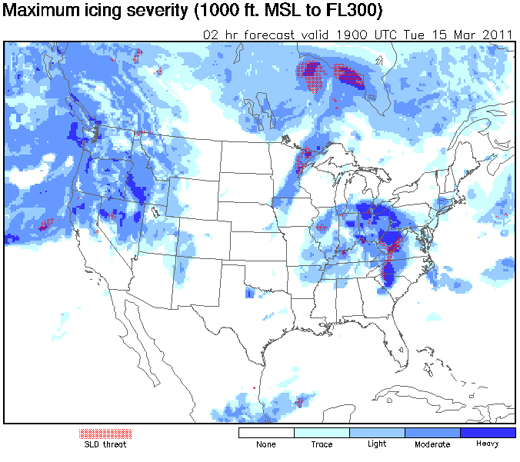
NCAR has developed a new forecasting system for aircraft icing that delivers 12-hour forecasts updated hourly for air space over the continental United States. The Forecast Icing Product with Severity, or FIP-Severity, measures cloud-top temperatures, atmospheric humidity in vertical columns, and other conditions and then utilizes a fuzzy logic algorithm to identify cloud types and the potential for precipitation in the air, ultimately providing a forecast of both the probability and the severity of icing. The system is an update of a previous NCAR forecast product that only was capable of estimating uncalibrated icing “potential.”
The new icing forecasts should be especially valuable for commuter planes and smaller aircraft, which are more susceptible to icing accidents because they fly at lower altitudes than commercial jets and are often not equipped with de-icing instruments. The new FIP-Severity icing forecasts are available on the NWS Aviation Weather Center’s Aviation Digital Data Service website.
According to NCAR, aviation icing incidents cost the industry approximately $20 million per year, and in recent Congressional testimony, the chairman of the National Transportation Safety Board (NTSB) noted that between 1998 and 2007 there were more than 200 deaths resulting from accidents involving ice on airplanes.
Arctic Ozone Layer Looking Thinner
The WMO announced that observations taken from the ground, weather balloons, and satellites indicate that the stratospheric ozone layer over the Arctic declined by 40% from the beginning of the winter to late March, an unprecedented reduction in the region. Bryan Johnson of NOAA’s Earth System Research Laboratory called the phenomenon “sudden and unusual” and pointed out that it could bring health problems for those in far northern locations such as Iceland and northern Scandinavia and Russia. The WMO noted that the thinning ozone was shifting locations as of late March from over the North Pole to Greenland and Scandinavia, suggesting that ultraviolet radiation levels in those areas will be higher than normal, and the Finnish Meteorological Institute followed with their own announcement that ozone levels over Finland had recently declined by at least 30%.
Previously, the greatest seasonal loss of ozone in the Arctic region was around 30%. Unlike the ozone layer over Antarctica, which thins out consistently each winter and spring, the Arctic’s ozone levels show greater fluctuation from year to year due to more variable weather conditions.
Did Monday's Storm Set a Reporting Record?
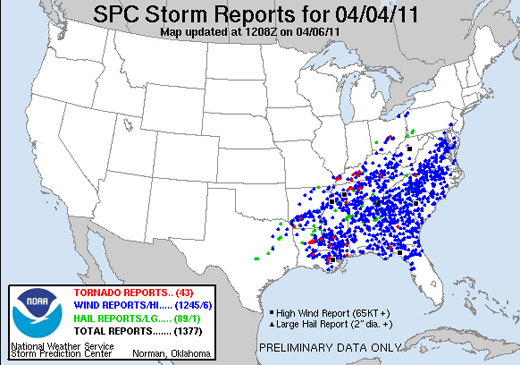
A storm system that stretched from the Mississippi River to the mid-Atlantic states on Monday brought more than 1,300 reports of severe weather in a 24-hour period, including 43 tornado events.
The extraordinary number of reports testifies to the intensity of the storm, which has been blamed for at least nine deaths, but it also reflects changes in the way severe weather is reported to–and recorded by–the Storm Prediction Center. As pointed out by Accuweather’s Brian Edwards, the SPC recently removed filters that previously prevented multiple reports of the same event that occurred within 15 miles of each other. Essentially, all reports are now accepted, regardless of their proximity to other reports. Additionally, with ever-improving technology, there are almost certainly more people sending reports from more locations than ever before (and this is especially true in highly populated areas such as much of the area covered by this storm).
So while the intensity of the storm may not set any records, the reporting of it is one for the books. According to the SPC’s Greg Carbin, Monday’s event was one of the three most reported storms on record, rivaled only by events on May 30, 2004 and April 2, 2006.
The Evolution of Melting Ice
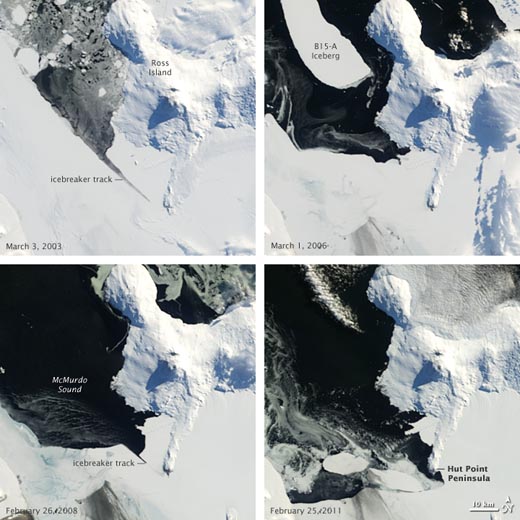
Off the coast of Antarctica, beyond the McMurdo Station research center at the southwestern tip of Ross Island, lies Hut Point, where in 1902 Robert Falcon Scott and his crew established a base camp for their Discovery Expedition. Scott’s ship, the Discovery, would soon thereafter become encased in ice at Hut Point, and would remain there until the ice broke up two years later.
Given recent events, it appears that Scott (and his ship) could have had it much worse. Sea levels in McMurdo Sound off the southwestern coast of Ross Island have recently reached their lowest levels since 1998, and last month, the area around the tip of Hut Point became free of ice for the first time in more than 10 years. The pictures below, taken by the Moderate Resolution Imaging Spectroradiometer on NASA’s Terra satellite and made public by NASA’s Earth Observatory, show the progression of the ice melt in the Sound dating back to 2003. The upper-right image shows a chunk of the B-15 iceberg, which when whole exerted a significant influence on local ocean and wind currents and on sea ice in the Sound. After the iceberg broke into pieces, warmer currents gradually dissipated the ice in the Sound; the image at the lower right, taken on February 25, shows open water around Hut Point.
Of course, icebreakers (their tracks are visible in both of the left-hand photos) can now prevent ships from being trapped and research parties from being stranded. Scott could have used that kind of help in 1902…
