Even without a White Christmas….Snow Measurements Must Go On

The Pacific Northwest still is one of the few shining spots on the snow map for this holiday, but if Seattle is waiting with bated breath (and outstretched tongue)  for a big, beautiful White Christmas, Cliff Mass throws a bucket of cold (flakes?) on hopes for deep cover. He explains how numerical prediction models can overstate snow possibilities in low elevations near mountains. But also: he explains the commonly misunderstood difference between accumulated snow (what fell from the sky) and snow depth (what remains to pile up).

If you are one of the lucky few with snow on Christmas Day (and one of the many who will celebrate a holiday unimpeded by snowy roads), we have to ask: what are you going to do with that snow, anyway?

If you’re not sure, ask some experts. Maybe ask your friends in the Northeast who so far this winter are bereft of drifts. Would they make snow angels? Sculpt snow people, with carrots, or with buttons of coal dug out of stockings?
When meteorologists catch snowflakes—and not on outstretched tongues!—they measure. Science means quantifying snowfall.  Accuracy matters: the measurements are meaningful. For example, they figure in aircraft deicing, forecasts of spring melt, stream runoff, flooding prospects, and more. They are also tracked over many years in climate records.
Unfortunately, while measuring snow depth might be easy to imagine if you have a ruler, it’s not so simple, and measuring ongoing snowfall is not easy. Ultimately…like most things scientific: there’s more to learn and important refinements to make!

Recently the Bulletin of the American Meteorological Society published a new review of snowfall measurement techniques. The authors, John Kochendorfer of NOAA’s Air Resources Laboratory (Oak Ridge, Tennessee), and colleagues write “snowfall measurements are subject to significant errors and biases.”

For years meteorologists have realized that not all observers and networks measure snowfall the same way. For instance, methods of shielding gauges from wind errors, or accounting for evaporation, vary. And the results vary. To clear this snow observing problem the World Meteorological Organization put together a team of scientists who compared and evaluated the various methods and devices used worldwide. Kochendorfer et al. followed up to see what progress can be made from this WMO report. They write:

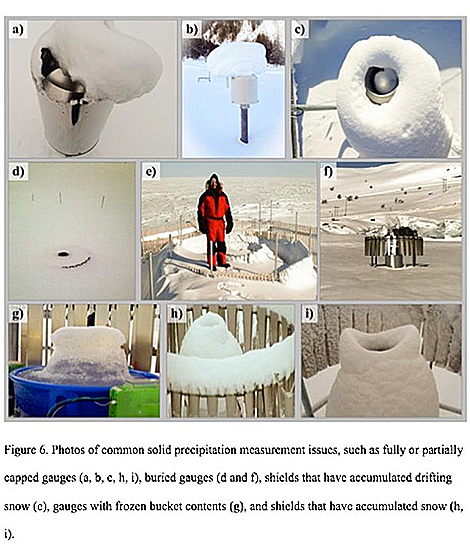
Snowfall is one of the most difficult meteorological variables to measure using automated sensors. …. Despite recent advancements in sensor technology, measurement techniques, and communications, snow cover measurements, such as snow depth and snow water equivalent (SWE), are still primarily recorded manually, and require specialized equipment and well-trained personnel. …. Measurement of the liquid water equivalent of precipitation falling as snow, or other forms of solid precipitation, typically requires heated precipitation gauges to prevent full or partial blockage (capping) of the gauge inlet by snow and ice. In addition, precipitation gauges can significantly underestimate the true amount of solid precipitation, primarily due to wind effects. For these reasons, the improvement of snow cover and solid precipitation measurements is an important subject of climatological and hydrological research in cold regions.

All-season measurement methods that catch precipitation (such as tipping-buckets) can handle snow, as can weighing gauges. Methods that catch snowflakes ultimately require weighing the melted water of snow. For these common methods, Kochendorfer et al. note that evaporation and response delays can be a problem (because it is necessary to warm and melt the snow and weigh the catch). The wind shields protecting the gauges can also accrue or redirect snow, however.

One piece of advice from the article may seem perfectly attuned with a White Christmas. If you’ve got family coming over for dinner, and a weighing-gauge catchment device for snow, put the snow in the pan and of course, heat it, but also add a layer of oil. The idea is not to fry up a side dish. But to prevent evaporation (and freezing—in fact antifreeze is used in some snow measurement techniques). Yes, that’s basically a way to keep track of snow as its falling and not lose too much in the process.

The ways of “undercatchment” are multifarious:
Snow measuring issues
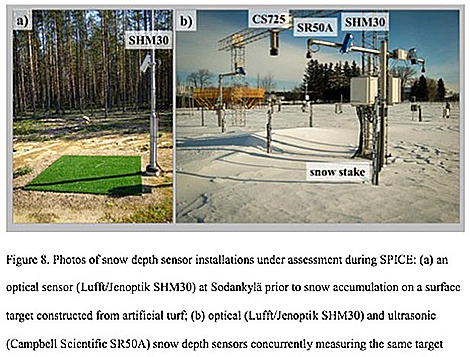
Meanwhile, Kochenderfer et al. note a proliferation of automated gauges and new non-catchment methods that involve using laser disdrometers and “present-weather” detectors to remotely determine what type of precipitation is falling.
Think of it as measuring free-ranging, versus, captive snow. Data processing methods allow calculations of snowfall rate. So far, according to the WMO comparisons, these devices solve some of the problems of “catchment” measurements, but they are still susceptible to over- and under-counting snowfall accumulation, due to wind direction and other factors. Results so far look better for observations on long periods like full seasons, rather than for a one-day holiday.  The new disdrometers can also be used in tandem with simple evaporative plates that use mass heat transfer to measure amounts.

Even if a White Christmas isn’t in the immediate future for many of us, the future of snow measurement may already have arrived anyway, if not for every observer.

New snow devices

Derecho Possible in the Upper Midwest Today

Severe thunderstorms are expected to erupt late this afternoon in the upper Midwest and, according to the Storm Prediction Center (SPC), they could organize into a single, large bowing line capable of widespread damaging winds called a derecho tonight. Last summer a very destructive derecho blitzed Iowa with wind gusts over 100 mph.

SPC Convective Outlook

SPC’s Day 1 Convective Outlook has a large part of Wisconsin in a moderate risk of severe storms, with enhanced and slight risk areas surrounding it extending northwest into Minnesota and southeast into northwest Ohio. Supercell thunderstorms are expected to blossom across northern Minnesota late this afternoon with the threat of large to very large hail and tornadoes as well as damaging winds.

Storms then may grow into a derecho capable of producing a wide swath of wind gusts greater than 75 mph hurricane force as it races southeast across western and southern Wisconsin late today and overnight. Milwaukee is in its potential path and it’s possible the line may reach Chicago before it begins to weaken.
SPC has outlooked the moderate risk area with 45% odds of wind gusts exceeding 50 knots (58 mph), and surrounds that area with a 10 percent probability of wind gusts over 65 knots (74 mph) all the way into southwest Michigan and extreme northern Indiana.

While SPC notes in their morning discussion that there’s uncertainty how far southeast the danger will extend, “activity should expand into an MCS (mesoscale convective system) capable of severe gusts and tornadoes across … southern/eastern Wisconsin this evening, shifting into the southern Lake Michigan and lower Michigan vicinity tonight. A derecho may occur, with embedded channels of hurricane-force gusts.”

But just what exactly is a derecho? And can they be predicted? SPC notes in the same discussion, “Whether or not the timing/location of the upscale storm transition permits the event to be classified officially as a derecho in hindsight, there is strong concern it will have that kind of intense and destructive wind impact for at least a few hours.”

Defining Derechos Is Complicated–Even for Meteorologists, as we noted in a detailed blog post on The Front Page last summer after Iowa’s widespread and costly damaging wind event. They aren’t “inland hurricanes” as they are often described, the post explains, but they can mimic the type of widespread damage seen with hurricane winds.
In their midday Convective Outlook update, SPC cautions that while “most guidance suggests the MCS will weaken late tonight as it moves into a slightly less moist/unstable air mass over MI/IN/OH … if mesoscale organization is sufficiently high, the complex could persist longer than model depictions.”
Have multiple ways to get warnings Weather.gov

Southeasterners Perceive Tornado Risk Dangerously Different Than They Should, Especially at Night

While a major winter storm last month was plastering the United States from Texas and New Mexico to New England with heavy snow and ice, volatile conditions in the Southeast (SE) spawned damaging and deadly tornadoes. One of these overnight Monday, February 16, tragically took the lives of 3 people and injured 10 in coastal North Carolina. Such nocturnal tornadoes are common in the Southeastern U.S.—a unique trait—and represent an extreme danger to sleeping residents.


Compounding this problem, new research in the AMS journal Weather, Climate, and Society suggests there may be a deadly disconnect between tornado perception and reality in the region right when residents instead need an acute assessment of their tornado potential.
The article “Do We Know Our Own Tornado Season? A Psychological Investigation of Perceived Tornado Likelihood in the Southeast United States,” by Stephen Broomell of Carnegie Mellon University, with  colleagues from Stanford and NCAR, notes the tragic results of the regional misperception:

The recurring risks posed by tornadoes in the SE United States are exemplified by the significant loss of life associated with recent tornado outbreaks in the SE, including the 2008 Super Tuesday outbreak that killed over 50 people and the devastating 27 April 2011 outbreak that killed over 300 people in a single day.

Their survey of residents in seven states, from Louisiana and Arkansas to Georgia and Kentucky, representing the Southeastern region, finds that the residents perceive their tornado likelihood differently than meteorologists and experts familiar with Southeastern tornado risk. This puts them at great risk because residents’ experiences don’t match what actually happens where they live.

Broomell and his fellow researchers contend that Southeast residents may be misusing knowledge of Great Plains tornado events, ubiquitous in tornado chasing reality shows and social media videos, when determining their own risk. A fatal flaw since tornado behavior is different between the two regions.
WCAS SE tornado season survey2
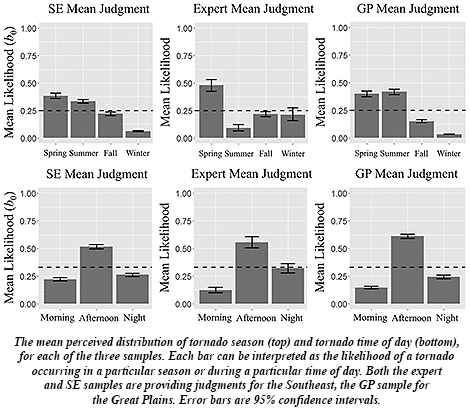
For starters, unlike in infamous “Tornado Alley” states of Texas and Oklahoma north through Nebraska and Iowa into South Dakota, the Southeast lacks a single, “traditional” tornado season, with tornadoes “spread out across different seasons,” Broomell along with his coauthors report, including wintertime. The Southeast also endures more tornadoes overnight, as happened last week in North Carolina. And they spawn from multiple types of storm systems in the Southeast, more so than in the Great Plains. This makes knowledge about residents’ regional tornado likelihood especially critical in Southeastern states.

Another recent study published in the Bulletin of the American Meteorological Society, “In the Dark: Public Perceptions of and National Weather Service Forecaster Considerations for Nocturnal Tornadoes in Tennessee,” by Kelsey Ellis (University of Tennessee, Knoxville), et al., surveyed residents of Tennessee and came away with similar findings about tornado timing: about half of Tennessee’s tornadoes occur at night, and yet less than half of those surveyed thought they would be able to receive nighttime tornado warnings.

Local forecasters and broadcast meteorologists as well as emergency managers are tuned into the mismatch. In the BAMS study, NWS forecasters said they fear for the public’s safety, particularly with nighttime tornadoes, because they “know how dangerous nocturnal events are”—fatalities “are a given,” some said.

Ellis and her colleagues recommended developing a single, consistent communication they term “One Message” to focus on getting out word about the most deadly aspect of the tornado threat. Forecasters, broadcasters, and emergency managers through regular and social media would then be consistent in their messaging to residents, the researchers state, decreasing confusion. For example:

Nighttime tornadoes expected. Sleep with your phone ON tonight!

With severe weather season ready to pop as spring-like warmth quickly overwhelms winter’s icy grip in the next couple of weeks, the nation’s tornado risk will blossom across the South and Southeast. And nocturnal tornado threats will only increase, particularly in the Southeast, as February turns into March, and then April—a historically deadly month.
For residents in places more prone to nighttime tornadoes, Ellis et al. say the ways to stay safe are clear:

Have multiple ways to get tornado warnings, do not rely on outdoor sirens, sleep with your phone on and charged during severe weather, and do not stay in particularly vulnerable locations such as mobile homes or vehicles.

An Anticipated Increase in Earth's Strongest Storms

Goni
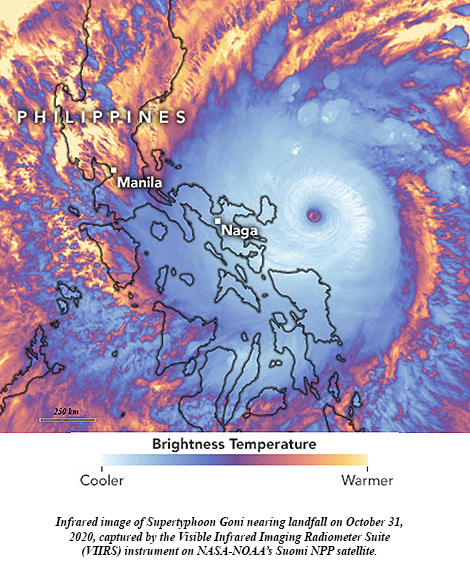
A little more than two weeks ago, Supertyphoon Goni blasted ashore in the Philippines with top sustained winds of 195 mph, becoming the strongest landfalling tropical cyclone on record. It topped STY Haiyan’s 190 mph land strike just seven years ago. With Hurricane Iota in the Caribbean explosively intensifying 100 mph in under 24 hours to reach Category 5 intensity Monday, it set a new record of five consecutive years of Cat 5 hurricanes in the North Atlantic tropical cyclone basin. Among the seven catastrophic hurricanes, starting with Matthew in 2016, were Dorian and Irma, packing 185 mph and 180 mph steady winds, respectively, with peak gusts well over 200 mph.
Goni is the latest formidable example of an increasing trend in tropical cyclone intensity. While Goni established a new landfall wind intensity record, Iota and other recent major hurricanes Eta, Zeta, and Delta set or challenged records for most intense hurricanes so late in the season.
Percentiles
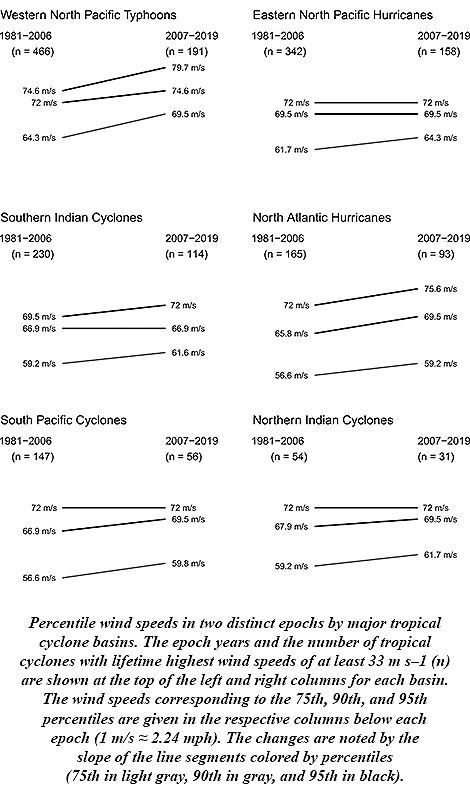
James Elsner of Florida State University says this is to be expected. His research stated in 2008 that there was an upward trend in the intensity of the most intense tropical cyclones. Rising ocean temperatures, as theory predicted, were driving the trend. And with oceans continuing to warm along with Earth’s climate since then, Elsner anticipated the continuing upward trend. New research published in the Bulletin of the American Meteorological Society confirms his prediction, finding that another 3.5 to 4.5 percent increase in intensity has occurred with the strongest tropical cyclones during the period 2007-19.
Globally, all basins show upward trends, Elsner says, with the North Atlantic and Western North Pacific revealing the steepest and most consistent upticks.

"Sleep with your phone on!": Messaging for Nighttime Tornadoes

With Hurricane Delta poised to strike Louisiana today, the risk of embedded tornadoes will increase as rainbands spiral ashore, along with the primary threats of storm surge and damaging winds. Delta is forecast to plow well inland Friday night into the weekend, continuing a low risk for tornadoes, some of which could occur at night in Alabama, Mississippi and into southern Tennessee. The threat is more than a bit worrisome as new research in BAMS finds through phone surveys and followup interviews in Tennessee that people are woefully unprepared for nocturnal tornadoes.
In their article,” Kelsey Ellis and colleagues found a host of poor practices by residents when it comes to tornadoes at night. The authors recommend forecasters narrow their messaging about nocturnal tornadoes in the Southeast to a single important message to limit confusion.
Almost half of Tennessee’s tornadoes occur at night, as in other Southeast states with large numbers of nocturnal tornadoes, and are two-and-a-half times as deadly as daytime tornadoes. This creates detection, warning, and public response challenges. Yet, respondents in the western part of the state overestimated tornado occurrence at night while those in the east substantially underestimated the number.
Additionally, nearly half of participants in the survey say they rely on sirens to receive tornado warnings. This is despite the fact that sirens are not designed to warn people inside nor be loud enough to wake anyone up. Instead, Wireless Emergency Alerts (WEAs) “should be a constant,” the authors say. Also, people mentioned they rely on TV and social media for receiving warnings even though generally neither will wake you up.
The authors felt it was “dangerous” that even the more tech savvy and tornado aware respondents answered they were compelled to look outside for evidence of a tornado—even in the dark. Interviewees explained they were “checking for sounds instead of visual cues.”
NWS forecasters were also surveyed about nocturnal tornadoes. The forecasters mentioned the lack of ground truth and fear for public safety among challenges to the nighttime warning service. They noted few spotter or social media reports inform them if “the storm is actually showing the signs on the grounds that radar is indicating aloft.” Forecasters said they felt “fearful, worried, or nervous for the public during nocturnal tornadoes because fatalities ‘are a given.’”
The survey responses moved Ellis et al. to recommend a single-emphasis message be presented to residents to combat the nighttime tornado problem:

One strategy that may improve public safety during a nocturnal tornado event, and which addresses the forecaster challenge of communication prior to and during an event, is to develop “One Message”—a consistent message that EMs and the media use throughout broadcasts, briefings, and social media. Examples of messages could be: “Nighttime tornadoes expected. Sleep with your phone ON tonight!” or “Tornadoes will form quickly! Make plans now where you will take shelter!” or “If you live in a manufactured home, you may not have much time to seek shelter tonight!” One Message may decrease confusion for receivers, making them more likely to make safe decisions. Messages could similarly be used to dispel misconceptions about local geography in ways relevant to the specific listening area, for example: “You are not protected by nearby hills. Seek shelter immediately!”

With Hurricane Delta’s nighttime tornado threat ramping up, the authors suggest people use multiple ways to receive warnings, keeps phones on and charged, don’t rely on tornado sirens, and if possible relocate ahead of the weather from “particularly vulnerable” situations, such as mobile homes and vehicles.

Hurricane Sally's Extreme Flood Potential

Hurricane Sally is inching ashore in southeast Alabama Wednesday morning and has started to flood parts of the central Gulf Coast with an expected 1-2 feet of rain, maybe more. With that much rain forecast, it seems likely to join other recent catastrophic flood disasters Harvey (2017) and Florence (2018) in ushering in a new era of rainier storms at landfall that bring with them an extreme rain and flooding threat.
Sally_rainfall-3
Recent research by NOAA’s Tom Knutson and a team of tropical weather and climate experts in the March Bulletin of the American Meteorological Society and blogged about here determined with medium-to-high confidence that more and more hurricanes in our future warming world will be wetter at landfall.
And with more wetter storms on the way, better communication about these potentially deadly impacts from copious rainfall is needed. Another BAMS article we blogged about addressed this by creating an Intuitive Metric for Deadly Tropical Cyclone Rains. Its authors designed the new tool—the extreme rainfall multiplier (ERM)—to easily understand the magnitude of life-threatening extreme rain events.
Co-author James Kossin explained to BAMS:

Water presents a much greater hazard in a hurricane than wind does, but the Saffir-Simpson categories are based on wind-speed alone. Salt-water hazards along and near the coast are caused by storm surge. Coastal residents are warned about these hazards and are provided with evacuation plans. Fresh-water flooding from extreme hurricane rainfall, however, can happen inland away from evacuation zones, and pose the greatest threat to life and property in these areas where people tend to shelter-in-place. Compound hazards such as dam failures and land-slides in mountainous regions pose additional significant threats. In this case, effective warnings and communication of the threats to inland populations is paramount to reduce mortality. This work strives to present a tool for providing warnings based on people’s past experience, which gives them a familiar reference point from which to assess their risk and make informed decisions.

Lead author Christopher Bosma:

We started out this project focused on analyzing the catastrophic and record-breaking rainfall associated with Hurricane Harvey. But, as we started to finish our analysis of that system, just a year later, Hurricane Florence brought devastating and torrential rainfall to the Carolinas, which forced us to go back and revisit some of our initial analysis. The fact that multiple major storms happened in quick succession grabbed a lot of headlines, but, from a research and scientific perspective, it also provided a chance to note how the messaging used to describe these systems had changed (or not) and think of other ways to use the metric we had developed.

ERM is not yet operational, but that is the researchers’ goal, to “convey effective warnings to people about fresh-water flooding threats,” Kossin says.
Hurricane Sally is one such extreme rainfall flood threat, with “significant to historic flooding” likely, the National Weather Service says.

State of the Climate: It's All Connected

Today’s publication of State of the Climate in 2019 marks the 30th annual release in this series of supplements to the Bulletin of the American Meteorological Society. The report is not just a service for immediate use as the latest status report on climate. It’s a resource that people worldwide will use throughout the year, and indeed as a reference through the coming years. The report, now online only, is meant to stand a test of time as a bedrock of other reports and decisions.
SOCcover2Despite the rapid pace of writing, editing, and reviewing, this is obviously not the first (or last) assessment of 2019’s climate. So we still often get asked—why now? Why release in August 2020 a comprehensive, validated check-up on the health of our planet’s climate in 2019 August, instead of in January, when it’s still hot news?
Co-editor Jessica Blunden of NOAA addressed the question a number of years ago, with a helpful look behind the scenes of State of the Climate. You can appreciate, first of all, the amazing job she and coeditor Deke Arndt (also of NOAA) do to pull this all together so fast—they’re coordinating the work of more than 500 authors and chapter editors from 61 different countries. So naturally, at first glance, churning out this report in only a matter of months is a managerial triumph–a testament to international cooperation:

The production of this document really does “take a village”; without the dedication and hard work of every single one of the people who contribute to this process, the quality and scope of the report would not be possible. Each year the number of authors tends to increase as we add new information to the report.

SOCauthormap2
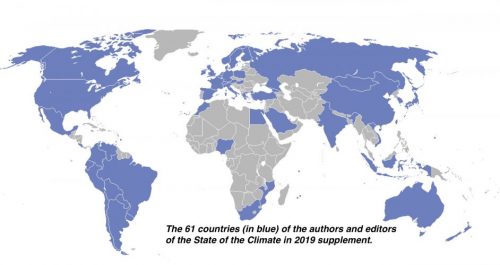
In just the past decade alone Blunden and Arndt have added 150 authors and 13 additional countries. Why so many authors?

The authors are asked to contribute based on their expertise in a specific field. For our Regional Climates chapter, which is comprised of annual summaries for countries around the world, the authors are often affiliated with a specific country’s official meteorological/hydrological agency and provide analysis based on data from that agency. it’s not just any process of coordination. State of the Climate is an elaborate scheme to make a scientifically worthwhile document:

The development of the report is quite rigorous, with writing, two major peer-review processes, technical editing, layout, and approval. After the calendar year has ended, authors are given about six weeks to develop their content and provide an initial draft that is reviewed by the chapter editors.
Then the chapter editor has the draft reviewed by two or three scientists with expert knowledge in that field. Generally, we allow one to two weeks for this review to be completed and another one to two weeks for the authors to make revisions, as needed, and for the chapter editors to prepare the new version for a formal, external review.
The external review process involves anonymous peer reviews, and BAMS allows three weeks for these reviews to be completed. The authors and chapter editors then have two weeks to make revisions based on these comments and submit the final draft for approval.

Then there’s editing and layout and so on . . . as Blunden summarizes:

This document takes the time to provide the most accurate information available on the state of the climate system.

But the time isn’t actually about writing and reviewing; it’s the comprehensiveness of 429 pages and a bazillion references (no, we didn’t count them). A report that started as a 30-pager gets bigger and more precise with each iteration, because the value increases:

The longer a data record is and the larger the area it covers, the more useful it is for putting a particular climate indicator into context, for example comparing one year to another, or detecting trends over time. Today we are fortunate to have technologies and capabilities that were not available to us decades ago, such as satellite observations, but to use all those observations for climate research means combining observations from multiple sources into a single, seamless climate data record, which is neither fast nor easy.
With both satellite and direct observations, it is important to reconcile data discrepancies and inaccuracies so that the climate records are correct, complete, and comparable, and this painstaking process can take years. For our report, a high-quality dataset is ready for inclusion only after its development processes and methodologies have been scrutinized through peer review with published results. That way readers of the State of the Climate reports can depend on detailed journal articles if they want to understand the details of a data record.
The process of creating a climate quality data set and then having it evaluated by other scientists through peer review is so challenging, no more than a few are added to the State of the Climate report each year.

So the State of Climate is a testament to a complex process, with complex, interrelated data sources that cry out for the reconciliation and comparison that makes the report unique. And of course, all about a climate that is nothing if not the paragon of complexity.
As Deke Arndt explains about Earth’s climate (in a webinar to watch before using State of the Climate): “If the Earth didn’t spin, and we didn’t have day and night, it would be very simple.”
That sums up the reason the State of the Climate is not simple . . . or small, or fast. It is all connected.


The Forecast for Huge Numbers of Hurricanes in 2020: Not a "New Normal"

Thursday NOAA updated its forecast to an “extremely active” Atlantic hurricane season. That has some news outlets linking the  19-25 predicted named storms to Earth’s future—even warmer—global climate. The future looks like it will indeed bring high levels of overall “activity” due to the intense, damaging hurricanes of a warming world (regardless of whether the frequency of storms overall changes). And, of course, settling into a new “norm” isn’t going to happen while warming is ongoing. But the huge number of storms forming? That’s a lot of what the public takes away from the forecast, and that profusion of named storms is not projected to be characteristic of seasons to come.
As we blogged here in May, recent research published in the Bulletin of the American Meteorological Society finds there’s no evidence to support an increasing trend in tropical cyclone frequency.
NOAA-2020-outlook-update2
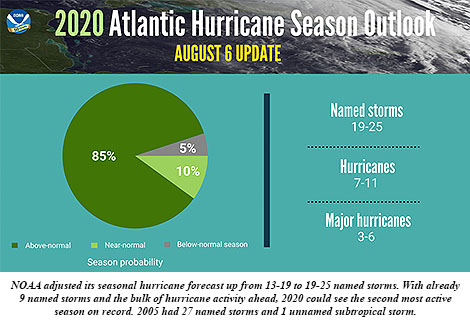
In that assessment of the current literature, Tom Knutson (NOAA) and other top tropical experts reviewed a number of peer-reviewed studies and determined that a majority found the numbers of named storms actually decrease in climate projections as we move deeper into this century. But there was no consensus among the authors to either support or refute those studies since their research also showed that “there is no clear observational evidence for a detectable human influence on historical global TC frequency.”
Their assessment did find that we can expect stronger and wetter hurricanes in our warming world and, notably, a possible uptick in the number of intense (Category 4 and 5) hurricanes. It’s these storms that have Knutson and his colleagues most concerned since a majority of hurricane damage is done by the big ones. Their increase is alarming even if the number of storms goes down.
Notable with this week’s forecast update is a prediction close to record territory. “We’ve never forecast up to 25 named storms” before—more than twice a season’s typical 12—noted Jerry Bell, lead seasonal hurricane forecaster at NOAA’s Climate Prediction Center. He went on to say there will be “more, stronger, and longer-lived storms than average” in the Atlantic Basin, which includes the Caribbean Sea and Gulf 0f Mexico. In an average season there are six hurricanes,  and three of those grow into major hurricanes.

Isaias' Forecast Rains, Evaluated Through the New ERM Perspective

Tropical Storm Isaias is soaking the Mid-Atlantic states with what is expected to be three times as much rain as is typical for the area. Today’s heaviest tropical showers could trigger potentially deadly flash floods.
The projection is the finding of a new Intuitive Metric for Deadly Tropical Cyclone Rains, which we blogged about on The Front Page in June. The extreme rainfall multiplier (ERM) used the quantitative precipitation forecast (QPF) from the Storm Prediction Center last night to generate an ERM forecast for Isaias.
Isaias
“Since Isaias is a fast-moving storm (currently moving NNE at 23 mph), the heaviest rain is forecast to fall with[in] a 24-hour period today (Aug 4)”, wrote the study’s lead author, Christopher Bosma, a Ph.D. student at the University of Wisconsin-Madison, in a-pre-dawn e-mail. “Peak rainfall totals are projected to be just over 6 inches (approx. 150 mm), mostly in a narrow region just south of the DC Metro [area].”
In contrast, the region’s heaviest single-day, 2-year rainfall event is a bit more than 50 mm. Bosma uses that comparison in generating an ERM around 2.86 (152 mm / 53 mm). Rainfall may exceed the projections, but that gives a rough idea of how the storm compares to others in residents’ recent memory.
According to the study, which was published in the Bulletin of the American Meteorological Society in May, the average value of an ERM in U.S. landfalling hurricanes and tropical storms is 2.0. ERMs can hindcast the severity of precipitation for such storms, like 2017’s Hurricane Harvey. Harvey deluged Texas with as much as 60 inches of rain and reached an ERM of 6.4—the highest calculated.
Those having lived in the D.C. area in the early 2000s might recall a tropical storm that Bosma says is comparable to Isaias: Isabel. After landfall in eastern North Carolina as a Cat. 2 hurricane the morning of September 18, 2003, it barreled north-northwest through the Mid-Atlantic delivering flooding rains and damaging winds that night.
“Isabel was also a fast mover at landfall, and was responsible for similar one-day rain totals of just over 6 inches, based on CPC-Unified gauge-based gridded data,” Bosma wrote.” The peak ERM for Isabel was 2.8. One thing to note from Isabel is that localized rainfall totals were higher in some spots, particularly in the mountains of Virginia, highlighting the threat of localized flash flooding that might also be present today with Isaias.”
Isabel
Indeed, flash flood warnings were issued all across the interior Mid-Atlantic this morning. This was despite drought conditions in parts of the area.
Bosma and colleagues Daniel Wright (UW-Madison), J. Marshall Shepherd (University of Georgia), et al., created the ERM metric to focus on the deadly hazard of extreme tropical cyclone rainfall. Getting word out about the threat using only the wind-based Saffir-Simpson Scale “was a problem brought to light with Hurricanes Harvey and Florence,” Shepherd says.
Wright also in an e-mail last night stated that for Isaias in and around Washington, D.C., it’s “a fairly large amount of rain, though certainly not unprecedented for the region.”
Recurrence

Saildrone's Science at the Air–Sea Interface

The Saildrone vehicle returning to San Francisco on 11 Jun 2018. The wind anemometer is visible at the top of the wing and solar panels are on both the wing and the vehicle hull. Image credit: Saildrone/Gentemann.
The Saildrone vehicle returning to San Francisco on June 11, 2018. The wind anemometer is visible at the top of the wing and solar panels are on both the wing and the vehicle hull. Image credit: Saildrone/Gentemann.

 
You’ve heard of drones in the air, but how about on the ocean’s surface? Enter Saildrone: A new wind and solar powered ocean-observing platform that carries a sophisticated suite of scientific sensors to observe air–sea fluxes. Looking like a large windsurfer without the surfer, the sailing drone glides autonomously at 2–8 kts. along the surface of uninhabited oceans on missions as long as 12 months, sampling key variables in the marine environment.
In a recent paper published in the Bulletin of the American Meteorological Society, author Chelle Gentemann and her colleagues explain that from April 11 to June 11, 2018, Saildrone cruised on a 60-day round trip from San Francisco down the coast to Mexico’s Guadelupe Island to establish the accuracy of its new measurements. These were made to validate air–sea fluxes, sea surface temperatures, and wind vectors derived by satellites. The automated surface vehicle also studied upwelling dynamics, river plumes, and the air–sea interactions of both frontal and diurnal warming regions on this deployment—meaning Saildrone’s versatile array of instruments got a workout not only above surface but just below it as well, in the water along the hull.

BAMS asked a few questions of the authors to gain insight into their research as well as their backgrounds. A sampling of answers are below:

Chelle Gentemann
Chelle Gentemann

BAMSWhat would you like readers to learn from your article?

Chelle Gentemann, Farallon Institute: New measurement approaches are always being developed, allowing for new approaches to science. Understanding a dataset’s characteristics and uncertainties is important to have confidence in derived results.
BAMSHow did you become interested in working with Saildrone?
Gentemann: The ocean is a challenging environment to work in: it can be beautiful but dangerous, and gathering ship observations can require long absences from your family.  I learned about Saildrones in 2016 and wanted to see how an autonomous vehicle might be able to gather data at the air–sea interface and adapt sampling to changing conditions.  There are some questions that are hard to get at from existing remote sensing and in situ datasets; I thought that if these vehicles are able to collect high-quality data, they could be useful for science.
BAMSHow have you followed up on this experiment? 
Gentemann: We sent two more [Saildrones] to the Arctic last Summer (2019) and are planning for two more in 2021.  There are few in situ observations in the Arctic Ocean because of the seasonal ice cover, so sending Saildrones up there for the summer has allowed us to sample temperature and salinity fronts during a record heat wave.
Sebastien de Halleux, Saildrone, Inc.: I believe we are on the cusp of a new golden age in oceanography, as a wave of new enabling technologies is making planetary-scale in situ observations technically and economically feasible. The fact that Saildrones are zero-emission is a big bonus as we try to reduce our carbon footprint. I am excited to engage further with the science community to explore new ways of using this technology and developing tools to further the value of the data collected for the benefit of humanity.
BAMSWhat got you initially interested in oceanography?
de Halleux: Having had the opportunity to sail across the Pacific several times, I developed a strong interest in learning more about the 70% of the planet covered by water—only to realize that the challenge of collecting data is formidable over such a vast domain. Being exposed to  the amazing power of satellites to produce large-scale remote sensing datasets was only tempered by the realization of their challenges with fine features, land proximity, and of course the need to connect them to subsurface phenomena. This is how we began to explore the intersection of science, robotics, and big data with the goal to help enable new insights. Yet we are only at the beginning of an amazing journey.
BAMS: What surprises/surprised you the most about Saildrone’s capabilities?
Peter Minnett, Univ. of Miami, Florida: The ability to reprogram the vehicles in real time to focus on sampling and resampling interesting surface features. The quality of the measurements is impressive.
Saildrones are currently deployed around the world. In June 2019 , there were three circumnavigating Antarctica, six in the U.S. Arctic, seven surveying fish stock off the U.S. West Coast and two in Norway, four surveying the tropical Pacific, and one conducting a multibeam bathymetry survey in the Gulf of Mexico. In 2020, Saildrone, Inc. has deployed fleets in Europe, the Arctic, the tropical Pacific, along the West Coast, the Gulf of Mexico, the Atlantic, the Caribbean, and Antarctica. NOAA and NASA-funded Saildrone data are distributed openly and publicly.