CalFiDE: Observing Large-Scale Fires from the Air and the Road

Mosquito Fire and plane propeller

A Research Spotlight from the 14th Annual Fire and Forest Meteorology Symposium, 2–4 May, 2023

Through the smoke of record-setting Canadian wildfires–which continue to burn millions of acres in the north–the importance of understanding huge, landscape-scale fires has never been clearer. In a 4 May presentation in the ninth session of the 14th Fire and Forest Meteorology Symposium, Brian Carroll discussed recent efforts to gather scientific observations on these types of landscape-scale wildfires in California and Oregon through CalFiDE, the California Fire Dynamics Experiment. His team looked at the behaviors of these fires and the winds they create and interact with, as well as the impacts of smoke plumes on air quality.

Field observations of wildfires this large are very rare. The CalFiDE team (including scientists from NOAA, CIRES, San Jose State University, the University of Nevada Reno, and NASA) used airborne and ground-based vehicles and a satellite to take measurements of five fires in August–September 2022. That included the Mosquito Fire, the largest in California that year, which burned more than 76,000 acres and prompted evacuation orders for 11,000 people. 

Carroll described the difficult and potentially dangerous process of conducting continuous observations of huge fires, without getting in the way of firefighters and emergency managers.

“There’s an aircraft exclusion zone that’s dedicated for the firefighters,” he notes. “The pilots have that information and avoid those areas but the pilots’ own decisions to keep our aircraft safe against the strong fire-generated winds and smoke are also a big driver. Even at a safe distance from the strong updraft produced by the fire, the wind convergence into the smoke column had to be compensated for by angling the plane away.” 

They were aided by state-of-the-art mobile Doppler lidar systems that allowed them to map air and fire behaviors over large distances in complicated terrain. “There are few lidars in the world capable of making these wind measurements while moving, and that mobility is important when dealing with wildfires that are constantly evolving,” Carroll says. “The lidars also provide real-time information on the winds and location of smoke layers, and we use that information to optimize sampling patterns and target layers for sampling trace gases.”

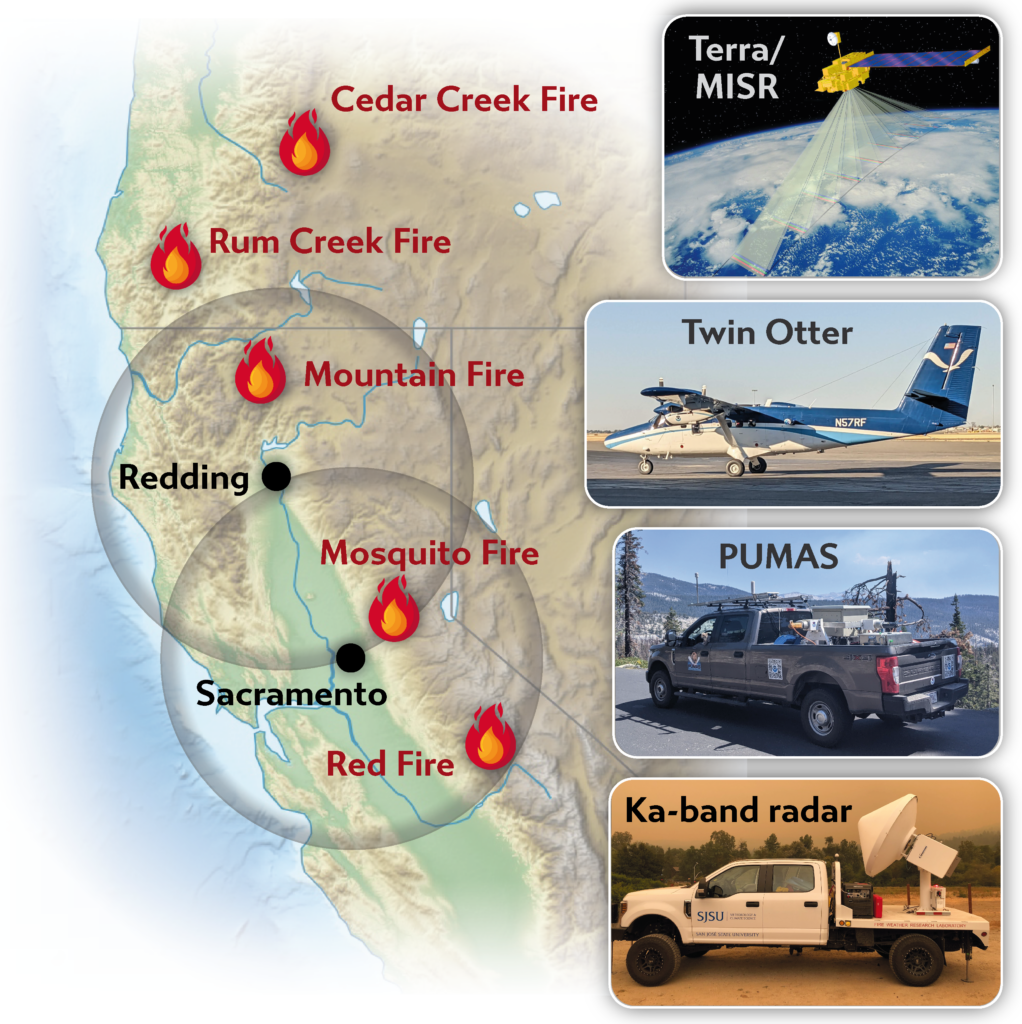
The CalFiDE team conducted surveys with a NOAA Twin Otter airplane, using Doppler lidar, infrared imaging, and trace gas measurements. They also drove an instrumented pickup truck (known as PUMAS, the Pick-Up-based Mobile Atmospheric Sounder) on the outskirts of the fire with additional Doppler lidar and temperature measurements, getting a 3-D picture of the winds above the truck as they drove. Meanwhile, the Multi-angle Imaging SpectroRadiometer (MISR) instrument aboard NASA’s Terra satellite provided a broad swath of smoke distribution information from space.

Above image: Fires observed during the 2022 CalFiDE campaign. Aircraft bases of operation with 1-hour flight range ring are shown in black, and platforms involved are on the right. The Twin Otter and PUMAS both had scanning Doppler lidars capable of profiling winds while underway.

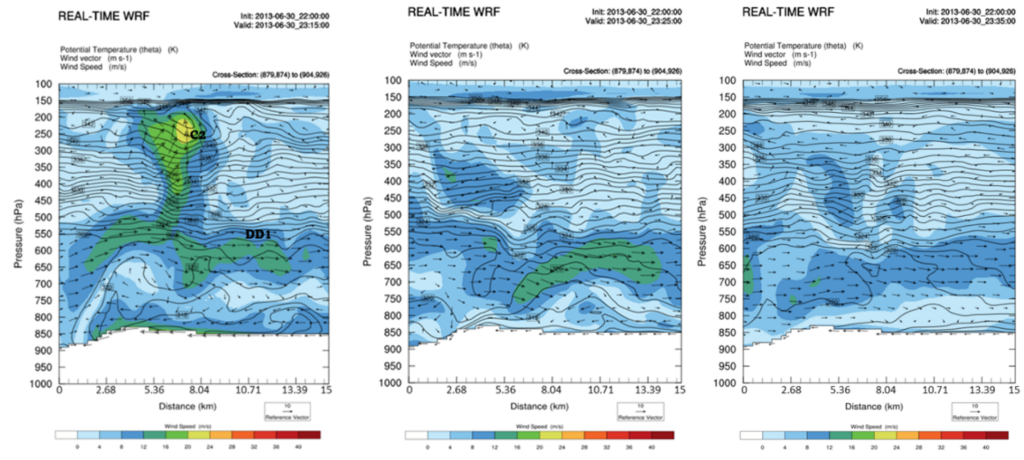
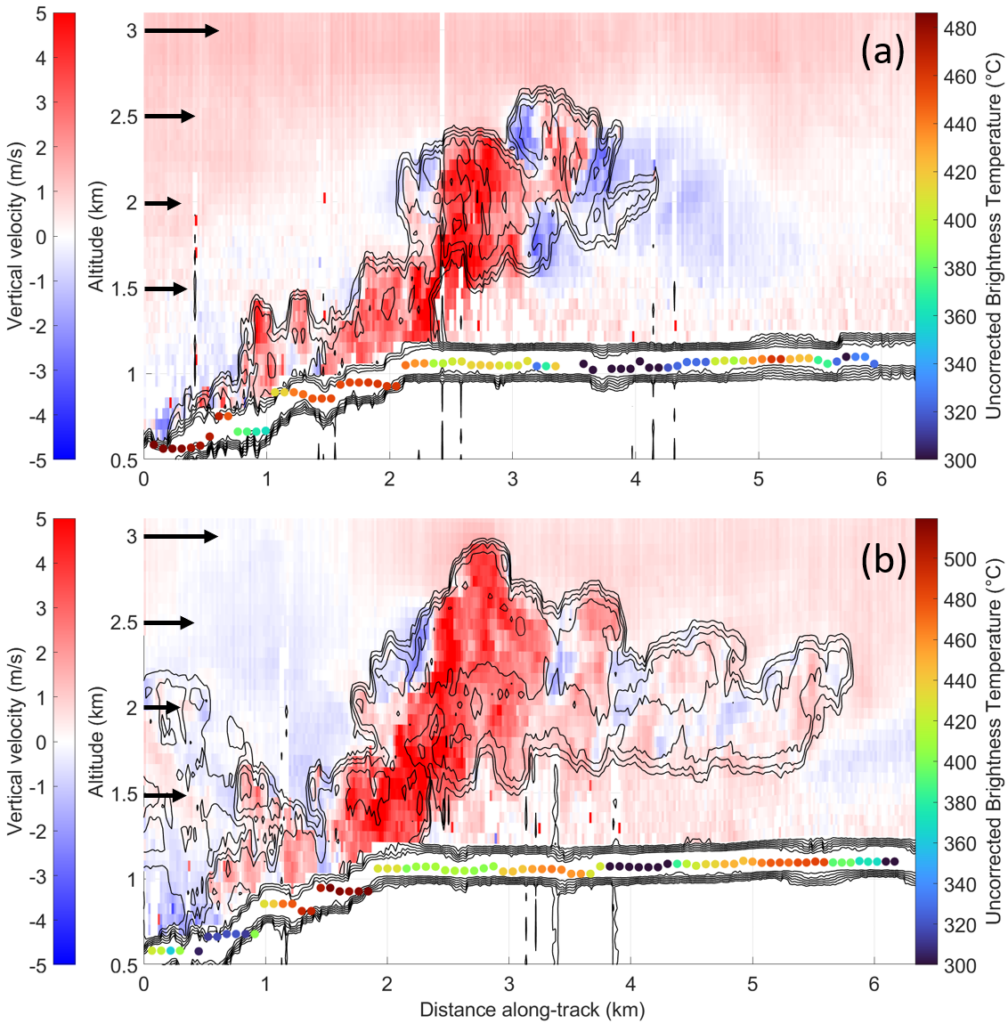
The airborne lidar provided cross-sections of fire updraft cores (areas of hot, rising air) and smoke plume motions, complemented by the infrared imagery capturing the fire’s shape and evolving intensity. These are some of the first measurements of their kind, and will provide important ground-truth comparisons for fire and air quality modeling.

Plots of airborne Doppler lidar measurements show a side-view cross section of smoke plumes over fire. These are vertical profiles of upward/downward winds (vertical velocity) from the Mosquito Fire on 8 September, 2022, taken at 7:03 pm (top) and and 7:17 pm (bottom). Darker red indicates faster upward air movement, and the black lines correspond to the smoke plume. Black arrows show wind speed and direction at different heights. Colored dots show the altitude of the ground surface and the “brightness temperature” (intensity of the fire heat) at each location based on longwave infrared imaging.

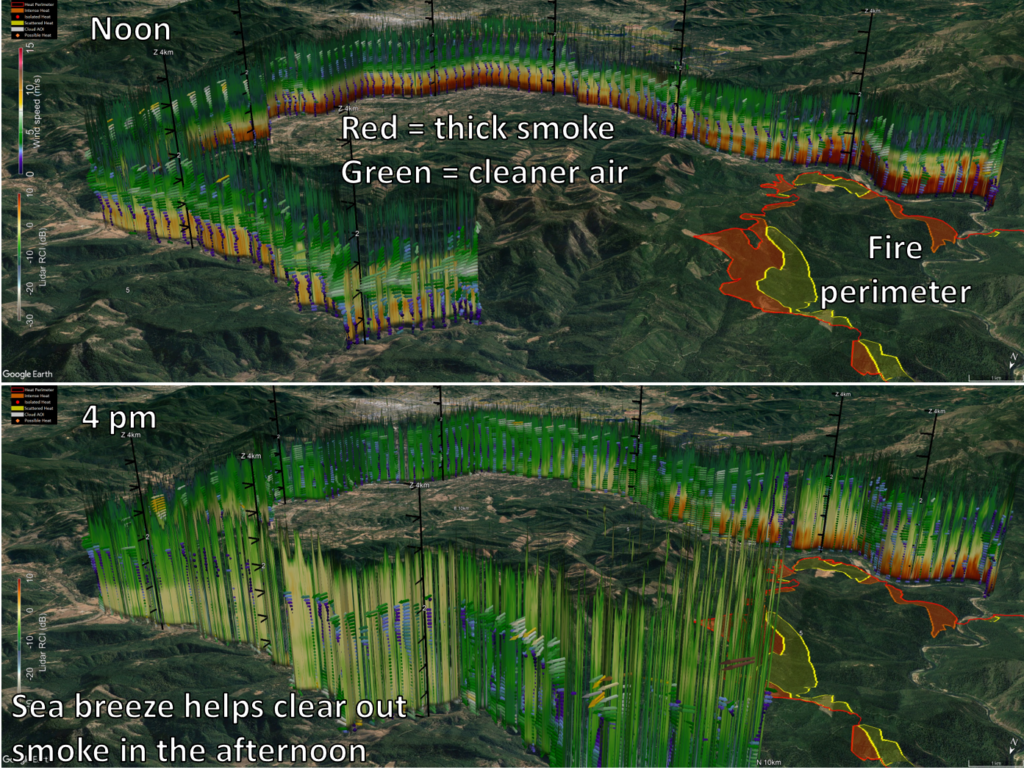
PUMAS observations also allowed the team to generate a high-resolution picture of smoke behavior in nearby areas—for example, the ways smoke lingered in valleys during calm conditions, and how rapidly air quality improved when sea breezes disrupted the smoke layer.

“Driving around these local valleys, in a few kilometers you could have a huge change in how much smoke there was, and a large change in temperature. And there’s a major change in boundary layer dynamics as you move in and out of those regions.”

Brian Carroll, Research Scientist at CIRES/NOAA

PUMAS data showing smoke-filled valleys. Very high concentrations of smoke in the morning, confined in the lowest 500 meters (top panel), transitioned to cleaner air (bottom panel) with the introduction of a sea breeze that traveled through the valleys. Data curtains (colored vertical stripes) depict lidar attenuated backscatter, which correlates with smoke concentration, along a 56 km driving route. Arrows show wind direction, with size and color indicating wind speed.

“The West Coast of the United States has experienced terrible fire seasons recently, with smoke impacting the lives of millions and fires themselves displacing many others. People across the U.S. and Canada have gained additional insight this year into what that’s like. We need more comprehensive information about how these fires grow, how the smoke moves, and the atmospheric conditions that interact with the fires, as we face a future that will likely see even more extreme fire seasons. The CalFiDE team’s efforts will help meet those needs,” Carroll says.

An article providing an overview of CalFiDE has been submitted for publication in the Bulletin of the American Meteorological Society

Brian Carroll is a research scientist with the Cooperative Institute for Research in Environmental Sciences (CIRES), working in The NOAA Chemical Sciences Laboratory (CSL) Atmospheric Remote Sensing Program.

The recording of this session is now publicly available here.

About 14Fire

Meteorology and wildfires are intimately interconnected—and wildfires are becoming increasingly severe and frequent in many parts of the United States. From local residents and firefighters on the ground to planners and insurers, to people hundreds of miles away breathing wind-driven smoke, society relies on our ever-improving ability to understand and forecast fires and the related atmospheric conditions. The American Meteorological Society’s 14th Fire and Forest Meteorology Symposium brought together researchers and fire managers to discuss the latest science. All conference presentations are now publicly available.

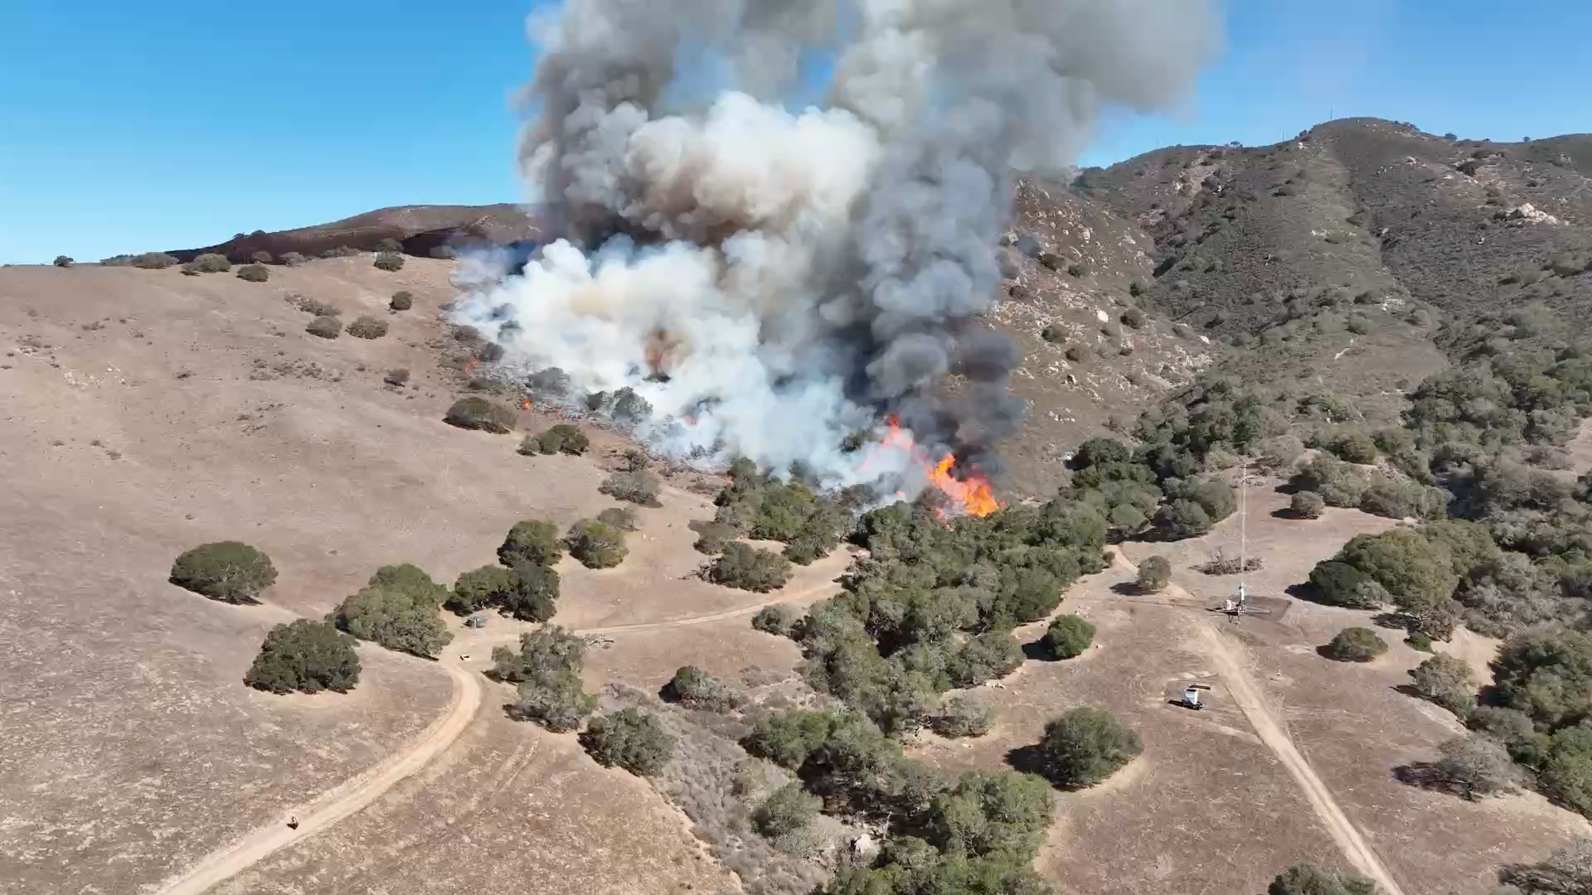
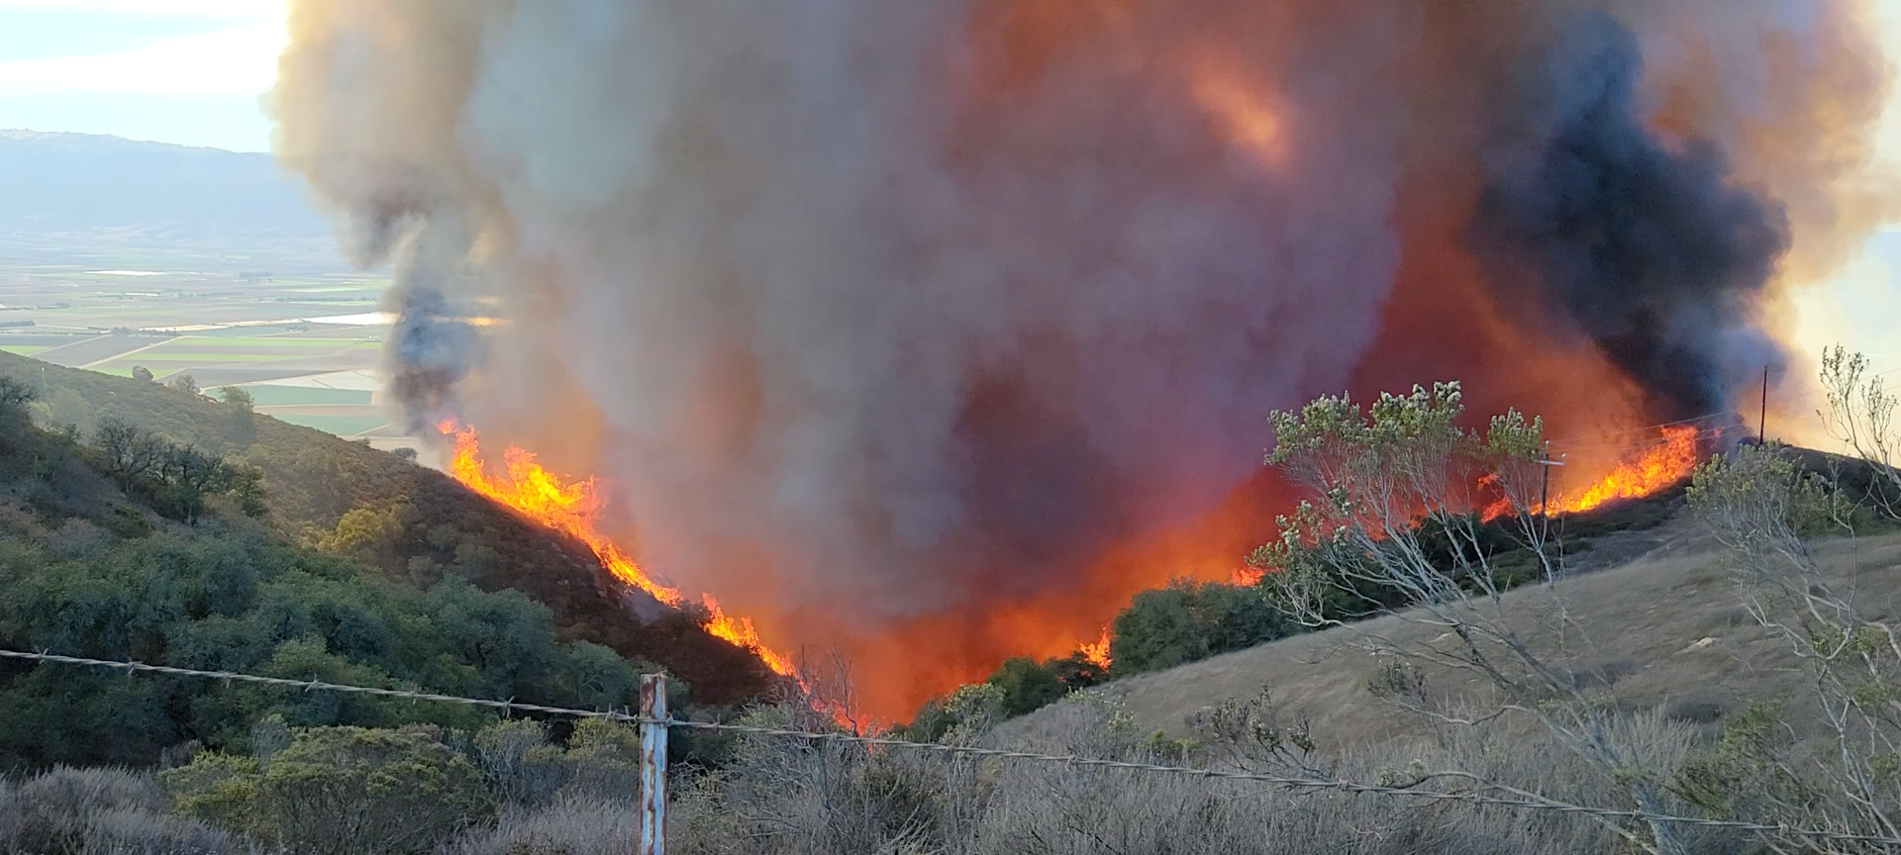
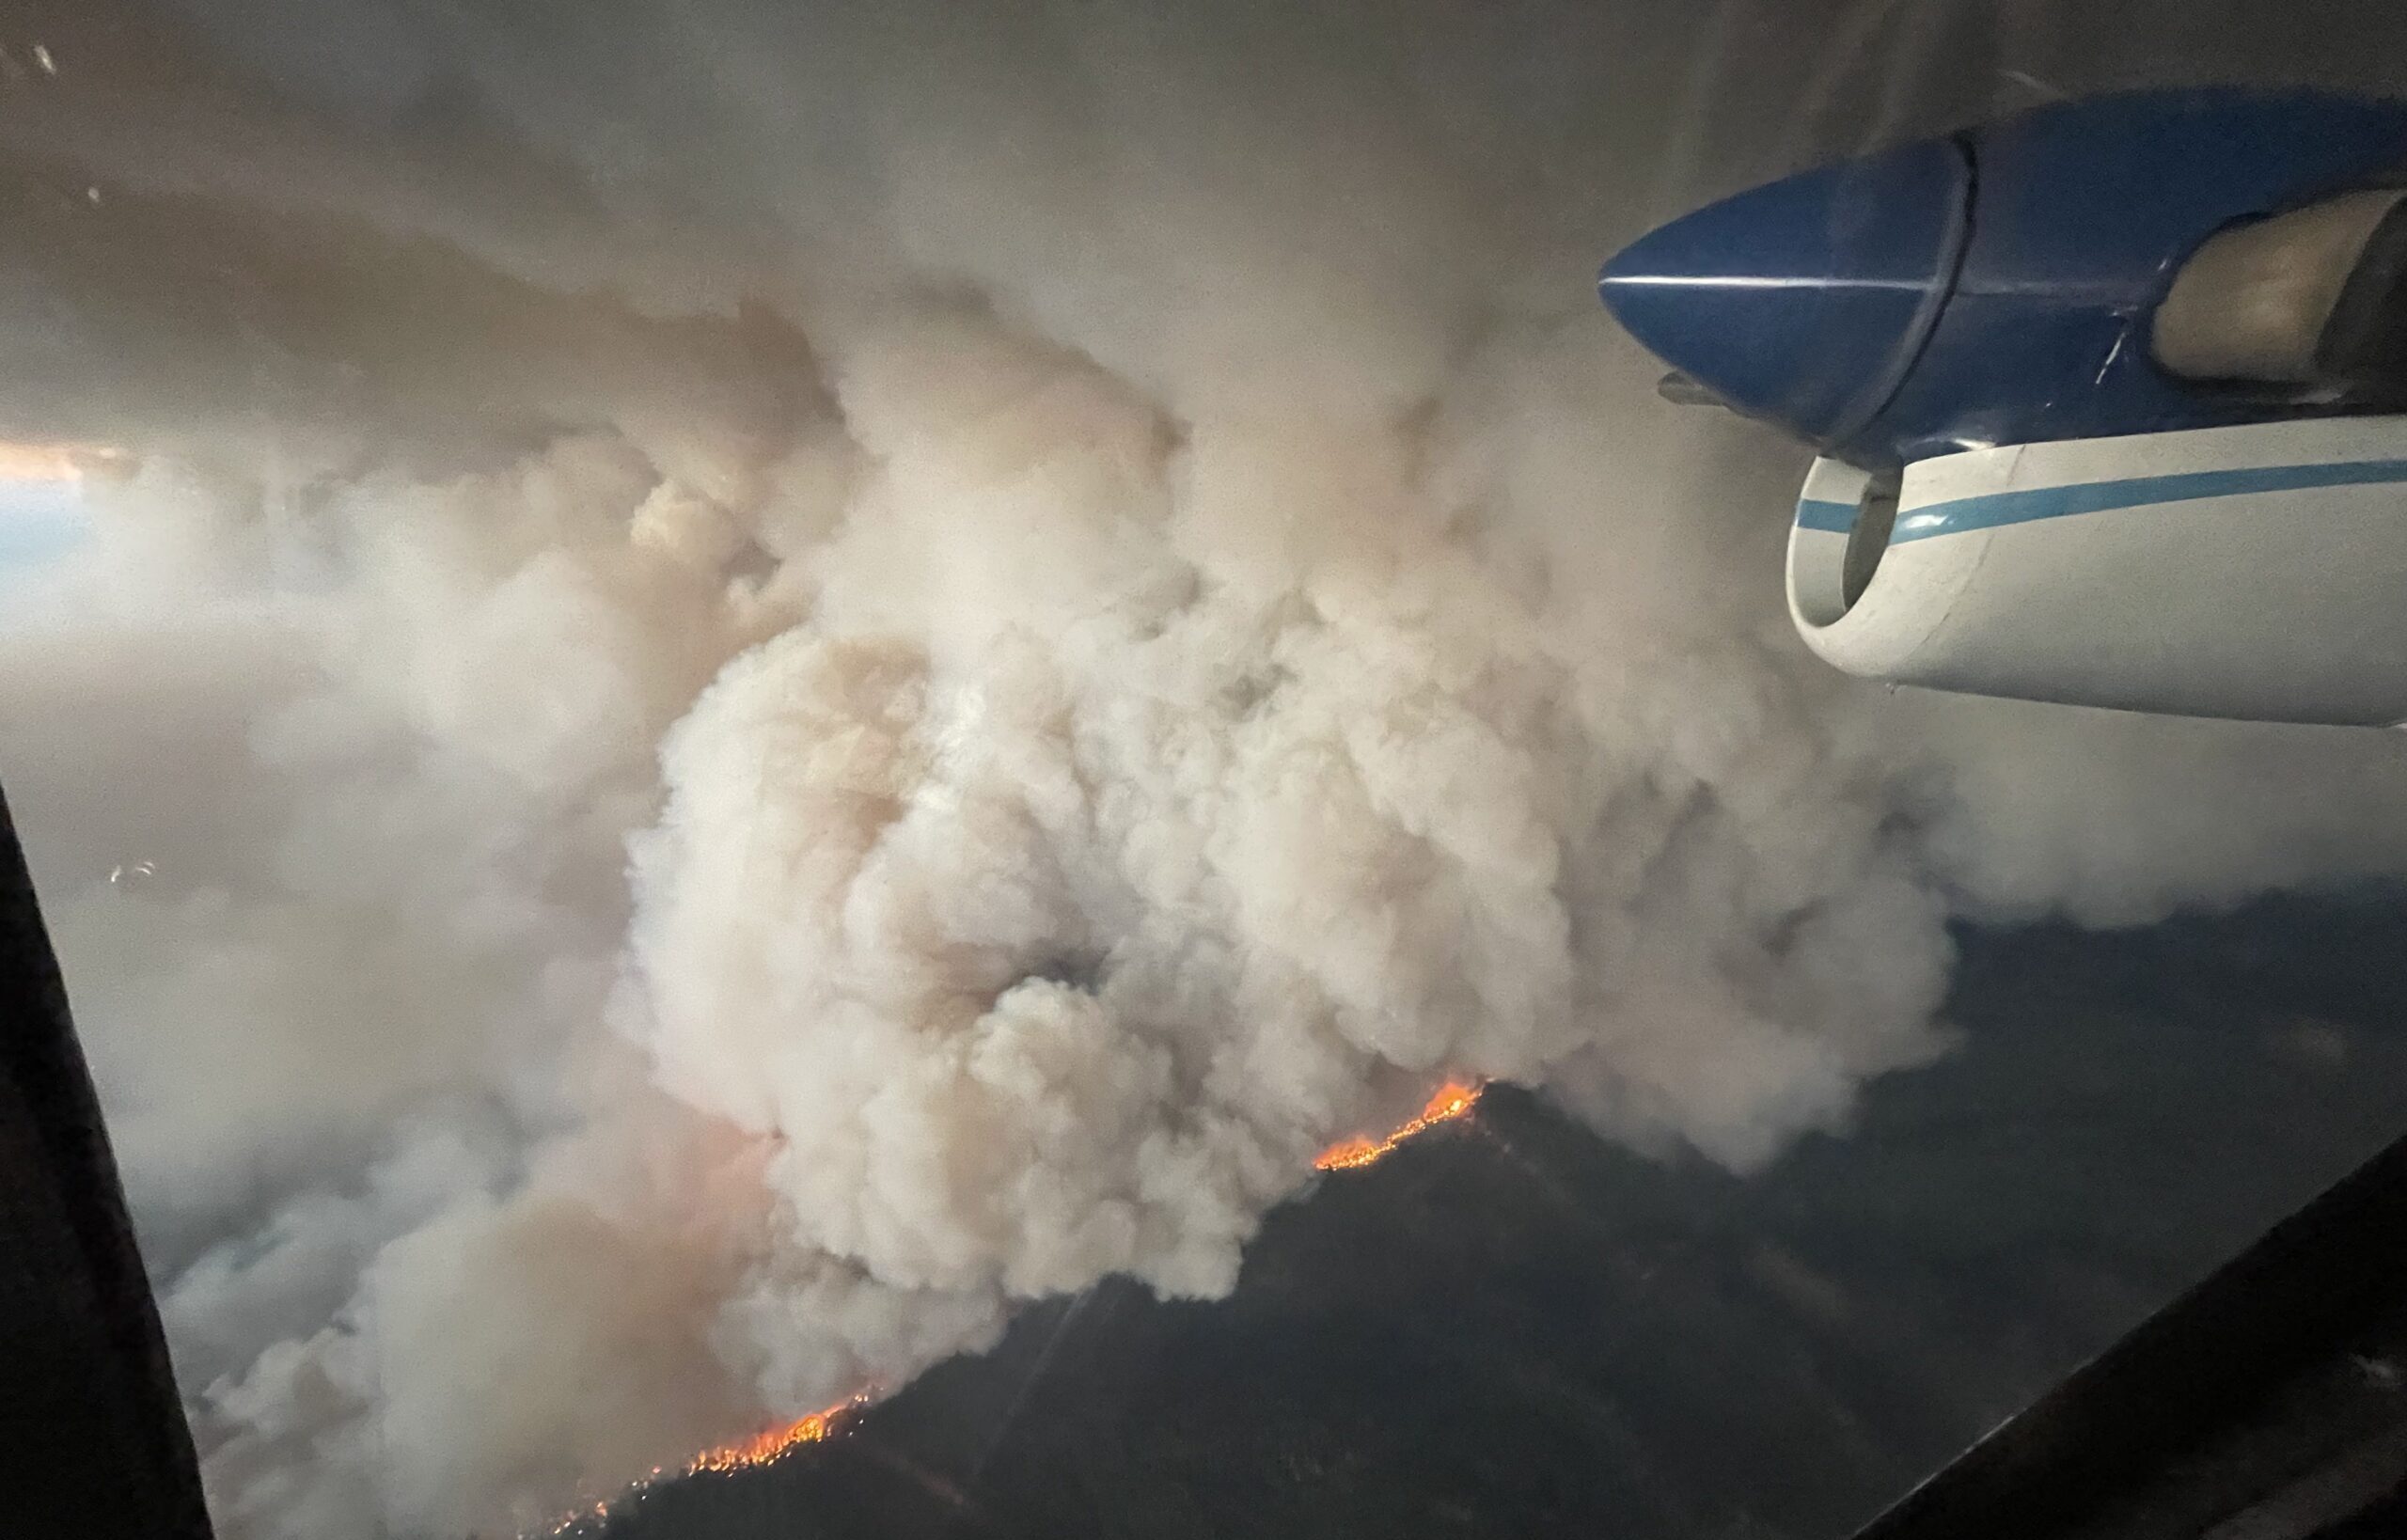
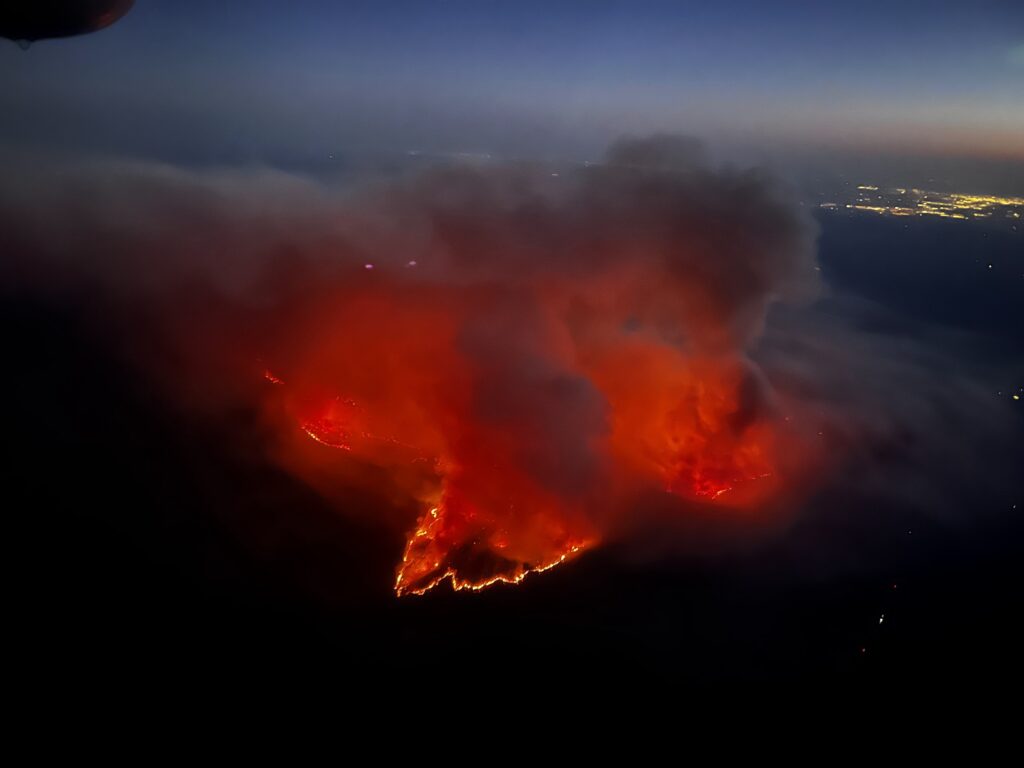
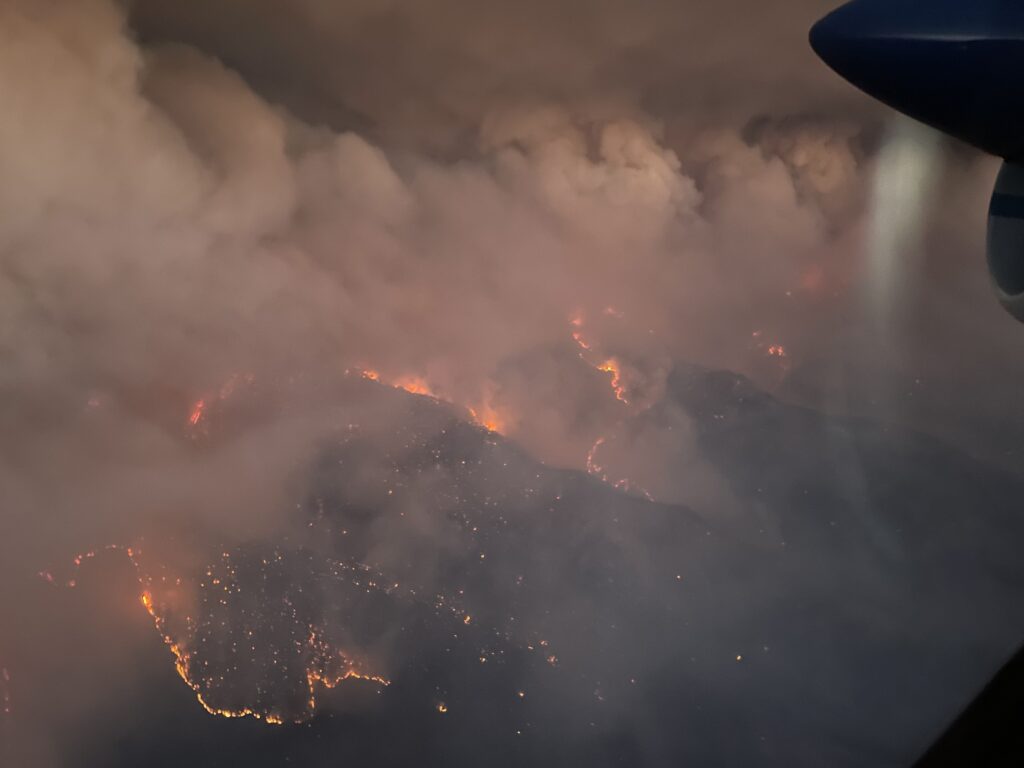
Top image: Mosquito Fire flames and smoke on hillside, seen from the NOAA Twin Otter during CalFiDE on 8 September 2022. Photo credit: LT Nick Pawlenko.

Recent Trends in Tropical Cyclone Fatalities in the United States

Satellite photo of Hurricane Gonzalo (a ball of swirling clouds) over the Atlantic near Puerto Rico; other larger cloud systems are seen in the upper part of the photo, eclipsed by the curvature of the Earth in the top right. Photo taken by GOES East satellite at 1445Z on October 14, 2014. Photo credit: NOAA.

New data from the past ten years reveal increased prominence of freshwater floods and indirect fatalities in hurricane deaths

Guest post by Dr. Michael Brennan, Director, National Hurricane Center; Daniel Brown, Warning Coordination Meteorologist, National Hurricane Center; and Leah Pope, Hydrologist, Northwest River Forecast Center

The National Hurricane Center’s mission to “save lives and mitigate property loss” is not just achieved by issuing effective watches, warnings, and forecasts of tropical cyclones. We also spend a large portion of the “offseason” educating the public, emergency managers, and our media partners about the risks that tropical cyclones (TCs), including hurricanes, pose to life and property in the United States. Those include natural hazards such as storm surge, wind, and rip currents, and also includes dangerous conditions in the aftermath of a landfalling tropical cyclone, which may lead to “indirect” fatalities. These are deaths which are not directly due to the forces of the storm, but which would not otherwise have occurred. NHC routinely compiles and assesses TC-related information through vehicles such as our Tropical Cyclone Reports (TCRs). Data from the most recent decade reveal that fatality trends may be changing.  

Note:  The fatality data presented here do not include any fatalities from Hurricane Maria in Puerto Rico, since there was no specific, definitive cause provided for those deaths.

Direct Fatalities

Aerial photo of a peninsula/barrier island that has been breached by a storm surge. Sand, buildings, and other structures have been washed away or damaged, including visible broken lines of sandbags, a damaged bridge, damaged trees, and obliterated buildings; only one house appears to still be standing.
Storm surge damage from Hurricane Ike, Bolivar Peninsula, Texas, 2008. Photo credit: NOAA.

Previous studies by Rappaport (2014) and Rappaport and Blanchard (2016) summarized direct and indirect fatality data from Atlantic basin tropical cyclones in the United States for the 50-year period 1963–2012. During that period, nearly 9 out of 10 tropical cyclone-related direct deaths in the United States were due to water. Storm surge was responsible for nearly half (49%) of the direct deaths, and over one-quarter (27%) were due to rainfall-induced freshwater flooding.  

In response, the National Weather Service (NWS) and NHC worked to improve outreach, education, and communication of storm surge and rainfall hazards. We introduced new real-time storm surge maps in 2014, and in 2017 introduced a storm surge watch/warning that highlights the risk of life-threatening storm surge inundation. 

New Data Suggest Changing Trends

Since 2012, the United States has experienced 21 hurricane landfalls, including 8 major hurricanes, and more than 20 tropical storm landfalls. Eighteen of these hurricane landfalls, including all of the major hurricanes, occurred during 2017–22 after a relatively quiet period. Given the significant number of tropical cyclone landfalls in recent years, and increased deployment of warnings around the storm surge hazard, NHC examined and compared fatality data from the most recent 10-year period (2013–22) to the earlier studies.

Hazard % of direct fatalities from this cause
(1963–2012)
% of direct fatalities from this cause
(2013–2022)
Storm Surge49%11%
Freshwater Flooding27%57%
Wind8%12%
Surf/Rip Currents6%15%
Offshore Marine Incidents6%3%
Tornadoes3%2%
Other1%1%
Note: Due to rounding, numbers may not add up to 100%.

During the most recent 10-year period in the United States, about 57% of direct tropical cyclone deaths were due to drowning from freshwater (rainfall) flooding. Surf and rip current fatalities have become an increasing threat, making up about 15% of direct fatalities in the past decade. These fatalities often occur one or two at a time from distant storms hundreds of miles offshore. Florida, North Carolina, and New Jersey experienced the highest number of TC-related surf and rip current fatalities. Storm surge and wind-related deaths account for 11% and 12% of the direct fatalities, respectively.  

Every hurricane is different, however. Hurricane Harvey in 2017 had the largest number of direct deaths—68, 65 of which were due to freshwater flooding in Texas—in the past decade. Hurricane Ian (2022) was the second deadliest with 66 direct fatalities, 41 of which were due to storm surge in Florida. More than 65% of those who died from direct causes were men, with about 60% of the victims over the age of 60.

Indirect Causes

Image of a boat stranded on land, leaning against a wind-destroyed structure and a power line, amid other debris, including destroyed buildings and cars. Three people stand next to the boat observing the damage.
Aftermath of Hurricane Ike in Galveston, Texas, 2008. Photo credit: NOAA.

The recent study revealed that over the past 10 years there has been nearly an equal number of indirect deaths as direct fatalities. Indirect fatalities are due to a wide range of causes, including traffic accidents (16%), preparation/cleanup accidents (15%), carbon monoxide poisoning (12%), lack of medical care (11%), power problem/electrocution (11%), post-storm heat deaths (9%), unknown causes (9%), cardiac-related deaths (7%), and evacuation-related deaths (5%). 

The largest number of indirect deaths in the past decade occurred in association with Hurricanes Ian (90), Irma (82), Michael (43), Harvey (35), and Laura (34). Most (75%) of the indirect deaths are associated with major hurricane landfalls, which leave communities very vulnerable and often with long-duration, widespread power outages. More than half (57%) of the victims were over the age of 60. Younger victims tended to die in vehicle accidents; for older victims, medical-related issues, heat, evacuation, and other accidents were more likely causes of death.

Improving Warnings and Public Understanding

The results of these most recent studies have led the NWS and NHC to increase messaging on the hazards and causes of both direct and indirect fatalities. We continue to highlight rainfall flooding and storm surge risk through the Weather Prediction Center’s Excessive Rainfall Outlook, Flood Warnings from local NWS offices, and increased emphasis on the Storm Surge Warning. These warnings are the loudest “bells” that the NWS can ring during life-threatening flooding. We encourage our media and emergency management partners to work with us to encourage timely public response and personal preparedness ahead of these threats. 

Additionally, with the increased percentage of rip current fatalities associated with high surf and swells from distant hurricanes, the NWS has created new infographics to explain this deadly beach hazard, and is working on graphics to better highlight the threat in real time.

During the highly impactful 2020 hurricane season in the United States, there were more fatalities associated with carbon monoxide poisoning from the improper use of generators than there were from storm surge. After that season, NHC and the NWS developed infographics and worked with media and emergency management partners to highlight that threat. While it is difficult to determine the effectiveness of that messaging, it is encouraging to know that there were no carbon monoxide related-fatalities in the aftermath of Hurricane Ian in 2022 in Florida, despite its devastating impacts and widespread power outages in that state.   

NHC relies on relationships with media, emergency management partners, and the entire weather enterprise to help reach the public before, during, and after tropical cyclone threats. These efforts undoubtedly increase awareness, encourage preparation, and save lives. We hope to continue to improve our messaging and understanding of the threats and causes of injuries and fatalities to better meet our collective mission.  

Visit the National Hurricane Center online.

Header photo: Hurricane Gonzalo in the Atlantic. Photo taken by GOES East satellite at 1445Z on October 14, 2014. Photo credit: NOAA.

This post was invited based on a presentation given by Dr. Brennan at the 50th Conference on Broadcast Meteorology, which took place in Phoenix, Arizona, June 21–23, 2023. The conference was organized by the American Meteorological Society Board on Broadcast Meteorology and chaired by Danielle Breezy and Vanessa Alonso.

“People in My Community Rely on Me.”

Broadcast meteorologist Mike Nelson wearing a suit, standing in front of a computer simulation of Colorado with a diagram of the jet stream and the caption labeled "Strong Winds Aloft Racing Over Colorado"

Lessons from Longtime Broadcast Meteorologists

In the third of three posts celebrating the 50th Conference on Broadcast Meteorology, we asked longtime broadcast meteorologists about what it means to do what they do, and their advice for others in the field.

What are some historic weather events you’ve covered, and what did you learn?

“It’s easy to joke with the news anchors and talk about a beautiful 75-degree day. But when severe or extreme weather approaches, the true essence of a broadcast meteorologist’s role is public safety. The first two weeks of 1999 was one of the harshest stretches of winter weather the Detroit area has ever seen, and I was out reporting live [when] people were struggling to get to work… [It was so cold] that roads salted the previous afternoon had an overnight refreeze … I cautioned people [that] if they were the first car at a stop light and it turned green, to pause a moment to make sure that nobody was skidding through the intersection before proceeding through. Later in the day, a viewer e-mailed to tell me that I had directly saved her life … that she was stopped at a light and, when it turned green, was about to hit the accelerator like normal, then remembered what I had said. She put her foot back on the brake. At that moment, a panel truck came barreling across the intersection from the left. Had she proceeded without pausing, she likely would have been broadsided and killed. 

No matter if it’s a severe winter storm, thunderstorm, tornado, hurricane, flash flood, or any other significant natural hazard, our job as broadcast meteorologists is to take the viewers by the hand and help them make informed decisions that could save their lives. Nobody [else] in broadcast media has this responsibility on a daily basis. And there is no greater compliment than when somebody says ‘you saved my life.’”

Paul Gross, AMS Fellow, CCM and CBM

“There have been many historic weather events from Hurricanes Andrew, Fran, and Floyd to numerous tornado outbreaks in Middle Tennessee. The one event that stands out the most is the Great Flood of 2010 that impacted Tennessee with record rainfall totals and historic flooding. Interstates became raging rivers; neighborhoods were submerged in water and even downtown Nashville was flooded with several feet of water coving streets. Over 30 people lost their lives.

From all these events I have learned how much people in my community rely on me for critical information to help them prepare, survive and recover. It’s so important for me to deliver that information in a calm but urgent tone.”

Lisa Spencer, Chief Meteorologist, News4, Nashville, Tennessee
Lisa Spencer and Paul Heggen at WSMV. Photo courtesy of Lisa Spencer

“The Barneveld F-5 Tornado in June 1984 was an early event that I covered. Nine people lost their lives in that terrible storm and it hit at 1 a.m. It had a major impact on me in terms of staying late into the night if necessary to issue warnings. In my St. Louis years, there were often times that I would stay after the late news to cover thunderstorm complexes and not get home until 5 a.m. In Denver, our thunderstorms tend to be in the afternoon and evening – but I have spent many nights here covering blizzards!

Most recently, we had a massive wildfire in December 2021 that destroyed nearly 6,000 buildings just south of Boulder, Colorado. The Marshall Fire was a huge firestorm caused in part by very warm and dry weather – related to climate change. I try to incorporate the climate change connection into my weather reports as often as possible.”

Mike Nelson, Denver7 Chief Meteorologist, KMGH, Denver, Colorado
Mike Nelson covering the Marshall Firestorm in late December 2021. Photo courtesy of Mike Nelson.

What does being a Certified Broadcast Meteorologist mean to you?

“I find great value in the CBM program. I served on the committee to develop the seal program. In addition, I also helped develop the first test and testing guide.

When I see that someone has earned the CBM seal, I know that they have gone through a rigorous test to demonstrate their expertise in the field. Additionally, I am confident in their communication skills knowing their work has been reviewed by a group of experienced peers. CBM seal holders have gone the extra mile to make sure they are equipped to deliver critical weather and science information to their communities.”

Lisa Spencer, Chief Meteorologist, News4, Nashville, Tennessee

“I am CBM number 50, so I have had the designation for a while. The CBM represents the highest level of certification that the AMS can provide to a broadcast meteorologist and it should be held with high esteem. It takes a lot of work to achieve and should merit respect from the TV stations, networks and – most important – the viewer. As CBMs, we have a unique opportunity and responsibility to educate our viewers about weather, science and climate change.”

Mike Nelson, Denver7 Chief Meteorologist, KMGH, Denver, Colorado

What are some lessons you’d like to share with other broadcasters?

“Be active in the community, visit schools, answer all your email, educate the public about climate change. Also, the years go by faster than you will imagine – be sure to plan for your financial future as this business is not getting easier and will never pay as well as it did during my career (sorry)!”

Mike Nelson, Denver7 Chief Meteorologist, KMGH, Denver, Colorado

“Be yourself, be humble, stay focused, set goals and have fun!”

Yolanda Amadeo, Chief Meteorologist, WALB News, Albany, Georgia
Left to right: Bryan Busby, Yolanda Amadeo, and Alan Sealls. Photo courtesy of Yolanda Amadeo.

“From my over-35-year career as a broadcast meteorologist, I have learned the one thing you can count on is change… change in management at all levels, change in responsibilities, and change in the technology and the way we present the weather. But with all those changes we have to remember what we are there for… to serve our communities with the most accurate, informative weather information especially in critical times. When someone recognizes you in public and acts like they know you personally… that’s a good thing. You have made a connection and are welcomed in their home, on the TV or whatever device they are using to watch you. I try to always be gracious.”

Lisa Spencer, Chief Meteorologist, News4, Nashville, Tennessee
Lisa Spencer at work at WSMV 4 (along with, in left photo, Snowbird, a mascot who helps announce snow day school closings in the station’s service area).

About 50Broadcast

The 50th Conference on Broadcast Meteorology took place in Phoenix, Arizona, June 21-23, 2023. It was organized by the American Meteorological Society Board on Broadcast Meteorology and chaired by Danielle Breezy and Vanessa Alonso.

Decades of Innovation in Weather Broadcasting

Mike Nelson, Terry Kelly, and Dr. Richard Daly in the Weather Central newsroom. Photo courtesy of Mike Nelson.

Celebrating the 50th Conference on Broadcast Meteorology

We’re back with the second of three posts highlighting memories from longtime broadcast meteorologists, as we celebrate last month’s 50th Conference on Broadcast Meteorology! Today’s post highlights how the field of broadcast meteorology has evolved over the decades since these meteorologists started out.

“If you told me in 1983 at the beginning of my career that, forty years later, I would hold a portable little computer in my hand that dwarfs the computing capacity of what was in the spacecraft that took astronauts to the moon, watch live radar on that little computer, and then send personal messages with those radar images and warnings to large groups people in seconds, I would have laughed at you. Everybody talks about model and radar improvements that have occurred during this time period, but the development of instantaneous communication of weather information is mind-blowing and has truly benefited the public.”

Paul Gross, AMS Fellow, CCM and CBM
(Left) Paul Gross and colleagues on a trip to Fenway Park during the 2012 AMS Conference on Broadcast Meteorology in Boston, Massachusetts. (Right) Paul Gross in 1984. Photos courtesy of Paul Gross.

“During my first internship at WMC in Memphis in the early 1980s, the station was still using a magnetic surface map during their weathercast. Of course, now we use augmented reality graphics. Forecasting in the 1980s when I started my career consisted of large printed surface maps and spaghetti charts; we would use colored pencils to make analysis. Now everything is available online and from multiple sources.

“When I first started attending AMS Broadcast Conferences in the early 1990s, Bryan Busby (KMBC-TV) and I had a running joke where we greeted each other as “the other Black guy,” because we were the only two African-Americans there. I am thrilled to see the growth in diversity in our field and our conferences over the decades, to where we can’t say that anymore!”

Alan Sealls, AMS Fellow, CBM, Past Seal Board Chair
Photo from the 33rd Conference on Broadcast Meteorology, in New Orleans in 2004. Pictured from left to right: David Tillman, Lisa Mozer, Bryan Busby, Gene Norman, Alan Sealls, and Yolanda Amadeo. Photo courtesy of Alan Sealls.

“I can remember having 5 p.m., 6 p.m., and 10 p.m. newscasts. I was responsible for one 3 ½-minute weathercast during each news show and maybe updating a phone line forecast. Now, I have a 3 p.m., 4 p.m., 5 p.m., 6 p.m., 6:30 p.m., and 10 p.m. newscasts with not only a generally 3-minute weathercast, but usually a first weather and teases. In addition, I am responsible for updating weather forecasts on a phone line, for radio, multiple social media platforms, the website and streaming service.”

Lisa Spencer, Chief Meteorologist, News4, Nashville, Tennessee

Photo courtesy of Lisa Spencer.

“I started in Seattle in 1971… the satellite images used on the air at KING-TV were single 4×5-inch B&W Polaroids taken at the local NWS office, a 10-minute drive downtown.

Stumping Bryan Gumbel and Jane Pauley with weather science on NBC’s TODAY in the ’80s was always fun, especially demonstrating the shape of rain drops by creating air bubbles in a 6-foot-tall clear plastic tube of Karo syrup (a sticky clean-up.)”

Joe Witte, Climate Outreach Specialist, Aquent, Pasadena, California

“I started my career at WKOW-TV in Madison, WI in 1976. … My first job was to erase the weather boards and help draw weather maps that would be used [by Terry Kelly, President of Weather Central, in his] weather reports. These maps were hand-drawn on lightweight cardboard and were then taped to the wall of the studio in a series of 5-6 maps. The cameraman (there were few women camera operators back then) would pan from left to right across the series of maps to help tell the story. If the masking tape let go, the map would fall to the floor – the viewers were certainly startled to see that! Making these maps took many hours and it was nearly impossible to change the map if the weather changed.

Paper weather maps. Photo courtesy of Mike Nelson.

In 1979, Terry Kelly teamed up with some computer scientists at The UW Space Science and Engineering Department to create the Apple II Weather System which became one of the first TV Weather Computer Systems. … My job in the late 1970s through the mid-1980s was to travel around the country to install the various generations of these computers and train the meteorologists in this new technology. I installed over 50 units during this time and had the honor of meeting and training many of the legends of our industry such as Al Roker, Don Kent, Gary England, Bruce Schwoegler, Bob Copeland, Harry Volkman, Dick Albert, George Winterling, and Valerie Collins. It was truly an amazing time as the computer systems were rapidly changing and the competition between computer companies was intense!”

Right image: Mike Nelson with the Apple II Weather System. Photo courtesy of Mike Nelson.

Mike Nelson, Denver7 Chief Meteorologist, KMGH, Denver, Colorado

(Clockwise from left) Gary England, Don Kent, Dick Albert, and George Winterling. Photos courtesy of Mike Nelson.

“[My] first TV job was with the old WGAN-TV in Portland, Maine, as the first meteorologist on staff… [It] entailed washing down the regional and national weather maps–floor-to-ceiling and made of linoleum, and covered with the tempera-marker info from the night before. Mop-and-bucket work was just part of the shift. Paper weather maps, magnetic suns and moons, and air-brushed clouds followed before actual digital graphics arrived.

As a broadcast meteorologist back then, one had to be proficient in more than forecasting. Changing out helixes in the fax machine, repairing the teletype (without sending 72 volts through your body), changing toner in the satellite receiver, and unending paper cuts were all part of your day.”

Dr. Lou McNally, Former President, AMS Boston Chapter

Dr. Lou McNally at WIVB in Buffalo, circa 1983, with magnetic baseman.
Photo courtesy of Dr. McNally.

Photo at top of post: Mike Nelson, Terry Kelly, and Dr. Richard Daly in the Weather Central newsroom. Photo courtesy of Mike Nelson.


About 50Broadcast

The 50th Conference on Broadcast Meteorology took place in Phoenix, Arizona, June 21-23, 2023. It was organized by the American Meteorological Society Board on Broadcast Meteorology and chaired by Danielle Breezy and Vanessa Alonso.

When Wildfires Know No Boundaries, Scientists Must Cross Disciplines

The U.S. Capitol building viewed from afar during the wildfire smoke event on June 7, 2023. Photo courtesy of Natasha Dacic.

Takeaways from the AMS Summer Policy Colloquium

Guest post by Natasha Dacic, PhD Candidate at the University of Michigan

The western part of the United States continually suffers from wildfires and smoke every year, but in early June, regions of the Midwest and eastern parts of the country experienced unhealthy air quality as smoke from Canadian wildfires was transported into these regions. Cities like Washington, D.C., experienced some of the worst air quality levels in recent years. The smoke that engulfed the capital was a stark reminder that events like wildfires have far-reaching consequences.

I began to wonder if policymakers would be more attuned to the urgency for climate action now that the Nation’s Capital was experiencing some of the consequences that could become more prevalent in the near future. Coincidentally, I was in D.C. that week for the AMS Summer Policy Colloquium, and I had the opportunity to hear policymakers and federal officials comment on the wildfire smoke and how it pertains to the science policy they work on. 

As a scientist passionate about the intersection of climate and policy, the Summer Policy Colloquium was an enlightening experience for me. It brought together federal officials and Congressional staffers from various disciplines to discuss their career journeys, responsibilities, and pressing environmental issues. Several science policy experts commented on air quality and the broader implications of wildfires, recognizing that these are not isolated incidents but rather a component of a larger system affected by climate change and human activities, and not limited to a single country or region. Wildfires, driven by extreme heat, droughts, and other climate-related factors, have become increasingly common and devastating worldwide. 

In response to questions addressing the poor air quality, speakers emphasized the need for collaborative efforts between scientists, policymakers, and communities to tackle these complex challenges. The co-production of knowledge emerged as a theme throughout these discussions, and it quickly became evident that policymakers rely on expert knowledge and active participation of interested parties from various sectors in order to craft effective policy. This is one important way scientists can get involved.

Natasha Dacic (black shirt) and peers discussing policy issues at the AMS 2023 Summer Policy Colloquium. Photo: AMS staff.

As I listened to these conversations, I couldn’t help but reflect on my own work and the importance of co-production of knowledge in addressing environmental issues. I worked with a group of faculty and students in the Department of Climate and Space Sciences and Engineering at the University of Michigan to develop a pilot course to provide hands-on experience engaging with local communities. Many geoscience academic departments do not mandate this type of coursework–yet I believe that as scientists, it is essential for us to engage not only in research but also in the application of our knowledge. The Summer Policy Colloquium served as a reminder that we have a responsibility to communicate our findings to policymakers, advocate for evidence-based decision-making, and work hand in hand with communities affected by these environmental challenges.

The colloquium also highlighted the importance of academia and scientists being more active in applying their knowledge to real-world problems. While research and publication are important, they must be accompanied by active engagement with policymakers and communities to ensure that scientific findings translate into meaningful action. By actively participating in the policy-making process, scientists can contribute their expertise and help shape policies that address all aspects of science and more importantly, climate change.

Photo at top: The U.S. Capitol building viewed from afar during the wildfire smoke event on June 7, 2023. Photo courtesy of Natasha Dacic.


About the AMS Summer Policy Colloquium

The AMS Summer Policy Colloquium provides an overview of policy basics and decision-making in the earth and atmospheric sciences, along with opportunities to meet and dialogue with federal officials, Congressional staffers, and other decision-makers. Aimed at early and mid-level federal managers, scientists, private-sector executives, university faculty, and selected graduate students and fellows, the Colloquium helps participants build skills and contacts, gauge interest in science policy and program leadership, and explore selected issues in depth. View the 2023 SPC agenda here [PDF].

Careers’ Worth of Broadcast Conference Memories

Celebrating the 50th Conference on Broadcast Meteorology

The 50th AMS Conference on Broadcast Meteorology took place last week, 21-23 June 2023, in Phoenix, Arizona–more than six decades after the first Broadcast conference in Hartford, Connecticut, in 1956. The conference has been a source of cutting-edge information on the art and science of broadcasting the weather, encounters with industry greats, and collaborations that last lifetimes. To help celebrate, we asked several longtime broadcast meteorologists to share their memories with us, plus advice and insights on how the field has changed. The following is the first of three posts featuring their responses.

What are some of your memorable moments from past sessions of the Conference on Broadcast Meteorology?

“My first conference was in Boston in 1981. I remember sitting way in the back and feeling kind of lost and insignificant among all the legends around me. All of a sudden a hand was extended to me and I turned to my right. There sat Harry Volkman! Harry introduced himself and asked my name, and we had a very nice conversation. I never forgot how kind he was to a ‘kid’ weather-caster – Harry was always one of my heroes and someone I still try to emulate.

Today, I still keep that experience in mind when I meet young up-and-coming meteorologists. I hope that I might help inspire them to have a successful career.”

Mike Nelson, Denver7 Chief Meteorologist, KMGH, Denver, Colorado
Left two photos: Harry Volkman; right photo: Mike Nelson at KMOX in the 1980s. Photos courtesy of Mike Nelson.

“I’ve attended nearly every conference since ~1979. I was chair of the broadcast board [for the 1985 conference in Honolulu, Hawai’i], and Mike Smith from Wichita was program chair. Initial thought was that TV news directors would never permit their meteorologists to travel to Hawai’i. Were we wrong! We had record attendance. We programmed the day to start and very early – 7 a.m. to 1 p.m. or so, given people were mostly on Eastern/Central end time. In the afternoon, everyone was on their own to enjoy the island.”

Todd Glickman, Senior Director, Corporate Relations at MIT
Peter Leavitt, President of WSI Corporation, John Coleman, founder of The Weather Channel, and Bruce Schwoegler, Chief Meteorologist of WBZ-TV Boston, at the 15th Conference on Broadcast Meteorology in Honolulu, HI. Photo courtesy of Todd Glickman.
Evelyn Mazur, Director of Meetings at AMS, Brad Field from Hartford, Bill Kamal from Miami, Fred Gadomski of Penn State, and Ken Spengler, Executive Director of AMS, at the 15th Conference on Broadcast Meteorology in Honolulu, HI. Photo courtesy of Todd Glickman.
Photos from the 15th Conference on Broadcast Meteorology in Honolulu, Hawai’i, 1985. Top: Peter Leavitt, President of WSI Corporation, John Coleman, founder of The Weather Channel, and Bruce Schwoegler, Chief Meteorologist of WBZ-TV Boston. Bottom: Evelyn Mazur, Director of Meetings at AMS, Brad Field from Hartford, Bill Kamal from Miami, Fred Gadomski of Penn State, and Ken Spengler, Executive Director of AMS. Photos courtesy of Todd Glickman.

“My first AMS Broadcaster’s conference, and first presentation, was 50 years ago… 1973 at historic Cape Cod. The legendary Don Kent with his Boston accent was most kind with his comments.”

Joe Witte, Climate Outreach Specialist, Aquent, Pasadena, California

What’s been valuable to you about these conferences?

“AMS Broadcast conferences have given me knowledge, professional exposure, and lifelong friendships with like-minded people.”

Alan Sealls, AMS Fellow, CBM, Past Seal Board Chair; Chief Meteorologist at NBC15, WPMI-TV, Mobile, Alabama

“The AMS Broadcast Conference helps me stay up-to-date on the latest in the industry from both the meteorology side and the broadcast side. It’s a great opportunity to connect with my peers in the field and provides an excellent opportunity to learn from each other and experts in various genres of meteorology and climate.As the conference organizer one year, I learned valuable leadership, planning, and organizational skills.”

Lisa Spencer, Chief Meteorologist, News4, Nashville

“I have been broadcasting the weather in Montgomery, Alabama, for 45 years on TV and radio. I attended my first AMS Broadcast Conference in 1984 in Clearwater, Florida. Phoenix [was] my 25th broadcast conference. 25 out of 50. These conferences are so important to me. The learning process never ends. Also, the conference experience has shown me America. And each year I look forward to catching up with my fraternity of friends in this incredible business.”

Rich Thomas, Chief Meteorologist, Bluewater Broadcasting, Montgomery, Alabama

“The Broadcasters Conferences have provided numerous long-lasting memories and friends.”

Joe Witte, Climate Outreach Specialist, Aquent, Pasadena, California

“I attended my first AMS Broadcast Conference in 1993 Charleston, South Carolina, on the hunt for my first job as a broadcast meteorologist. Within a few weeks landed in Johnson City, Tennessee. My advice to all: network, network, and network!

I’ve gained so much from each conference. Presentations by experts on case studies and what was learned. New technology and its impact within the broadcast industry on what we do daily!

What I cherish the most: long-lasting friendships among colleagues. Each conference is a reunion. In some way we’ve all impacted each other in boosting confidence and in being challenged to deliver daily the best information in helping viewers plan and be safe!”

Yolanda Amadeo, Chief Meteorologist, WALB News, Albany, Georgia

(Left to right) Dr. Marshall Shepherd, Yolanda Amadeo, Janice Huff, and Alan Sealls. Photo courtesy of Yolanda Amadeo.

About 50Broadcast

The 50th Conference on Broadcast Meteorology took place in Phoenix, Arizona, June 21-23, 2023. It was organized by the American Meteorological Society Board on Broadcast Meteorology and chaired by Danielle Breezy and Vanessa Alonso. If you registered for the meeting, you can view presentation recordings here.

Header photos (clockwise from top left): Evelyn Mazur, Director of Meetings at AMS, Brad Field from Hartford, Bill Kamal from Miami, Fred Gadomski of Penn State, and Ken Spengler, Executive Director of AMS (photo courtesy of Todd Glickman). Yolanda Amadeo and Jim Cantore (photo courtesy of Yolanda Amadeo). Mike Nelson and Terry Kelly, 1979 (photo courtesy of Mike Nelson).

A Week in Washington for a Student Scientist

Photo: Haven Cashwell in front of the U.S. Capitol Building

Guest post by Haven Cashwell, PhD Student and Graduate Research Assistant at Auburn University

From my small hometown of Marshallberg in eastern North Carolina, and even my current home as a researcher and PhD student at Auburn University, the chambers of Congress have always felt like a different world. I had never even visited Washington, D.C., before, so truly I did not know what the policy world looked like. The recent AMS Summer Policy Colloquium opened these doors to me and showed that the pathway between research and policy isn’t as distant as I once thought.

The integration of science and policy has always intrigued me—such as policy for coastal resiliency, since my hometown of Marshallberg, NC is being impacted by climatic changes—but I was not aware of how that process worked. As I finish my PhD, I’m also exploring possible career paths that I could take after graduating. One aspect of my current research involves assessing and communicating climate and health risk factors with frontline communities in the Carolinas, which has made connections with the policy process feel even more pressing.

My mentor for an internship this summer is Dr. Kathie Dello, North Carolina’s state climatologist, who previously attended the colloquium and encouraged me to participate as well. After a week at the Colloquium, I left with lots of new knowledge and a much greater appreciation of how the policymaking process works.

For instance, I learned about the concepts of science for policy and policy for science, and how to navigate the two. Given my background in science communication, the idea of translating scientific evidence and research results to be usable and actionable (science for policy) felt very familiar, but I gained a new understanding of how policy affects funding that goes to different agencies for scientific research (policy for science). 

The 2023 AMS Summer Policy Colloquium cohort walking to Capitol Hill

Together with several dozen fellow scientists, I heard from professionals working in the policy world. They represented careers ranging from those having to do with the federal budget process to congressional staffers working directly with members of congress on science initiatives. I had no idea the options were so broad and varied. And far from the common perception that policy has to be dull, these speakers had great passion for their own work and a clear enthusiasm for sharing that with my peers and me.

We put our knowledge into practice in a legislative exercise that was sprinkled throughout the week. Participants were separated into groups and assigned to play the role of a senator marking up certain legislation. The goal was to get an understanding of how politics, policy, and procedure interact in the legislative process by creating amendments to bills and working together to create a significant piece of legislation. Much enthusiasm was shared among the participants at the end of the week when “voting” for the legislation, as the hard work throughout the entire week was put into practice. 

I left the Colloquium not only with a much better understanding of how science and policy can connect, but also with a new cohort with whom I networked throughout the week. Whether our careers keep us in the sciences or shift toward the world of policy, I’m excited for our paths to cross in the future and see how our experiences from this week in Washington shape our own work.

I would recommend attending the Summer Policy Colloquium to any young scientist who is interested in the policy process. By being better informed about how science and policy intersect, I’m now able to consider how my own research could fit in, whether it’s sharing how results from my research could influence policy or how to communicate and collaborate with policymakers in general.  

The 2023 AMS Summer Policy Colloquium cohort

Whether my future takes me back to small towns facing climate risks, leading research universities, or even a career in the policy sector, I know that the Summer Policy Colloquium has given me the tools and knowledge to be a more well-rounded researcher capable of connecting with the world of policy.

About the AMS Summer Policy Colloquium

The AMS Summer Policy Colloquium provides an overview of policy basics and decision-making in the earth and atmospheric sciences, along with opportunities to meet and dialogue with federal officials, Congressional staffers, and other decision-makers. Aimed at early and mid-level federal managers, scientists, private-sector executives, university faculty, and selected graduate students and fellows, the Colloquium helps participants build skills and contacts, gauge interest in science policy and program leadership, and explore selected issues in depth.

In the Field: Understanding Canyon Fires

A Research Spotlight from the 14th Annual Fire and Forest Meteorology Symposium, 2–4 May, 2023

The California Canyon Fire controlled burn moves upslope. Image: San José State University

Wildfires in complex terrain like canyons are known to be particularly dangerous. Canyon fires often “blow up” or “erupt,” exploding suddenly with intense heat and spreading rapidly—and too often causing fatalities among firefighters. In the ninth session of the 14th Fire and Forest Meteorology Symposium on 4 May, Maritza Arreola Amaya presented initial results from the California Canyon Fire experiment, a controlled burn that was intensively documented to help better understand the behavior of canyon fires.

In this experiment, conducted in Central California’s Gabilan Range, a fire was ignited and monitored by a large team who placed sensors around the fire site and monitored the blaze from the ground, from the air with balloons, drones and helicopters; from meteorological towers; and with vehicle-mounted instruments including Radar, LiDAR (“light detection and ranging,” which uses laser light pulses to build three-dimensional images), and SoDAR (“sonic detection and ranging,” which uses sound waves to measure wind speed at different heights). The fire was lit near the bottom of the canyon in steep terrain of chaparral and sparse oak trees. It moved quickly up the canyon, the first time a fire of this size has naturally done so while under intense monitoring.

Flame attachment and v-shaped spread of the California Canyon Fire controlled burn. Image: CAL FIRE

The fire spread up the walls of the canyon in a “v” shape. It clearly exhibited eruptive behavior including flame attachment—in which hot gases rising from the fire downslope heat the unburned fuel further up the slope, leading to an intense, quickly spreading fire front. A highly turbulent, rotating plume of smoke emerged, and air was rapidly entrained into the fire, where temperatures reached nearly 800 degrees Centigrade (1472 Fahrenheit).

While some instruments were destroyed by the flames, researchers at San Jose State, the NSF-UICRC Wildfire Interdisciplinary Research Center, and more are eagerly analyzing the data collected to help improve understanding and modeling of dangerous canyon fires.

“Working on this one-of-a-kind canyon project was one of the coolest things I’ve ever done. Seeing the experiment that took so long to organize and set up finally come to life was amazing. It involved countless hours setting up complicated instrumentation so that ultimately the behavior of a wildfire on canyon terrain could be analyzed for the first time naturally moving up a large canyon. I know that this successful experiment will play a big part in future investigations involving wildfires on complex terrain and the danger they bring to firefighters.”

Maritza Arreola Amaya

Meeting registrants can view the recording of this session here. Recordings become publicly available three months after the meeting.

For a real-life example of a fatal canyon fire and the weather conditions that worsened it, see our post about the Yarnell Hill Fire.


About 14Fire

Meteorology and wildfires are intimately interconnected—and wildfires are becoming increasingly severe and frequent in many parts of the United States. From local residents and firefighters on the ground to planners and insurers, to people hundreds of miles away breathing wind-driven smoke, society relies on our ever-improving ability to understand and forecast the atmospheric conditions relating to wildfire. The American Meteorological Society’s 14th Fire and Forest Meteorology Symposium brought together researchers and fire managers to discuss the latest science.

The U.S. Budget in 5 Minutes: A Primer for Scientists

The U.S. Capitol Building on a banknote

By Katie Pflaumer, AMS Marketing Communications Manager, and Paul Higgins, AMS Associate Executive Director for Policy

The federal budget is the cornerstone for much of the scientific funding in the United States. Directly or indirectly, federal funding impacts the work of almost all AMS members and those in related fields. But do you know how it works? Even if you’re not attending the AMS Summer Policy Colloquium this coming week, you can still get a sense of budget basics with this quick guide from the AMS Policy Program.

Science, Policy, and the Budget

Scientific insights can influence policy and help improve it—this is one major way that science matters to society, whether we’re determining how to manage reservoirs or what we are going to do about climate change. But however you slice it, the decisions made by policymakers and politicians also affect how we practice science. Perhaps the most prominent way is through funding for research—determining what gets funded, and how much.

For our purposes, the two key components of the U.S. federal budget are revenue (taxes and fees taken in by the federal government) and spending.

  • Mandatory spending is required by existing public law or statute. Nearly two-thirds of government spending comes from existing laws—such as those that fund Social Security and Medicare along with payments on the nation’s debt.
  • Discretionary spending has to be funded each year or at other regular intervals through an act of Congress. Many government agencies (including scientific ones) rely on discretionary spending.

The annual budget process is how the U.S. Government determines its discretionary spending. The budget is a highly political document. It is one of the places where big philosophical questions play out about who should pay for what, the size and role of the federal government, and different approaches to debts, deficits, and surpluses. Increased spending in any one area requires more taxes, taking funding away from something else, or deficit spending (and adding on debt). Decreased spending requires difficult decisions about what programs or benefits get cut.

The Budget Process: Resolutions, Reconciliation, and Appropriations, Oh My!

The U.S. government runs on a fiscal year that starts on October 1 of the previous calendar year (so FY 2024 begins October 1, 2023). Our current budget framework is outlined in the Congressional Budget Act of 1974.

The U.S. House and Senate together hold the purse strings for the federal budget, but the executive branch has the first go at things. Here’s how the process works in a “typical” year.

The president develops a detailed budget request. This request is managed by the Office of Management and Budget and developed in concert with federal agencies, and is due to Congress on the first Monday in February prior to the start of the next fiscal year.

The Senate and the House of Representatives develop a joint congressional budget resolution that specifies overall tax and spending levels, providing a top-line budget number. The budget resolution can also include “reconciliation”—legislation that can address revenue or spending issues affecting the overall budget, including in ways that significantly change existing laws.

The House and Senate vote on the budget resolution. Note: Both the budget resolution and any reconciliation measures need only a simple majority vote in the Senate and aren’t subject to the vote-stalling technique known as a filibuster (which requires 60 votes to break). Reconciliation measures are sometimes used to pass controversial legislation that wouldn’t receive 60 Senate votes—including the Bush-era tax cuts, fixes for the Affordable Care Act, and the American Rescue Plan of 2021.

The budget resolution, once passed in both the House and the Senate, establishes overall discretionary funding for the House and Senate Committees on Appropriations; this is known as a 302(a) allocation. The main function of the Appropriations committees is to provide discretionary funding to government operations including federal agencies.

The House and Senate Appropriations Committees each parcel the funding out to twelve Appropriations subcommittees (each of which receives a 302(b) allocation). The House and Senate Appropriations subcommittees develop more detailed spending plans based on the allocations received.

Each of the subcommittees can pass a separate funding bill, but they are often passed as a single “omnibus” bill covering some or all of the 12 appropriations. The House and Senate must come to agreement on and pass identical versions of these funding bills. Unlike the original budget resolution, this requires a 60-vote majority in the Senate to avoid a filibuster. Any provisions in the bill(s) that would exceed the allotted budget are also subject to filibuster.

The House and Senate must pass the budget bill(s) and get them signed by the president (or override the president’s veto) by the time the fiscal year begins.


Subcommittees Funding Science

Several appropriations subcommittees deal with science-related agencies (for example, the defense budget funds a lot of science research). However, the three subcommittees that have the greatest science focus are likely Commerce, Justice, Science, and Related Agencies (budgets for NOAA, NASA, the NSF, and the National Institute of Standards and Technology, among others), Energy and Water Development (which includes the Department of Energy and its Office of Science), and Interior, Environment, and Related Agencies (which includes both USGS and EPA).

That’s the idea—in practice, it’s often a lot more complicated. For example, when FY 2014 started without an agreed-upon budget, the government shut down for 16 days. In mid-October, Congress passed a “continuing resolution” to allow the government to reopen using the previous year’s budget levels. The final omnibus budget wasn’t signed until January 2014, more than three months into the fiscal year.

As you can see, the politics of funding the U.S. government makes for a major challenge, requiring a lot of work, diplomacy, and give-and-take—far more than we can get into in a blog post. If you’d like to explore the topic further, a more thorough rundown on the budget is available in this AMS webinar recording: “The U.S. Federal Budget and Policy Process.” And don’t forget to follow the AMS Policy Program for more ways you can learn about—or get involved in—the policy process!

Helpful Resources


About the AMS Policy Program

The Policy Program promotes understanding and use of science and services relating to weather, water, and climate. Our goal is to help the nation, and the world, avoid risks and realize opportunities associated with the Earth system.

The Yarnell Hill Fire: Microbursts, Density Currents, and 19 Lost Lives

A Research Spotlight from the 14th Annual Fire and Forest Meteorology Symposium, 2–4 May, 2023

The Yarnell Hill Fire the day it began, June 28, 2013. Image credit: USDA

Arizona’s Yarnell Hill Fire ranks among the U.S. wildfires with the most firefighter fatalities. On June 30, 2013, members of the interagency Granite Mountain Hotshots were entrapped in a canyon by fire due to rapidly shifting wind conditions. Many attempted to take shelter but were overwhelmed. Nineteen firefighters died and the fire, fed by the strong winds, blazed out of control. The tragedy and damage devastated the community of Yarnell, Arizona.

A joint team at Embry-Riddle Aeronautical University and North Carolina A&T State University has been using simulations to help understand exactly what happened. A recent presentation by Michael Kaplan et al. May 2, 2023 in the first session of the 14th Fire and Forest Meteorology Symposium broke down the events at the meso-γ (2–20 km) scale leading up to the tragedy, the latest in a series of analyses starting at large scales and moving towards ever-finer resolution. They found that a density current (a flow of denser air that intrudes underneath less-dense air) and its secondary circulations drove the winds that forced fire into the canyon where the Granite Mountain Hotshots were located.

Firefighters near the Yarnell Hill Fire on June 28, 2013. Image credit: USDA

A squall line that developed over the Colorado Plateau on the morning of the 30th moved southwestward rapidly, strengthening over the Black Hills and Bradshaw Mountains on the way, until it died out further to the southwest over the Weaver Mountains near Yarnell. From this dying squall line developed a density current that produced unusual air circulation patterns in combination with the area’s complex terrain. Simulations by the Weather Research and Forecasting (WRF) model suggest that the fading density current created conditions in the Weaver Mountains that were highly conducive to downward air motion. This resulted in a series of strong localized downdrafts similar to microbursts near the fire site.

Earlier in the day, the fire had been moving towards the northeast, driven by southwesterly winds. Within 1–2 hours in the late afternoon, the winds shifted and intensified rapidly, becoming northwesterly, then northeasterly, blowing at 45 miles per hour and driving the fire (now blazing at 2,000 degrees Fahrenheit), in a southwesterly direction. Kaplan called these shifts “dramatic, remarkable changes.”

Wind direction and speed (blue arrows) and direction of Yarnell Hill fire motion (red lines) at 3:30–4:30 p.m. and 4:30–5:30 p.m. local time on June 30, 2013. Image: State of Arizona Serious Accident Investigation Team

In the end, “The entrapment of the Granite Mountain Hotshots was likely the result of very, very intense redirected winds” that continued over a longer than expected period, Kaplan said. “Even after they got the initial surge of northeasterly flow [due to the density current] the Hotshots had to deal with more surges of high momentum” from the series of microbursts. He noted that despite the Granite Mountain Hotshots’ high level of experience, “This is something firefighters may not have really been [expecting] to occur.”

Vertical cross-section of potential temperature and isotachs from 3:15 to 3:35 p.m. Arizona time on June 30, 2013, showing new cells forming behind the density current near Yarnell, associated with microburst downdrafts. Image courtesy of Michael Kaplan

Kaplan’s team will continue to work on their simulations of conditions associated with the Yarnell Hill Fire, with the hope of providing information that can help prevent similar entrapments, and deaths, in the future.

Meeting registrants can view the recording of this session here. Recordings become publicly available three months after the meeting.

__________________________________________________________________________________

About 14Fire
Meteorology and wildfires are intimately interconnected—and wildfires are becoming increasingly severe and frequent in many parts of the United States. From local residents and firefighters on the ground to planners and insurers, to people hundreds of miles away breathing wind-driven smoke, society relies on our ever-improving ability to understand and forecast the atmospheric conditions relating to wildfire. The American Meteorological Society’s 14th Fire and Forest Meteorology Symposium brought together researchers and fire managers to discuss the latest science.