With hurricanes moving more slowly and climate models projecting increasing rain rates, scientists have been grappling with how to effectively convey the resulting danger of extreme rains from these more intense, slow-moving storms.
 Flooding rainfall already is the most deadly hazard from tropical cyclones (TCs), which include hurricanes and tropical storms. Yet the widely recognized tool for conveying potential tropical cyclone destruction is the Saffir-Simpson Scale, which is based only on peak wind impacts. It categorizes hurricanes from 1, with winds causing minimal damage, to 5 and catastrophic wind damage. But it is unreliable for rain.
Recent research by Christopher Bosma, with the University of Wisconsin in Madison, and colleagues published in the Bulletin of the American Meteorological Society introduces a new tool that focuses exclusively on the deadly hazard of extreme rainfall in tropical cyclones. “Messaging the deadly water-related threat in hurricanes was a problem brought to light with Hurricanes Harvey and Florence,” says J. Marshall Shepherd (University of Georgia), one of the coauthors. “Our paper is offering a new approach to this critical topic using sound science methods.”
“One goal of this paper,” Bosma explains, “is to give various stakeholders—from meteorologists to emergency planners to the media—an easy-to-understand, but statistically meaningful way of talking about the frequency and magnitude of extreme rainfall events.”
That way is with their extreme rainfall multiplier (ERM), which frames the magnitude of rare extreme event rainfalls as multiples of baseline “heavy” rainstorms. Scientifically, ERM is the ratio of a specific location’s storm rainfall and the maximum amount of rain that has fallen most often at the location in two consecutive-year periods from 1981 through 2010—the baseline rain events that are relatively frequent at that location. A recurring baseline heavy rain amount is defined by the median (rather than the mean) annual maximum rainfall during the 30-year period and is used to weed out outlier events.
The authors are proposing the scale to
1. Accurately characterize the TC rainfall hazard;
2. Identify “locally extreme” events because local impacts increase with positive deviations from the local rainfall climatology;
3. Succinctly describe TC rainfall hazards at a range of time scales up to the lifetime of the storm system;
4. Be easy to understand and rooted in experiential processing to effectively communicate the hazard to the public.
Experiential processing is a term meaning rooted in experience, and ERM aims to relate its values for an extreme rainfall event to someone’s direct experience, or media reports and images, of heavy rainfall at their location. Doing this has the benefit of enabling them to connect, or “anchor” in cognitive psychology terms, the sheer magnitude of an extreme rain event to the area’s typical heavy rain events, highlighting how much worse it is.

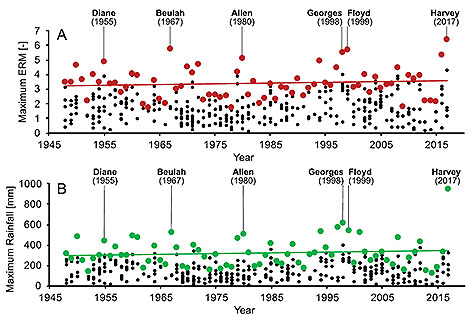
The researchers analyzed 385 hurricanes and tropical storms that either struck or passed within 500 km of land from 1948 through 2012 and, through hindcasting, determined an average ERM of 2.0. Nineteen of the storms had ERMs greater than 4.0. And disastrous rain-making hurricanes in the record had ERMs directly calculated as benchmark storms. These include the most extreme event, Hurricane Harvey with an ERM of 6.4, Hurricane Florence as well as 1999’s Hurricane Floyd, which swamped the East Coast from North Carolina to New England, (ERMs: 5.7), and Hurricane Diane (ERM: 4.9), which destroyed large swaths of the Northeast United States with widespread flooding rains in 1955, ushering “in a building boom of flood control dams throughout New England,” says, coauthor Daniel Wright, Bosma’s advisor at UW-Madison.
Wright says that a major challenge in developing ERM was maintaining scientific accuracy while widening its use to non-meteorologists.
I’ve been reading and writing research papers for more than 10 years that were written for science and engineering audiences. This work was a little different because, while we wanted the science to be airtight, we needed to aim for a broader audience and needed to “keep it simple.”
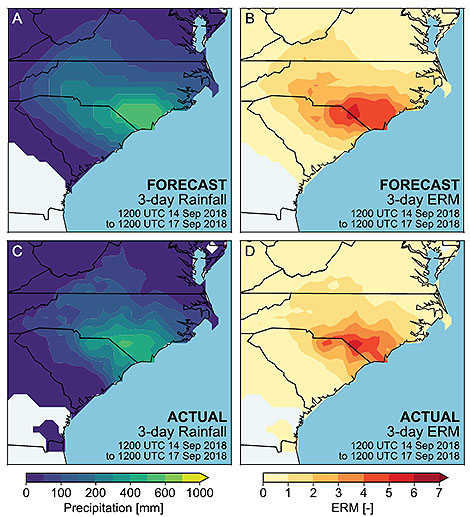
In practice, these historical values of ERM would be used to convey the severity of the rainfall hazard from a landfalling storm. For example the authors successfully hindcast ERM values in the Carolinas for Hurricane Florence, which inundated southeastern portions of North Carolina and northeastern South Carolina as it crawled ashore in 2018. With an active tropical storm or hurricane, the forecast value of ERM could be compared with historical hurricanes that have hit the expected landfall location.

Verification of NWS forecasts for the 3-day rainfall after landfall of Hurricane Florence (and ERM forecasts derived from these QPF estimates), issued at 1200 UTC 14 Sep 2018. Actual rainfall and 3-day ERM are based on poststorm CPC-Unified data.
In theory, the sound science is such that the ERM framework could be applied to other rain-producing storms.
“We think there is potential both for characterizing the spatial properties of all kinds of extreme rainstorms…and then also for examining how these properties are changing over time,” Wright says.
The researchers caution, however, that there are things that must be resolved before ERM can be used operationally as a communication tool. For example, ERM will need to be scaled to be compatible with NWS gridded rainfall products and generalized precipitation forecasts. Forecast lead times and event durations also will need to be determined. And graphical displays and wording still need to be worked out to communicate ERM most effectively.
Nevertheless, the team argues:
…our Hurricane Florence ERM hindcast shows that the method can accurately characterize the rainfall hazard of a significant TC several days ahead in a way that can be readily communicated to, and interpreted by, the public.

Above, Daniel Wright, of the University of Wisconsin-Madison