Intuitive Metric for Deadly Tropical Cyclone Rains

With hurricanes moving more slowly and climate models projecting increasing rain rates, scientists have been grappling with how to effectively convey the resulting danger of extreme rains from these more intense, slow-moving storms.

C_BosmaFlooding rainfall already is the most deadly hazard from tropical cyclones (TCs), which include hurricanes and tropical storms. Yet the widely recognized tool for conveying potential tropical cyclone destruction is the Saffir-Simpson Scale, which is based only on peak wind impacts. It categorizes hurricanes from 1, with winds causing minimal damage, to 5 and catastrophic wind damage. But it is unreliable for rain.

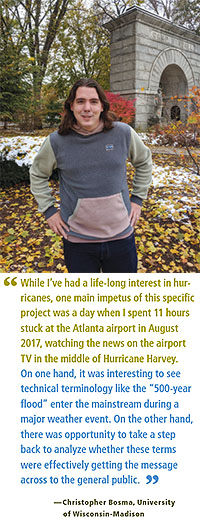
Recent research by Christopher Bosma, with the University of Wisconsin in Madison, and colleagues published in the Bulletin of the American Meteorological Society introduces a new tool that focuses exclusively on the deadly hazard of extreme rainfall in tropical cyclones. “Messaging the deadly water-related threat in hurricanes was a problem brought to light with Hurricanes Harvey and Florence,” says J. Marshall Shepherd (University of Georgia), one of the coauthors. “Our paper is offering a new approach to this critical topic using sound science methods.”

“One goal of this paper,” Bosma explains, “is to give various stakeholders—from meteorologists to emergency planners to the media—an easy-to-understand, but statistically meaningful way of talking about the frequency and magnitude of extreme rainfall events.”

That way is with their extreme rainfall multiplier (ERM), which frames the magnitude of rare extreme event rainfalls as multiples of baseline “heavy” rainstorms. Scientifically, ERM is the ratio of a specific location’s storm rainfall and the maximum amount of rain that has fallen most often at the location in two consecutive-year periods from 1981 through 2010—the baseline rain events that are relatively frequent at that location. A recurring baseline heavy rain amount is defined by the median (rather than the mean) annual maximum rainfall during the 30-year period and is used to weed out outlier events.

The authors are proposing the scale to

1. Accurately characterize the TC rainfall hazard;

2. Identify “locally extreme” events because local impacts increase with positive deviations from the local rainfall climatology;

3. Succinctly describe TC rainfall hazards at a range of time scales up to the lifetime of the storm system;

4. Be easy to understand and rooted in experiential processing to effectively communicate the hazard to the public.

Experiential processing is a term meaning rooted in experience, and ERM aims to relate its values for an extreme rainfall event to someone’s direct experience, or media reports and images, of heavy rainfall at their location. Doing this has the benefit of enabling them to connect, or “anchor” in cognitive psychology terms, the sheer magnitude of an extreme rain event to the area’s typical heavy rain events, highlighting how much worse it is.

Highest annual maximum ERMs (1948–2017) are indicated with colored markers and colored lines representing linear regression fit. A Mann–Kendall test for monotonic trends in annual maxima values did not reveal significant changes over time for either ERM or rainfall.


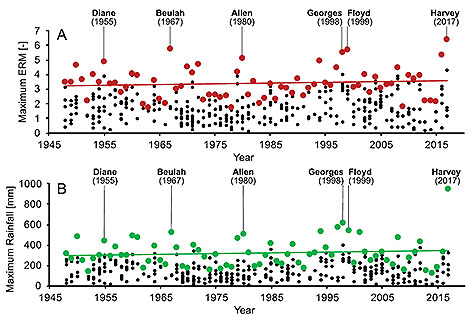
The researchers analyzed 385 hurricanes and tropical storms that either struck or passed within 500 km of land from 1948 through 2012 and, through hindcasting, determined an average ERM of 2.0. Nineteen of the storms had ERMs greater than 4.0. And disastrous rain-making hurricanes in the record had ERMs directly calculated as benchmark storms. These include the most extreme event, Hurricane Harvey with an ERM of 6.4, Hurricane Florence as well as 1999’s Hurricane Floyd, which swamped the East Coast from North Carolina to New England, (ERMs: 5.7), and Hurricane Diane (ERM: 4.9), which destroyed large swaths of the Northeast United States with widespread flooding rains in 1955, ushering “in a building boom of flood control dams throughout New England,” says, coauthor Daniel Wright, Bosma’s advisor at UW-Madison.

Wright says that a major challenge in developing ERM was maintaining scientific accuracy while widening its use to non-meteorologists.

I’ve been reading and writing research papers for more than 10 years that were written for science and engineering audiences. This work was a little different because, while we wanted the science to be airtight, we needed to aim for a broader audience and needed to “keep it simple.”

In practice, these historical values of ERM would be used to convey the severity of the rainfall hazard from a landfalling storm. For example the authors successfully hindcast ERM values  in the Carolinas for Hurricane Florence, which inundated southeastern portions of North Carolina and northeastern South Carolina as it crawled ashore in 2018. With an active tropical storm or hurricane, the forecast value of ERM could be compared with historical hurricanes that have hit the expected landfall location.

Verification of the National Weather Service forecasts for the 3-day rainfall after landfall of Hurricane Florence (and ERM forecasts derived from these QPF estimates), issued at 1200 UTC 14 Sep 2018. Actual rainfall and 3-day ERM are based on poststorm CPC-Unified data.

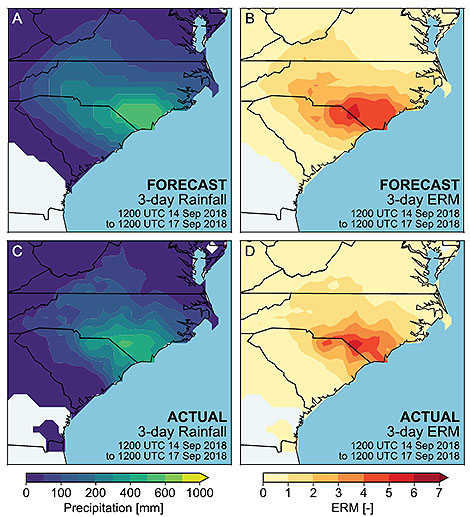
Verification of NWS forecasts for the 3-day rainfall after landfall of Hurricane Florence (and ERM forecasts derived from these QPF estimates), issued at 1200 UTC 14 Sep 2018. Actual rainfall and 3-day ERM are based on poststorm CPC-Unified data.


In theory, the sound science is such that the ERM framework could be applied to other rain-producing storms.

“We think there is potential both for characterizing the spatial properties of all kinds of extreme rainstorms…and then also for examining how these properties are changing over time,” Wright says.

The researchers caution, however, that there are things that must be resolved before ERM can be used operationally as a communication tool. For example, ERM will need to be scaled to be compatible with NWS gridded rainfall products and generalized precipitation forecasts.  Forecast lead times and event durations also will need to be determined. And graphical displays and wording still need to be worked out to communicate ERM most effectively.

Nevertheless, the team argues:

…our Hurricane Florence ERM hindcast shows that the method can accurately characterize the rainfall hazard of a significant TC several days ahead in a way that can be readily communicated to, and interpreted by, the public.

D_Wright

Above, Daniel Wright, of the University of Wisconsin-Madison

Twitter Abuzz during Extreme Precipitation Hangout

Last week’s Google hangout on extreme precipitation touched on a number of different topics related to preparing for extreme weather events and the larger goal of building a Weather-Ready Nation. It’s noteworthy that one of the key themes that recurred throughout the hangout was “communication,” as a healthy discussion was evident on Twitter during the event. We’ve captured some of the highlights here, just below the full video of the hangout.


A Year Ago in Oso: Wrong Place at the Wrong Time

At 10:36 a.m. on 22 March 2014, near Oso, Washington, the earth began to move.  At first the lower section of slope rising from the North Fork Stillaguamish River slipped. Then the rise above that collapsed, ultimately sliding so fast that nothing could stand in its way. An eyewitness near the river saw water tossed aside and turn black. A 30 m high wall of turbulent earth roared across and along the valley. About 8 million cubic meters of dirt and rock buried the village of Steelhead Haven and killed 43 people. The slide ultimately dammed the river as it raced at 60 km/h along a 1 km wide, 1 km long swath. USGS_MR_Oso_Aerial_clipped_adjusted

The Oso landslide (aftermath photo above, Mark Reid/USGS) was a scientific mystery. There was no obvious geological trigger, like an earthquake. And the slope itself, while prone to slides, was not precariously steep. Meteorologically, it was a rain-free day in a week of no precipitation. However, two new studies—one of them forthcoming soon in the Journal of Hydrometeorology—show why Steelhead Haven was in the wrong place at the wrong time, both geologically and meteorologically.
An overview paper this January in Earth and Planetary Science Letters showed how the Oso landslide underwent two stages of motion. The lower slope slipped slowly for about 50 seconds until the more radical collapse from above led to a high mobility liquid state called a “debris avalanche.” As the landslide spread across the river the debris picked up more moisture. The flow of dirt and rock spread the damage far beyond the initial slip of earth. The gushing mud and rock actually splashed against the opposite slope across the river and spread back upslope on top of itself.
Previous landslides in the Oso area had never attained that extremely mobile second stage. The slope of the 180 m high rise above the river is less than 20 degrees, and scientists have found highly mobile landslides usually start with greater than 20 degree slope—typically more than 30 degrees. What made this one different?
The paper’s authors, Iverson et al. say one reason was the porous geology of local sediments and silt. This porosity may have increased suddenly as the base of the slope started to slip. Then as ground slid the pores contract, raising water pressure and increasing liquefaction that greases the skids for faster movement and more contraction. Furthermore, as rock and dirt overran the river, the slide picked up another 50,000 cubic meters of water and scoured the river bed for more debris.
But if a critical sensitivity to initial geological conditions existed why did the land give way on a sunny day like 22 March 2014 instead of during an earlier, rainier part of the season?
The analysis by Brian Henn et al. in Journal of Hydrometeorology shows that the precipitation in the three weeks before the landslide was unexceptional (such periods are expected every two years or so) if compared to the soaking that the area can get during the rainy season. But the rain was exceptional (an 88-year expected return period) when compared to similar March periods of the past, and that is a bad time to get wet.
Since March is late for the rainy season, this meant additional water charged deep soils that were already wet. Heavy rains earlier in the year encountered soils that contained less moisture. The late rains came on top of an already wet season as well as four wet years before that.

OsoFigure

As a result, six days before the landslide soil moisture for the water year peaked and was wetter than would be expected every 40 years at that date. The soil moisture had surged beyond median levels in just a few weeks. [See figure above from Henn et al. 2015]
In other words, Oso was primed for a landslide, even on a dry day, partly because some of the rain had fallen late in the season—poor meteorological timing for the village of Steelhead Haven.

Atmospheric Rivers Go Mainstream

This week NOAA announced installation of four new special observatories in California dedicated to improving the understanding–and forecasting–of atmospheric rivers, the massive (but narrow) flows of tropical moisture aloft in the warm conveyor belt of air ahead of cold fronts.

Atmospheric river during 2010 Snowmaggedon storm. NOAA image.

The timing of the announcement could not have been better. Ocean-fed storms with the distinctive filaments of tropospheric moisture brought heavy rains to California and Oregon this past week. Lake levels in northern California surged by as much as 34 feet; rush hour in major cities like San Francisco were bedeviled with flooded streets and bridges blocked by overturned vehicles due to the high winds carrying blinding sheets of rain.
The timing was not just good from a weather point of view but also from the standpoint of public understanding. The announcement culminated the fast-track rise of “atmospheric river” from an obscure technical term to popular understanding. In anticipation of the weekend deluge (and the lesser encore Wednesday), media outlets from Oregon to Minnesota to Australia picked up the vibe and were talking about atmospheric rivers–and not just by the more time-honored and familiar regional name, “Pineapple Express.”
It was only 20 years ago the term “atmospheric river” was introduced in a scientific paper by Reginald Newell and colleagues; then atmospheric rivers got a brief spate of publicity during the late 1990s and early part of this century with airborne field projects over the Pacific Ocean, such as CALJET and PACJET. Attention ramped up again during 2010’s infamous Snowmaggedon on the East Coast.
So it goes with atmospheric sciences, where the prospect of applications can drive quick adoption of useful concepts: useful not just in forecasting but also in climatology. For example, at the upcoming AMS Annual Meeting, Tianyu Jiang of Georgia Tech will look at different resolutions of general circulation models to see how well they depict these detailed structures (as little as 25 miles wide) and linkages with East Asian Cold outbreaks in a Tuesday poster session (9:45 a.m., Exhibit Hall 3). In a Monday poster (2:30 p.m., Exhibit Hall 3) Nyssa Perryman of Desert Research Institute will explore how downscaling from a global climate model to an embedded regional climate model can affect the simulation of atmospheric rivers.
The importance of this relatively new concept is such that the AMS Education Program devoted several sections to atmospheric rivers and how they transport water vapor from the tropics in its newest edition of the AMS Weather Studies textbook. Released in August 2012 by the AMS Education Program, the book is currently being used by thousands of college students nationwide as an introduction to meteorology. A QR code was embedded in the text to provide readers with access to the most current forecast information and video loops available on the subject.
For more on atmospheric rivers, check out Ralph and Dettinger’s article in the June 2012 BAMS on the relative importance of atmospheric rivers in U.S. precipitation. Marty Ralph discusses the article in this AMS YouTube Channel video: