Weathercasters in Multiple Exposures

A recent blog post by Bob Henson, author of the new AMS book, Weather on the Air, serves as a good summary of the growing news coverage of broadcast meteorologists’ take on global warming. Much of this coverage stems from a recent survey of weathercasters released by George Mason University, in which, as Henson notes:

…the most incendiary finding was that 26% of the 500-plus weathercasters surveyed agreed with the claim that “global warming is a scam,” a meme supported by Senator James Inhofe and San Diego weathercaster John Coleman. On the other hand, only about 15% of TV news directors agreed with the “scam” claim in another recent survey by Maibach and colleagues. And Maibach himself stresses the glass-half-full finding that most weathercasters are interested in climate change and want to learn more.

Henson cites The New York Times, National Public Radio, ABC’s Nightline, and Comedy Central’s The Colbert Report as some of those that have examined the issue recently. The most recent “exposé” was a 10-minute segment entitled “Weather Wars,” on Australian “Dateline”; it features a number of AMS members.

Mercury Rising, Snow Disappearing

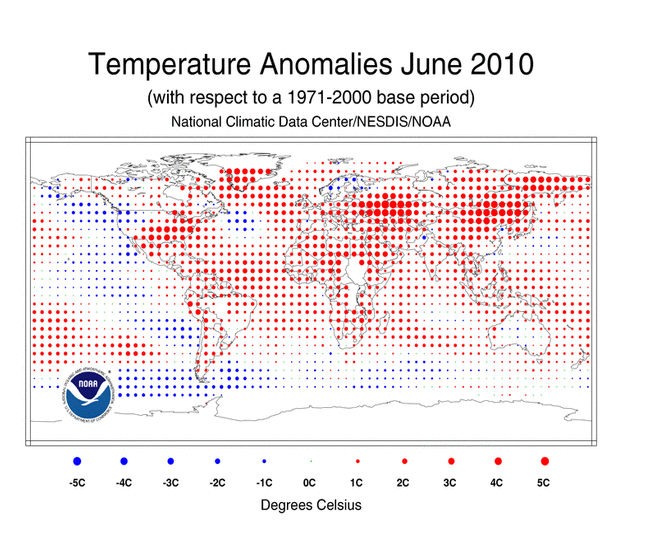
This past June continued a recent spate of unprecedented heat around the world, as NOAA’s National Climatic Data Center (NCDC) announced it was the warmest June on record (the NCDC’s data extends back to 1880), making it the fourth consecutive month of record heat.  The combined global land and ocean temperature for June was 16.2°C (61.1°F), placing it 0.68°C (1.22°F) higher than the twentieth-century average. Remarkably, it was the 304th consecutive month of global temperatures above the twentieth-century average. The last month that global temperatures were below that average was February of 1985.
March, April, and May of 2010 were also the warmest of their respective months on record, and the period of January-June is also the warmest ever recorded.
With the warmth came a striking decrease in snow, as NOAA announced that North American snow cover at the end of April was at its lowest point for that time of the year since satellite record keeping began in 1967, at 2.2 million square kilometers below average. This was just four months after the snowiest December on record, as well as significantly higher-than-n0rmal snow cover in January and February, demonstrating the profound ramifications of the warm temperatures that followed.

Seeing red: An NCDC map of June temperature anomalies

New AMS Book Gets Behind the Camera

I was seven years old when I first came under the spell of weather, both on television and outside. It was a muggy spring night in Oklahoma, and severe thunderstorms were approaching, as they so often do that time of year. As I sat watching one of the particularly mindless situation comedies peculiar to the 1960s, the show was interrupted by a serious young woman talking about tornadoes.
How does she know what the weather’s doing? I wondered. The way Lola Hall described terrifying storms with such calmness and authority carried a touch of magic for me. From that night onward, I was hooked on meteorology, and the way television and weather interacted.

–Robert Henson, preface to Weather on the Air: A History of Broadcast Meteorology
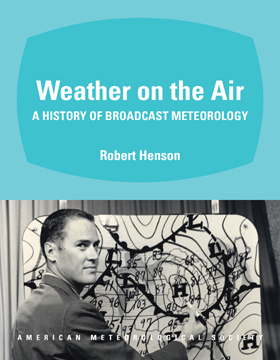
Many a weather enthusiast first became fascinated with the weather by watching their local television meteorologist on the nightly news. Through the years, the TV weather report has a created a rich history that uniquely reflects the evolution of both science and show business. Now, just in time for the 38th Conference on Broadcast Meteorology, AMS Books has released Weather on the Air: A History of Broadcast Meteorology, by UCAR’s Robert Henson. It’s the most comprehensive book on the subject in print.
Henson’s narrative starts at the earliest days of TV, with the predictions of Muncie, Indiana’s Jim Fidler and–soon thereafter–the animated character Wooly Lamb on WNBT in New York City. The story continues through the comedians, “weather girls,” and other entertainers who often presented the weather reports in the ’50s and ’60s, to the eye-catching graphics, technological advancements, and the rise of 24/7 TV weather in more recent times. On the way, Henson explores key developments in the history of broadcast meteorology, including the effort to professionalize weathercasting, the advancement of women and people of color in the field,  the complex interrelationships between government and private forecasters,  the evolution of severe weather warnings, and the effects of climate change science and the Internet on current broadcasts.
Ultimately, the story is not just a history of meteorology on TV, but, as Bob Ryan writes in the forward, it’s “a story of the history of meteorology itself. A story of the advance in science and the application of the sciences we love. It is a story of the advances in technology and broadcast technology, the advances in how we communicate.”
You can find more information and order the book here.

Hoping for XLVIII°F?

The Super Bowl is, of course, more than just a game. In fact, some might argue that the game is secondary to all of the social activities that go on during Super Bowl week.  (And then there are the commercials, but let’s not go there…) There’s no doubt that many view the Super Bowl as an event where they can see and be seen, so the NFL’s decision on Tuesday to play Super Bowl XLVIII outdoors in New Jersey is sure to upset some of those who prefer partying to pigskins.
This will be the first Super Bowl to be played outdoors in a cold-weather city, and the NFL waived its weather rules to allow New York/New Jersey to apply for hosting the game. Previously, the league only allowed the Super Bowl to be played in a location where the external temperature normally exceeds 50°F during the time of the game or where the stadium has a closed roof. With New York’s Giants and Jets having built a $1.6-billion stadium in New Jersey that opens this year, the league felt the region had a selling point that would outshine any weather issues, and after four rounds of secret balloting, NFL owners agreed, awarding New York/New Jersey the 2014 event over Tampa and Miami, two cities that have hosted the game a total of 14 times.

The New Meadowlands Stadium in New Jersey, home of Super Bowl XLVIII

The coldest Super Bowl occurred in 1972, when the temperature was 39°F  at the kickoff of Super Bowl VI in New Orleans’s Tulane Stadium. (A complete list of Super Bowl temperatures can be found here.) While the exact date of Super Bowl XLVIII has not yet been determined, it appears this could be the first time the game’s number is greater than the temperature. AccuWeather Meteorologist Bernie Rayno notes that the normal weather for the area during the game includes temperatures in the 30s with 10-20-mph winds; interestingly, there is a better chance of rain than snow: Using a target date of February 2 and records from nearby Newark,  only 4% of days over the last 44 years had snowfall on that day (the greatest amount being 3 inches in 1985), while 14% percent of the days had rainfall. As Rayno points out, though, “you’re playing averages. Only 20 percent of the years recorded a high temperature within 2 degrees of the average high of 41 degrees. Climate is a product of extremes.”
And as New York City Mayor Michael Bloomberg said, “People talk about the weather, but, you know, this is football, not beach volleyball.”
But try telling that to someone who paid north of $1,000 for a ticket.

The Icelandic Eruption that Devastated Europe

In the wake of the recent eruption of the Eyjafjallajökull volcano in Iceland and the inconvenience it caused air travelers, this might be a good time to remember another Icelandic volcano and the chain of events it set off, including widespread famine, thousands of deaths, and maybe even the overthrow of a European power.
In June 1783, the Laki volcano in Iceland began an eruption that would continue for eight months, launching huge amounts of poisonous gas into the atmosphere. In Iceland, this had disastrous effects: vast amounts of cropland were destroyed and remained useless for many years, and approximately 80% of the country’s livestock died, setting off a famine that combined with the polluted air to kill approximately 10,000 people–at least one-fifth of Iceland’s population–over two years. This period is known in the country as “The Mist Hardships” because of the hazy mix of hydrogen fluoride and sulfur dioxide that settled over the land.
That haze inexorably made its way to other parts of the Northern Hemisphere. The famed British naturalist Gilbert White noted in his Naturalist’s Journal that, “The peculiar haze or smoky fog that prevailed in this island and even beyond its limits was a most extraordinary appearance, unlike anything known within the memory of man.” Killing more than 20,000 British citizens, the toxic haze is considered to be the worst natural disaster in modern Britain’s history. But it didn’t stop there. As recounted in the book, A Cultural History of Climate, by Wolfgang Behringer,

The emissions caused sulphurous odours, eye irritation, breathing difficulties and headaches as far away as central Europe. In large parts of Europe and the Ottoman empire, there were reports of thick “dry fog” and darkening or unusual colouring of the sun. Members of the Societas Meteorologica Palatina reported that, in the summer of 1783, the dark sky meant that people were able to look at the sun with the naked eye. . . . Acid rain damaged the environment throughout Scandinavia. Vegetation directly suffered even in the Netherlands, where with some delay cold and drought led to harvest failures, outbreaks of fever and diarrhoea, and increased mortality.

The eruption resulted in two years of unusually cold winters in Europe, which in turn led to widespread crop damage and a deadly famine. (Even the United States felt the effects: Benjamin Franklin noted that the winter of 1784 was the coldest in memory.) Indeed, much of Europe in the 1780s was plagued by unusual and extreme weather–and subsequent hardships brought on by this weather–that has been attributed to Laki. In his book, Behringer notes that,

Grain prices rose threefold in the decade beginning in 1784. The cumulative periods of cold during these years led to heavy snowfall and deep frost, widespread failures of vine and bread cereal harvests, flooding and livestock epidemics–precisely the combination of disasters that hits traditional agrarian societies hardest. The severe winter of 1783-4 saw exceptionally heavy snowfall, and there was serious flooding when the thaw came in late February. In the Rhine-Main area, the highwater mark at that time has in many places never been exceeded; it caused devastation in the fields or meadows and outbreaks of livestock disease due to contamination of the land. Many bridges collapsed, and roads and paths became impassable. The winter of 1784-5 was also exceptionally long and cold. In Berne snow lay on the ground for 154 days. . .

Some historians even trace the French Revolution back to the volcano, as the difficult conditions created by its eruption (e.g., long, cold winters, crop failures, food shortages) bred widespread disillusionment among the country’s peasantry.
Storms Add to Southern Problems

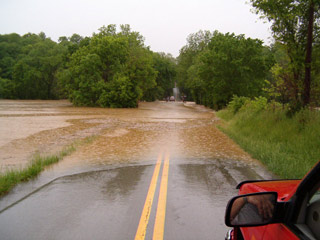
In a region already dealing with the potentially devastating effects of the offshore oil drilling disaster, the southern United States has been dealt more blows by recent severe weather. Storms over the weekend brought rain, thunderstorms, tornadoes, and severe flooding to much of the South, killing more than 30 people.

Flooding in Barren County, KY. (Photo by Brian Landers courtesy of NOAA/NWS)

The storms closed down major highways and forced many to evacuate their flooded homes. Tennessee and Kentucky were particularly hard hit over the weekend, with parts of Tennessee receiving well more than a foot of rain (this site documents some of the numbers; NWS rainfall maps can be found here and here); Nashville, TN, (13.53 inches) and Bowling Green, KY, (9.67 inches) were among the cities that set records for two-day rainfall (record-keeping goes back to the late 1800s).
Last week, a series of more than 50 tornadoes struck nine southern states, killing at least 12 people and causing severe damage to dozens of homes. The most powerful twister tore through Yazoo and Holmes counties in Mississippi and was classified by the NWS as an EF4, with maximum winds of 170 miles per hour. That tornado was also record-setting: It was the widest tornado to ever pass through Mississippi, measuring 1.75 miles at its widest point, as well as the fourth-longest to ever hit the state, traveling 149.25 miles on a continuous path. The Jackson, Mississippi NWS forecast office details this tornado and a number of others in an online report on the tornado outbreak.
The more recent of the two storm systems, the one that deluged Tennessee and Kentucky with flooding rain, had at least a tiny silver lining. While it at first whipped southerly winds across the oil spill in the Gulf, pushing the slick quickly toward the Louisiana coast, those winds shifted behind the storm’s cold front, blowing offshore and curtailing the advance of the oil toward Mississippi, Alabama, and Florida. A blog post by AMS member Jeff Masters, who is also director of meteorology for the Weather Underground Web site, details the massive flooding and discusses the future movement of the Gulf Coast oil slick.

In Asia, the Dust Never Sleeps

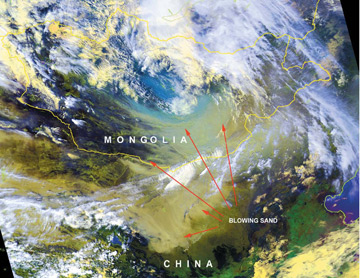
Springtime sandstorms are common in China, but the spate of widespread blowing dust and sand and yellow skies in March (with five dust storms in 12 days) has many Asians worried that conditions are worsening.
The storms originate when an atmospheric low pressure feature referred to as “the Mongolian Cyclone” kicks up winds that sweep through Mongolia and across the Gobi desert, creating clouds of sand, dust, and dirt that inundate much of China. The Mongolian cyclone has been particularly intense this spring, with recent storms affecting about one-fifth of China’s 1.3 billion people, according to the state-run Xinhua News Service. And the clouds don’t stay within China’s borders; studies have shown that they can travel as far as North America, and the Korean peninsula has been hit particularly hard by this storms this year. The Korean Meteorological Administration (KMA) posted a rare yellow dust warning recently, and soon thereafter it recorded the greatest amount of the dust since it began taking measurements in 2005: 2,684 micrograms per cubic meter in Daegu (a warning is issued when the concentration exceeds 800 micrograms per cubic meter).

NOAA satellite image of a 2001 dust storm over eastern Asia

A recent BAMS article by Chun et al. chronicles centuries of dustfall observations in Korea and points out that the storms seem to have increased in frequency in recent years. The dust problem has intensified across much of eastern Asia as desertification in China spreads. Agriculture plays a big part, as overgrazing, expansion of farmlands, and destructive irrigation practices exacerbate already dry lands. Urban sprawl, deforestation, and just plain old dry weather also contribute. Adding to the problem are the increasing amounts of industrial pollutants that mix with the sand, dust, and soot in the clouds. The health implications can be severe and can affect people without preexisting conditions.
The Chinese government has attempted to address desertification by planting vegetation in former farmland. While the recent storms suggest that the effectiveness of these initiatives has been mixed, Chinese meteorologists point out that cold weather can explain the recent spate of dust, and that not all sandstorms should be blamed on desertification, and China’s National Satellite Meteorological Center says that the country now has about six fewer sandstorms per year than it did in the years 1971-2000.

The Bold Ideas of Verner Suomi

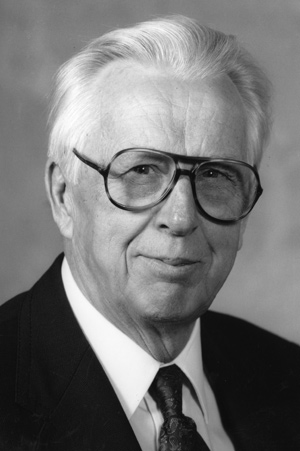
Known as “the father of satellite meteorology,” Verner Suomi was a man of unique vision, with an influence on the field of meteorology that extended far beyond satellite research. One of his lasting legacies is the University of Wisconsin–Madison’s Space Science and Engineering Center (SSEC), which he cofounded with Robert Parent in 1965, and now the SSEC’s library has established a Web site devoted to the life and accomplishments of Suomi.

Verner Suomi

The site includes articles published about Suomi, obituaries and memorials written following his death in 1995, audio of an interview with Suomi conducted for the AMS and UCAR, and video of a discussion of Suomi’s life by some of his closest colleagues that was filmed during the 50th Anniversary of Meteorological Satellites in November 2009.
The panel discussion reveals Suomi as a man equally dedicated to–and skilled at–teaching and researching. CIRA’s Tom Vonder Haar recalled that Suomi’s graduate classes were

more like idea shops, where he would tell us a month before that we were going to do this, then he’d go on a trip and get some new ideas and come in and it would be a totally different agenda. We were working on projects like measuring the energy from the sun with a balloon launch from an aircraft carrier in the Atlantic . . . putting an air horn on a balloon to get the temperature profile with acoustic propagation information. Vern had a lot of ideas. . . I would say he was a dedicated teacher, and I think another example of that was his interest in the students and faculty in other departments here at UW; he worked a lot with electrical engineering–not just the faculty, but with the students–he worked with the physics group, the astronomy group, and soils. . . He was a very collegiate–maybe an eclectic–person. He didn’t have boundaries, he saw no boundaries in education and things of that kind.

On the research side, the University of Wisconsin’s Larry Sromovsky remembered Suomi’s unique method of persuasion while developing a net flux radiometer for NASA’s Pioneer Venus probe mission in 1978.

. . . One of the more remarkable things that he did was when we had a review, we had the sensor design pretty much set to go and there was this final design review that would allow us to go forward and actually build the flight instruments. And the NASA team came to Space Science and they looked at all our results and at one point in the discussion they expressed a great deal of skepticism about the strength of what looked like this delicate little sensor . . . surviving this 200-G deceleration. And Suomi–he was great for bold strokes, I must say, and simple bold statements. And he grabbed the sensor head and stood up and flung it against the wall as hard as he could and the sensor was picked up off the floor and it looked perfectly fine. And he said, “Now do you think it will survive?”

Location, Location

Opening a successful business is all about location, they say. And so it is with wind energy.
Though the United Kingdom, with 250 wind farms, has vigorously embraced wind generation of electricity, a new study paints a discouraging picture of the overall productivity because of siting problems.
The study, released by the energy regulator Ofgem, found that at least 20 wind farms in the U.K. are operating at less than 20% of their capacity, with some even dipping below 10%. This is well below a typical  farm, which generates around 30% of its maximum potential energy. According to the study, the least productive farm (Blyth Harbour in Northumberland) operates at just 7.9% of its maximum capacity; the Chelker reservoir in North Yorkshire isn’t much better, at only 8.7% of capacity.
Critics claim that government subsidies are leading developers to choose less-than-ideal locations (with at least 14 m.p.h. average wind), leading to the disappointing productivity.
“Too many developments are underperforming,” says Michael Jefferson, a professor at London Metropolitan Business School and environmental consultant. “The subsidies make it viable for developers to put turbines on sites they would not touch if the money was not available.”
British electricity consumers help subsidize the country’s renewable energy policy through the “Renewables Obligation” plan, which requires the country’s energy companies to establish renewable sources. The UK energy plan calls for 20% of all its electricity to come from renewable sources by 2020 (that figure was downgraded to 10-15% by the country’s energy minister); currently, the country gets about 4% of its energy from such sources.
Meanwhile a new article by Willett Kempton and colleagues in the Proceedings of the National Academy of Sciences affirms the message that location, determined by meteorological and climatological analysis, is the key to producing energy effectively from wind power. However, the authors radically rethink the typical meteorological considerations for wind farm locations:

Whereas today’s developers prospect for the windiest single site, we would advocate a broader analysis—to optimize grid power output by coordinated meteorological and load analysis of an entire region.

The authors (from the University of Delaware and SUNY-Stony Brook) used wind data from 11 meteorological stations, representing 2,500 km of the U.S. Eastern Seaboard, to show that a network of  turbines could be configured to overcome the typical intermittency that bedevils wind generated electricity.
The trick to making steady electrical power at high output is meteorological: use wide spacing of turbines to take advantage of the typical synoptic circulation of extratropical systems moving up the coast and then connect with high capacity transmission lines. The net result smooths out operations even during very low wind situations.  The authors suggest that further meteorological pattern analysis could refine the siting of turbines beyond the even spacing explored in the article
The implications for design also include rethinking the scale on which power generation is governed and coordinated, however, requiring a new Independent Service Operator to manage offshore generation and transmissions.
Alas, for the United Kingdom, the article is a bit more sanguine about the possibilities for such synoptic wind farm optimization:

[T]he lack of benefit seen by aggregating stations in the United Kingdom may be due in part to the roughly north–south orientation of the island, thus experiencing
their east–west passage of frontal systems nearly simultaneously.

A Job Well Done

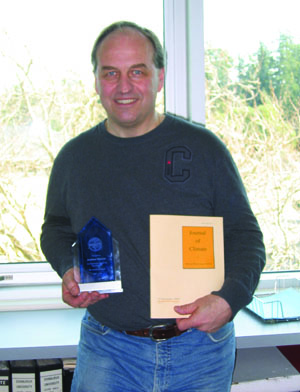
The AMS recently presented outgoing Journal of Climate Chief Editor Andrew Weaver with a plaque to thank him for his volunteer service to the Society. This is the beginning of a new tradition to honor every chief editor when they step down from their position, and it is appropriate that Weaver is the first to be recognized in this way, as during his term (2005-2009) the Journal of Climate grew significantly and earned consistently high ratings for its impact in the field of climatology. 
“It just so happens that our recognition of chief editors ending their tenure begins with one of the most successful of all the CE’s,” notes AMS Director of Publications Ken Heideman. “Andrew built on the foundation that others established before him and took it to a new level.”
As Heideman describes it, Weaver’s predecessors as Journal of Climate chief editor–NOAA’s Alan Hecht (1988), the University of Oklahoma’s Peter Lamb (1989-1995), and Colorado State University’s David Randall (1996-2004)–helped to establish the fledgling journal as a leader in climate research. By the time Randall handed the reins to Weaver, it was, according to Heideman, a “hot journal.  And then Andrew helped make it one of the hottest journals.”
During Weaver’s tenure, the Journal of Climate page count increased by almost 25%–from 5,400 to 7,000. More importantly, its ISI impact factor reached #1 in the category of meteorology and atmospheric sciences and was never lower than #4. The Journal of Climate has the most submissions and the most published papers of any AMS journal, as well as the most editors and editorial assistants. Weaver’s work sets a high standard for other chief editors.
“It’s amazing how much time Andrew put into the job,” says Heideman. “He routinely handled 100 papers a year by himself, and sometimes more. That was far above what we at AMS expected.”
For his part, Weaver found his time working with AMS “incredibly rewarding” and was especially pleased that he was able to keep up with what was happening in the field of climatology during a such a fertile period. His philosophy for the journal was simple and effective: do a good job in the editorial process, and the authors will come back.
“I’m most proud that the journal’s growth happened in the most tumultuous time in terms of climate politics, and we had no issues with that whatsoever,” he remembers. “Everything we did was just about the peer-reviewed science.”
As an organization led by its members, AMS relies on the volunteer spirit of people like Weaver not only to edit its journals but also to run nearly 100 boards, committees, and commissions.