New Western Storms Scale to Describe Intensity, Potential Impacts of Atmospheric Rivers

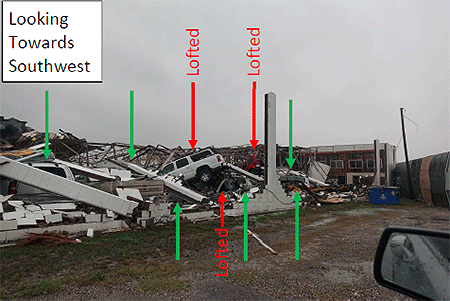
Hurricanes are classified by the Saffir-Simpson Scale and tornadoes by the Enhanced Fujita Scale, and now atmospheric rivers—those long, transient corridors of water vapor that fuel flooding rain events each winter in the West, especially California—will also be scaled to enhance awareness and bolster prediction.
The new AR scale ranks their intensity and potential impacts from 1 to 5 using the categories “weak,” “moderate,” “strong,” “extreme,” and “exceptional,” based on the amount of water vapor they carry and their duration. It is intended to describe the strength of ARs as beneficial to hazardous, aiding water management and flood response.
AR-Scale
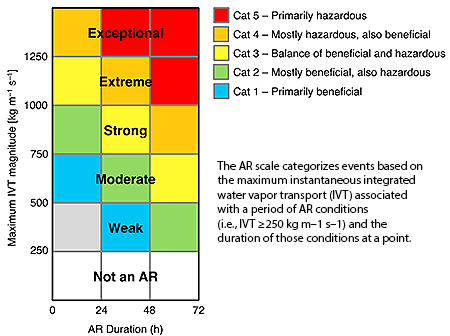
“The scale recognizes that weak ARs are often mostly beneficial because they can enhance water supply and snow pack, while stronger ARs can become mostly hazardous, for example if they strike an area with conditions that enhance vulnerability, such as [where there are] burn scars, or already wet conditions,” says Marty Ralph and co-authors in a paper appearing in the February 2019 issue of BAMS and posted online as an early release today. “Extended durations can enhance impacts,” he says.
Ralph is director of the Center for Western Water and Weather Extremes (CW3E) at Scripps Institution of Oceanography and a leading authority on atmospheric rivers, which were officially defined by the AMS in 2017. The new scale was created in collaboration with NWS meteorologists Jonathan Rutz and Chris Smallcomb, and several other experts. It marks two decades of intensive field research that involved establishing a network of dozens and dozens of automated weather stations to observe ARs in real time and flying research planes through them as they crashed ashore and up and over the mountainous terrain of California, Oregon, and Washington.
Atmospheric rivers are the source of most of the West Coast’s heaviest rains and floods—roughly 80 percent of levee breaches in California’s Central Valley are associated with landfalling ARs. Research shows that a combination of intense water vapor transport for a long duration over a given area causes the biggest impact. But ARs also are primary contributors to the region’s water supply.
The newly created scale is designed to capture this combination, accounting for both the amount of available water and the duration it is available. It focuses on a period of 24-48 hours as its standard measurement. When an AR lasts in an area fewer than 24 hours it is demoted by one category, and if it persists more than 48 hours, it is promoted by a category. Unlike the operational hurricane scale, which has been criticized for inadequately representing the increased impacts of slower-moving, lower-end hurricanes, duration is a fundamental factor in the AR scale. It also aims to convey the benefits of ARs, not just the hazards.
“It can serve as a focal point for discussion between water managers, emergency response personnel and the research community as these key water supply and flood inducing storms continue to evolve in a changing climate,” says co-author Michael Anderson of the California Department of Water Resources.
The scale ranks ARs in five categories:

  • AR Cat 1 (Weak):  Primarily beneficial. For example, a February 23, 2017, AR hit California, lasted 24 hours at the coast, and produced modest rainfall.
  • AR Cat 2 (Moderate): Mostly beneficial, but also somewhat hazardous. An AR on November 19-20, 2016, hit Northern California, lasted 42 hours at the coast, and produced several inches of rain that helped replenish low reservoirs after a drought.
  • AR Cat 3 (Strong): Balance of beneficial and hazardous. An AR on October 14-15, 2016, lasted 36 hours at the coast, produced 5-10 inches of rain that helped refill reservoirs after a drought, but also caused some rivers to rise to just below flood stage.
  • AR Cat 4 (Extreme): Mostly hazardous, but also beneficial. For example, an AR on January, 8-9, 2017, that persisted for 36 hours produced up to 14 inches of rain in the Sierra Nevada and caused at least a dozen rivers to reach flood stage.
  • AR Cat 5 (Exceptional): Primarily hazardous. For example, a December 29, 1996, to January 2, 1997, AR lasted over 100 hours at the Central California coast. The associated heavy precipitation and runoff caused more than $1 billion in damages.

When AR storms are predicted for the West Coast, the scale rankings will be updated and communicated on the CW3E website and its Twitter handle.
“The launch of the AR Scale marks a significant step in the development of the concept and its application,” Ralph commented in an e-mail to the AMS, “and caused me to reflect back a bit on where it came from. All the people and organizations who’ve contributed. The scientific debate around the subject. The creation of a formal definition for the Glossary of Meteorology. The creation of a 100-station mesonet to monitor them in California. The AR Recon effort underway in a partnership between Scripps and NCEP [now NCEI], and in collaboration with the Navy, NCAR, and ECMWF, as well as others.  A number of papers are already in the works using the scale, and we are hopeful that it will prove useful for the public and for officials who must deal with storms in a large area where scales for hurricanes, tornadoes and nor’easters are not very applicable.”

Eight Decades: Mapping New England Catastrophe

Eighty years ago today (September 21st), the Great New England Hurricane of 1938 ripped across New York’s Long Island and slammed into the Northeast, killing more than 600 people and clawing its way across New England and the record books. Every hurricane to strike the region since is compared to this behemoth, and none has come close to its devastating intensity.

U.S. Weather Bureau surface weather map for 7:30 a.m. ET Wednesday, September 21, 1938.

 
Ferocious winds gusting beyond category 5 intensity and an enormous storm surge that wiped out coastal Long Island and flooded into Rhode Island and Connecticut were its hallmarks. Copious rains also brought by the hurricane fell on soils swamped by heavy rain just days before the storm, leading to widespread flooding and thousands of landslides. Eight decades. And its imprint is still being realized.
Recently, new precipitation data on the storm and a precursor heavy rain event—now understood to be ubiquitous before New England hurricanes—were found. This precipitation map (right) newly appears in the 2nd edition of Taken by Storm 1938: a comprehensive social and meteorological history of the Great New England Hurricane, by Lourdes B. Avilés, professor of meteorology at Plymouth State University.
Precipitation observed during the Great New England Hurricane and its predecessor rain event. (U.S. Geological Survey)
Precipitation observed during the Great New England Hurricane and its predecessor rain event.
(U.S. Geological Survey)

 
The map was created by a grad student Avilés was advising—Lauren Carter—who painstakingly digitized thousands of observations from more than 700 daily weather stations Avilés had unearthed, spanning the 6-day event. This unique updated rainfall map is just one of many new and interesting finds detailed in the new edition of her book, which is now available in the AMS Bookstore. The book’s website houses supplemental information, including more color rainfall maps, detailed reports, and photos.

How Hurricane Florence Could Turn Weird and Deadly

Hurricane Florence is forecast to slow to a crawl as it nears landfall in the next 24 hours. As a result, some unusual and unimaginable things could happen. People in the Carolinas need to take this hurricane seriously. Even veterans of past landfalls there may be in for a surprise.
For starters, slow-moving hurricanes often deliver flood disasters. Think last year’s Hurricane Harvey with its 50- to 60-inch rains. The National Weather Service is predicting widespread rainfall in parts of the Carolinas of 10-20 inches. And some areas could be inundated with 30-50 inches as rainbands spiral ashore and hit spots repeatedly, as they did for days in Texas during Harvey.

NWS prediction of rainfall from Hurricane Florence over the next week.

 
Then there’s the storm surge. It may be unprecedented. Sure the Carolinas have endured the likes of Hurricanes Hugo in 1989, Fran in 1996, and Hazel in 1954. All brought storm surges topping 15 feet. But all were also moving quickly. A slowing hurricane like Florence could pile up a lot of water.
If it stalls offshore, says storm surge expert Dr. Hal Needham in a Wednesday blog post, “this will serve to dramatically increase the storm surge magnitude and geographic extent of coastal flooding.”
Already the National Hurricane Center expects some portions of the North Carolina coast to realize surge levels of 9-13 feet. A stalling storm piling even more water onto even more of the coast?
Needham points out an “unthinkable,” seeing that forecast models show “Florence making landfall on Thursday evening…and Florence still making landfall on Friday evening. A slow-moving hurricane tracking near a coastline is bad news indeed, as it enables the storm to inflict destructive storm surge along an extended area.”
What’s worse is that the collapsing steering currents may not just delay landfall but also could lead to the hurricane drifting southwest with its core paralleling the South Carolina coast. Initial offshore winds that are increasing as the center moves closer to any point on the coast would drive water ashore in ways unseen in other landfalling hurricanes. Intracoastal waterways could flood barrier islands on their landward sides, and previous precautions for flooding may not be sufficient.
A recent example is 2017’s Hurricane Irma flooding coastal Jacksonville, Florida. When landfalling storms approach Jacksonville from the Atlantic Ocean, winds initially blow from north-to-south. But Irma’s huge wind field instead whipped up a coastal surge from the south, swamping places unaccustomed to surge.
But Florence’s surges may be more than a directional oddity. The hurricane’s offshore winds will initially push tremendous amounts of water away from the coast, much like offshore winds emptied Tampa Bay, Florida as Irma approached. As Florence’s center then passes, Needham explains, “powerful winds in the hurricane’s eyewall, the most intense part of the storm, would immediately shift from offshore to onshore, producing a destructive storm surge in the matter of minutes.” Such sudden, extreme changes are likely to catch residents off guard.
It happened recently in The Philippines. Supertyphoon Hainan’s surge came ashore like a tsunami, Needham says, as the wind shifted direction. He notes that 2013’s Hainan was one of the most intense tropical cyclones to make landfall in recorded history, and he doesn’t expect the surge from Hurricane Florence to move as rapidly.
Still, such a sudden reversal of high winds from a hurricane moving unusually from north to south off the South Carolina coast would push storm surge quickly ashore, devastating the shoreline.
Expect the unexpected with Hurricane Florence. If local authorities tell you to leave, get out.

1871 Hawaii Hurricane Strike Shows Lane's Imminent Danger Isn't Unprecedented

Powerful Hurricane Lane is forecast to skirt if not directly hit Hawaii as a slowly weakening major hurricane today and Friday. Its track is unusual: most Central Pacific hurricanes either steer well south of the tropical paradise or fall apart upon approaching the islands. But a recent paper in the Bulletin of the AMS reveals that such intense tropical cyclones menace Hawaii more frequently than previously thought.
Hurricane Lane as of Thursday morning local time was packing sustained winds of 130 mph with gusts topping 160. Its expected track (below) is northward toward the middle islands today and early tomorrow, followed by a sharp left turn later Friday. When that left hook occurs will determine the severity of the impacts on Maui as well as Oahu, home to Hawaii’s capital and largest city, Honolulu. Although Lane is expected to slowly weaken due to increasing wind shear aloft, it appears that the Big Island of Hawaii, Maui, Molokai, and Oahu will be raked at a minimum by tropical storm winds gusting 55-70 mph, pounding surf, and heavy, potentially flooding rain. Hurricane conditions on these islands also are possible.

Three-day track forecast for Hurricane Lane's approach to Hawaii.
Three-day track forecast for Hurricane Lane’s approach to Hawaii (Central Pacific Hurricane Center).

The last major hurricane to affect the islands with more than swells and heavy surf was Hurricane Iniki in 1992. It was passing well south of the islands when an approaching upper-air trough brought in steering flow out of the south, and Iniki made a right turn toward the western islands while intensifying into a strong Category 4 hurricane. It slammed directly into the garden island of Kauai with average winds of 145 mph and extreme gusts that damaged or destroyed more than 90 percent of the homes and buildings on the island. Iniki obliterated  Kauai’s lush landscape, seen in its full splendor in such movies as Jurassic Park, which was filming there as the storm bore down.
The only other known direct hit on Hawaii was by 1959’s Hurricane Dot, which was a minimal Category 1 storm–the winds barely reaching threshold hurricane intensity of 74 mph when its center crossed Kauai. Without any prior record of major hurricane landfall, Iniki was not just rare, it was considered unprecedented.
Until now.
More than a century before Iniki, a major hurricane crashed into the Big Island, its intense right-front quadrant passing directly over neighboring Maui, causing widespread devastation on both islands. Its discovery is outlined in Hurricane with a History: Hawaiian Newspapers Illuminate an 1871 Storm, which details the narrative thanks to an explosion of literacy on the islands in the mid 19th century, which led to hundreds of local language newspapers that published eyewitness accounts of the storm.
Map showing the reconstructed track of the Hawaii hurricane across the eastern islands of Hawaii and Maui on 9 Aug 1871. Labeled red circles indicate the approximate time and location of the core of the storm. Green shading shows terrain altitude every 2,000 ft (610 m).

The new historical research, published in the January 2018 BAMS, found unequivocal evidence of an intense hurricane that struck August 9, 1871, causing widespread destruction from Hilo on the eastern side of the Big Island to Lahaina on Maui’s west side. A Hawaiian-language newspaper archive of more than 125,000 pages digitized and now made publicly available along with translated articles contained account after account of incredible damage that led the paper’s authors to surmise that at least a Category 3 if not a Category 4 hurricane hit that day.
The paper’s analysis is put forth as “the first to rely on the written record from an indigenous people” of storms, droughts, volcanic eruptions, and other extreme natural events. Accounts published in Hawaiian newspapers create a living history of the 1871 hurricane’s devastation, as recounted in the paper:
“On the island of Hawaii, the hurricane first struck the Hāmākua coast and Waipi‘o valley. The following is from a reader’s letter from Waipi‘o dated 16 August 1871:”

At about 7 or 8 AM it commenced to blow and it lasted for about an hour and a half, blowing right up the valley. There were 28 houses blown clean away and many more partially destroyed. There is hardly a  tree  or  bush  of  any  kind  standing  in  the  valley (Pacific Commercial Advertiser on 19 August 1871).

“An eyewitness from Kohala on Hawaii Island wrote the following:”

The greatest fury was say from 9 to 9:30 or 9:45, torrents of rain came with it. The district is swept as with the besom of destruction. About 150 houses were blown down. A mango tree was snapped as a pipe stem, just above the surface of the ground. Old solid Kukui trees, which had stood the storms of a score of years were torn up and pitched about like chaff. Dr. Wright’s mill and sugarhouse, the trash and manager’s residence, were all strewn over the ground (Ke Au Okoa on 24 August 1871).

“On Maui, newspaper reports document that Hāna, Wailuku, and Lahaina were particularly hard-hit. A writer in Hāna described the storm:”

Then the strong, fierce presence of the wind and rain finally came, and the simple Hawaiian houses and the wooden houses of the residents here in Hāna were knocked down. They were overturned and moved by the strength of that which hears not when spoken to (Ka Nupepa Kuokoa on 26 August 1871).

“In Wailuku the bridge was destroyed:”

… the bridge turned like a ship overturned by the carpenters, and it was like a mast-less ship on an unlucky sail.” (Ka Nupepa Kuokoa on 19 August 1871).

“From Lahaina came the following report:”

It commenced lightly on Tuesday night, with a gentle breeze, up to daylight on Wednesday, when the rain began to pour in proportion, from the westward, veering round to all points, becoming a perfect hurricane, thrashing and crashing among the trees and shrubbery, while the streams and fishponds overflowed and the land was flooded (Pacific Commercial Advertiser on 19 August 1871).

The BAMS paper concludes that the 1871 hurricane was “a compact storm, similar to Iniki.” Honolulu escaped damaging winds or rain despite such a close encounter.
Because such historical records have been unnoticed for so long, the paper notes “a number of myths have arisen such as ‘the volcanoes protect us,’ ‘only Kauai gets hit,’ or ‘there is no Hawaiian word for hurricane.’”
Today’s powerful Hurricane Lane and the newfound historical records go a long way to dispelling these misconceptions about the threat of hurricanes in the Hawaiian Islands.
 

Oh Say Can You Breathe? The Impact of Fireworks on Air Quality in the United States

[Photo by Mike Enerio on Unsplash]
[Photo by Mike Enerio on Unsplash]

by Perry Samson, Climate and Space Science and Engineering, University of Michigan
On July 4th last year, in an attempt to entertain my two grandchildren, I set off what I felt was a modest display of fireworks in our front yard. A monitor that measures the concentration of particles (PM2.5) in the air was mounted there and my colleague, Jeff Masters of Weather Underground, noticed that the concentrations being recorded were remarkably high that evening. This led us to review hourly concentrations of PM2.5 that night across the United States, collected both by state agencies and an independent network available from PurpleAir.org.  Results showed widespread increases in particulate concentrations that evening, with increases varying across the country.
Nationally, about 80% of all sites saw a doubling of particulate matter during the evening of July 4, 2017 with several sites producing exceedances of the National Ambient Air Quality Standard of 150 µg/m3 3-hour standard. These results were presented at the AMS Annual Meeting in January in a talk entitled “Oh Say Can You Breathe.”
Average hourly particle concentration increases from background levels seen in 2017 for multiple sites across the United States.

Average hourly particle concentration increases from background levels seen in 2017 for multiple sites across the United States.


Moreover, the increase in PM2.5 seen in 2017 is consistent with other years. The increase in PM2.5 from background levels was compiled for the eight-year period 2010-2017. Over that time over 25% of measurement sites in the United States reported a rise of at least 35 µg/m3 with about 5% reporting a rise of greater than 100 µg/m3.
Percent of all measurement sites reporting an hourly increase in PM2.5 from background conditions exceeding both 35 µg/m3 and 100 µg/m3.

Percent of all measurement sites reporting an hourly increase in PM2.5 from background conditions exceeding both 35 µg/m3 and 100 µg/m3.


These results are compelling as they point out how, for at least one evening a year, we are willing to subject ourselves (and even our grandchildren) to high concentrations of particulate matter. According to the EPA, concentrations above 150 µg/m3 are considered “Unhealthy” and can cause widespread coughing and other increased respiratory effects.
While it is unlikely that there will be much political will to legislate against fireworks displays in the United States, these results should be of interest to people suffering from asthma who may want to protect themselves from outdoor air during this year’s July 4th celebrations.
As for me, and despite evidence of risk, I’m doubling down on the fireworks this year to REALLY impress the kids.
I just moved the PM2.5 monitor away from my home.
[Photo by Sang Huynh on Unsplash]
[Photo by Sang Huynh on Unsplash]

Future Hurricanes a Bit Stronger and Slower, but Much Wetter in a Warmer Climate

It’s been more than 8 months. Since Maria. Irma before. And Harvey before that. For many who endured them, it was yesterday. And here we are at the start of another hurricane season.
2018-NOAA-hurricane-numbers
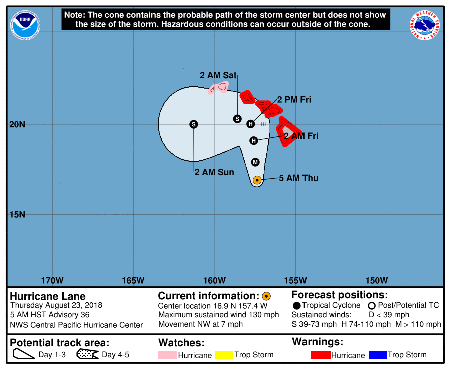
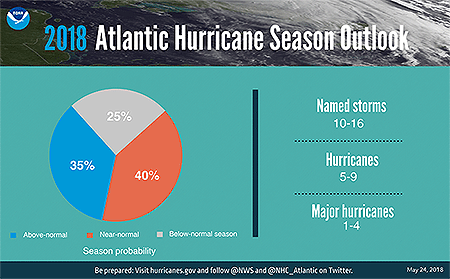
What can we expect? It is nearly indisputable that there will be hurricanes. NOAA’s forecast issued last week calls for 5-9 of them this year. Will they strike land? Science can’t yet say whether any hurricanes and tropical storms will or won’t later this season. It depends on atmospheric steering currents in the Atlantic basin and how they set up this year, particularly during the heart of the six-month season—from August through October.
But new research is looking beyond this season, beyond many seasons, and is discovering a different type of hurricane season less than 80 years from now, as Earth’s climate warms.
The new study published in the Journal of Climate finds that near-future hurricanes will be wetter and stronger, and they likely will move slower than before, increasing the risk of serious landfall flooding.
Scientists analyzed more than 20 recent hurricanes to determine how they might change near the end of this century, assuming an increase in global temperatures. One such hurricane—Ike from 2010, which inundated coastal Texas, killing more than 100 people and obliterating the popular Bolivar Peninsula barrier island north of Galveston, would have 13 percent stronger winds, move 17 percent slower, and be 34 percent wetter in a warmer world.
Others might move faster and be slightly weaker. But none of the storms reanimated in the future became drier.
“Our research suggests that future hurricanes could drop significantly more rain,” says NCAR scientist Ethan Gutmann, who led the study. Hurricane Harvey unloaded three to four feet of rain in a wide swath from Victoria, Texas, across the Houston area and into Port Arthur in extreme eastern Texas, breaking records and causing devastating flooding, and demonstrating “just how dangerous that can be,” Gutmann says.
That danger is being magnified as coastal populations continue to exponentially grow. “The potential influence of climate change on hurricanes has significant implications for public safety and the economy,” NCAR stated in a release about the new research. The study showed that “the number of strong hurricanes, as a percent of total hurricanes each year, may increase,” Ed Bensman, an NSF program director in the Division of Atmospheric and Geospace Sciences, says. “With increased development along coastlines, that has important implications for future storm damage.”
NSF supported the study, which viewed future hurricanes for the first time collectively at high resolution. Past studies looking at how hurricanes may change in a warmer climate have relied on climate model projections that are determined on a global scale and with temporal resolution of decades to centuries. Their resolution is too low to “see” future hurricanes. Weather models, on the other hand, can see them, but they aren’t used to see long-term because of the high costs of running them.
With the new research, scientists made use of an enormous NCAR dataset and ran the Weather Research and Forecasting (WRF) model at a high resolution (4 kilometers, or about 2.5 miles) focused on the lower 48 United States for two 13-year periods. The first determined the weather as it happened between 2000 and 2013 and the second simulated the same weather but with a climate 5° C (9° F) hotter and subsequently wetter that was warmed near the end of this century by unabated greenhouse gas emissions.
Comparing 22 historic Atlantic hurricanes to the same number of future hurricanes with very similar tracks found a collective 6 percent increase in top wind speeds, but a 24 percent increase in average rain rates. The future storms moved 9 percent slower than in the past.
Individually, each hurricane was unique, some changing one way and others differently. All were rainier. And while other studies have suggested that increases in atmospheric stability and wind shear may lower the total number of annual hurricanes and tropical storms, “from this study we get an idea of what we can expect from the storms that do form,” Gutmann says, and they are likely to be more intense.
2018-Hurricane-namesThere isn’t a way to tell yet what this year’s hurricanes will be like. But it’s another year into our warming world, and this is yet another study pointing to ominous changes with hurricanes in our future.

Small-scale Vortices Enhanced Winds and Damage in Hurricane Harvey

Severe but highly variable wind damage to homes & infrastructure is a hallmark of intense tropical cyclones. Until recently there was only speculation that such damage, which appears in short swaths, was the work of tornadoes. Now, there’s first-ever proof that tornadoes and other small-scale phenomena did indeed enhance the winds and damage in Hurricane Harvey last August.

Fine-scale Doppler On Wheels (DOW) radar imagery collected from inside the eyewall of Hurricane Harvey (Left: radar reflectivity, Right: Doppler velocity). The ring of convection comprising the eyewall is highly perturbed by four MVs (labeled A-D). From inside the eye, the wind perturbations caused by the MVs are especially visible. DOW location is yellow dot. Black rectangle is zoomed-in area shown in separate figure illustrating tornado-scale vortices.
Fine-scale DOW radar imagery from inside the eyewall of Hurricane Harvey (Left: radar reflectivity, Right: Doppler velocity). The ring of convection comprising the eyewall is highly perturbed by four MVs (labeled A-D). From inside the eye, the wind perturbations caused by the MVs are especially visible. DOW location is the yellow dot. Black rectangle is zoomed-in area shown in figure below illustrating tornado-scale vortices.

 
Doppler of Wheels (DOW) radar in the eye of Harvey revealed mesovortices (MVs) rotating swiftly around the inner eyewall, and embedded in them and documented for the first time were small tornado-scale-vortices (TSVs) less than a half-mile wide spinning within the larger wind field of the hurricane. The discovery was reported in March in a paper published in Monthly Weather Review.
The rotation of the TSVs is weaker than typical supercell tornadoes, but because these circulating winds are embedded in an already extreme eyewall, they ramp up the wind speed and create greatly enhanced damage potential, says the study’s lead author Joshua Wurman of the Center for Severe Weather Research. In Harvey, major hurricane winds of about 120 mph ramped up to 130-140 mph or more and resulted in streaks of severe damage not evident elsewhere from the eyewall winds.
“Wind gusts at the DOW site were measured up to 145 mph, likely caused by a TSV, and 30% of the vehicles parked near the DOW were lofted,” Wurman wrote in a summary of the paper to appear in a forthcoming issue of the Bulletin of the AMS. A Jeep and two SUVs were picked up by the wind and landed atop debris from the destroyed building in which they were housed. He said the swaths of intense damage corresponded to the tracks of the eyewall TSVs.
Doppler velocity data reveals single and paired TSVs (demarked schematically with black circles) translating rapidly southward in Harvey’s northwestern eyewall embedded in strong northerly flow (black arrow). These TSVs, moving southward at up to 120 mph, were associated with very intense winds measured up to 145 mph, lofted vehicles, and swaths of the most intense building damage.

Doppler velocity data reveals single and paired TSVs (black circles) translating southward in Harvey’s northwestern eyewall embedded in strong northerly flow (black arrow). These TSVs, moving southward at up to 120 mph, were associated with very intense winds measured up to 145 mph, lofted vehicles, and swaths of the most intense building damage.

 
Wurman and co-author Karen Kosiba, also with CSWR, will present their research findings from Hurricane Harvey as well as newly identified evidence of at least one Harvey-like TSV in Hurricane Irma over Florida at the 33rd AMS Conference on Hurricanes and Tropical Meteorology next week in Ponte Vedra Beach, Florida. The conference will feature a number of other presentations on the devastating hurricanes of 2017, in multiple sessions (Session 1, Session 2, Session 3, Session 4).
Intense wind gusts, likely caused by tornado-scale vortices in Harvey’s eyewall, lofted SUV-type vehicles (red arrows; green arrows point to unlofted vehicles). Wind gusts as intense as 145 mph were measured by a DOW-mounted anemometer 350 m downstream from these lofted vehicles.
Intense wind gusts, likely caused by TSVs in Harvey’s eyewall, lofted SUV-type vehicles (red arrows; green arrows point to unlofted vehicles). Wind gusts as intense as 145 mph were measured by a DOW-mounted anemometer 350 m downstream from these lofted vehicles.

 
Wurman notes that it’s unclear whether the new wind whirls are more numerous in intense or rapidly strengthening hurricanes. But adds that the enhanced damage was palpable, and with an increase in powerful hurricanes possible due to rising global air and ocean temperatures, it’s important to learn more about them, he says.
“Potential climate change may result in more frequent intense and/or rapidly intensifying hurricanes, thus understanding and forecasting the causes of hurricane wind damage is a high priority.”

Satellites Capture Weather History in the Making

Geostationary Operational Environmental Satellite 16, now GOES-East, became operational in December and this eye in the sky is capturing stunning color weather imagery daily. Today, it’s the third nor’easter in two weeks explosively developing into a blizzard off the Northeast Coast.

GOES-16 GeoColor image of the March 13, 2018 blizzard wrapping up off the New England coast. Image from 10:47 a.m. EDT. Click here for a loop of the storm.

 
Following on the heels of the deadly and damaging storm of March 2, which cranked out onshore wind gusts of nearly 100 mph flooding the eastern New England coastline while dropping more than three feet of snow inland, and last week’s barrage of heavy wet snow that knocked out power to more than a million customers, today’s storm is delivering blizzard conditions to eastern New England, with the potential to bury the region with as much as two feet of late-season snow.
And it’s hitting on an auspicious date. Twenty-five years ago today the infamous Superstorm of 1993 (March 13-14) exploded into the history books with crippling snowfall and ferocious winds from the Gulf Coast to the Northeast, and with severe thunderstorms, tornadoes, and deadly storm surge in Florida.
The massive comma-shaped cloud of the Superstorm of March 13-14, 1993, envelopes the entire eastern United States. Click here for an animation of this "Storm of the Century."
The massive comma-shaped cloud of the Superstorm of March 13-14, 1993, envelopes the entire eastern United States. Click here for an animation of this “Storm of the Century.”

 
GOES H, which launched on February 26, 1987, and became operational as GOES-7 captured the image of the Superstorm above.
Also known as the “Storm of the Century,” it set record-low barometric pressures across the Southeast and Mid-Atlantic states and ranks among the costliest and deadliest storms of the twentieth century, killing hundreds of people. Jeff Halverson of NASA reports in a Washington Post article the five most remarkable attributes of the Storm of the Century, including that in 2017 dollars the storm cost $10 billion.
The NWS office in Wilmington, North Carolina has an online report of the Superstorm, including its meteorological history, animated satellite imagery, observations, weather maps, links to local newspaper stories, personal accounts, photos, video, and links to technical reports on the storm.
Three papers were published in BAMS just two years following the epic storm. One was an overview of the meteorology of the storm, another looked at forecasting the storm from an operational perspective, while the third looks at what computer models of the day were seeing beforehand.
Similar to today’s blizzard, and arguably even better for such a huge event, the Superstorm of 1993 was well forecast; as many as 5-6 days in advance computer models of the day depicted it run-after-run.
What’s different today is the crisp imagery of weather systems in the Eastern United States from the most advanced GOES satellite in orbit so far. GOES-East employs an Advanced Baseline Imager (ABI) that is state-of-the-art, enabling visible and infrared imagery as well as the generation of many high-level products. A paper published in BAMS in 2017 takes a closer look at the ABI on the GOES-R series, highlighting and discussing the expected improvements of each of its attributes.

There's That Word Again: "Bomb"

It’s like the word du jour. Or, more accurately, THE word du storm.
It seemed like every time this winter that a big East Coast storm—a significant nor’easter—looked impending in computer models, the media hype machine cranked out the word “Bomb.” Or “bomb cyclone.”
And here it is again:
Destructive Nor’easter Emerging; Expected to ‘Bomb Out’” weather.com trumpeted Thursday morning about Friday’s storm.
Bomb Cyclone: MA Town Orders Voluntary Evacuations” the Falmouth Patch splashed on its online front page. (Ponder that additional hype for a moment: order “voluntary evacuations.”)
Another ‘bomb cyclone’ — with a huge flood risk — is aiming for the Northeast” buzzed CNN.
Bomb cyclone. As in meteorological bomb. Short for bombogenesis. Not a fiery explosion, but rather an explosive—as in extremely rapid—deepening or lowering of atmospheric pressure in the center of the storm. A drop of at least 24 mb in 24 hours. That ramps up big winds.
This time, though, the term may be apropos. And not just meteorologically.
While the pressure in tomorrow’s nor’easter is expected to plunge from about 1006 mb to 975 mb—31 mb—from Thursday night to Friday night, meeting the definition of bombogenesis, it’s the formidable eruption of hazardous weather—high winds, heavy rain and snow, and coastal flooding, potentially major to even severe coastal flooding, the NWS in Boston says—that will define this particular storm.
The storm will generate high winds from the mid-Atlantic to eastern New England, gusting 50-60 mph in many areas and possibly to 75 mph hurricane force in southeast New England and on eastern Long Island. For a long time, as strong high pressure over Greenland (that incidentally has brought stunningly warm air to the Arctic) slows the storm’s departure.
These northeast winds will persist through three high tide cycles, some of the highest tides of the month, contributing to minor to major coastal flooding from Maryland to Maine, as detailed in a blog post by the Weather Underground. And with 2-3 feet of storm surge combined with 20-30 foot waves just offshore and tides Accuweather says are already running 2-4 feet above normal, there’s a small chance that flooding at the coast could be severe and widespread—”a very dangerous situation that may require evacuations,” the NWS in Boston stated in its 5 a.m. Thursday Area Forecast Discussion.
Add to that 2-4 inches of rain likely to worsen snowmelt flooding across much of Southern New England and more than a foot of heavy, wet snow in the higher elevations of the Northeast, and Friday’s nor’easter looks set to do some damage. Power outages from the winds and snow are likely.
We’ve posted about meteorological bombs before, here and here. This time, this nor’easter might just live up to the hype.

Epic Blizzards Paralyzed New England, Midwest 40 Years Ago

By Chris Cappella, AMS
It began with a whisper. And ended in smothered silence for millions.
 

Cars and trucks stuck in snow on Route 128 near Needham, Massachusetts, following teh Blizzard of '78.
Cars and trucks stuck in snow on Route 128 near Needham, Massachusetts, following the Blizzard of ’78. Source: U.S. Army Corps of Engineers
Slideshow of blizzard photos.

 
I’ll never forget seeing tiny snowflakes blowing down Ocean Avenue in our small sea-side suburb of New Haven. In my hometown of West Haven, on the south shore of central Connecticut overlooking Long Island Sound, when snow fell it usually just stuck, firmly. On everything. The relative warm ocean water often changes our winter events to miserably cold rain. It never allows for dry, powdery snow. Or so I thought. Today—February 6, 1978—would be different. Far, far different. Than many of us hearty New Englanders, as we’re known, had ever seen. For that silky soft sinewy snow I was seeing in the infancy of this storm would grow into a furious blizzard and bury the region—a blizzard by which all others there since would be measured.
The tiny flakes blew into snowy tendrils that would side-wind down the road until they escaped the wind. And pile into miniature snowdrifts. A harbinger of things to come, but on a gigantic scale. This was the beginning of the epic Blizzard of ’78 in New England. Over the next 30+ hours, the snow would fall heavier than anything I—and most of us in the Northeast—had ever experienced. Sideways snow. Two to three inches an hour. For hours and hours. Blowing in winds gusting over 50 mph region-wide, and to hurricane force along the coast. 110 mph Scituate, Massachusetts. Snow so deep even as a 12-year-old I would struggle to walk in it. Drifts so large and deep they dwarfed entire houses. You could jump off second-story rooftops into them. And my friends and I did. Off our grammar school roof. Even its 45-foot high gymnasium roof. Weightless, for a second or two. And then: whump! We’d completely disappear in snowdrifts 10-15 feet tall.
Buried barely begins to describe the otherworldly landscape. Nearly all human life in the region would slow down and eventually grind to a halt. Thousands of people stranded on roadways as blinding snow enveloped everything, too quickly to make an escape. Governor Ella T. Grasso ordered all vehicles off the roads. We capitalized on it. Building giant snow forts with tunnels in the mountains of snow piled on sides of our road. Only once, though, did we recklessly dive into our snow tunnels to escape an oncoming snowplow. Luckily for us kids the snowplow only took out the last 3-4 feet of our tunnels, sparing us certain death. By snowplow.
Legendary Boston meteorologist, Harvey Leonard, who was just 29 then, remembers seeing “big potential” for a major snowstorm coming together in the Northeast four days beforehand—a lead-time “close to unheard of” in those days, he told The Boston Globe in a recent article chronicling the blizzard.

“As a person — not only a meteorologist, but somebody who really loves weather and is fascinated by storms, particularly winter storms — it was pretty amazing to see what was unfolding. ‘78 still stands as the most powerful and wide-reaching storm that I’ve ever been involved in forecasting and experiencing.”

The defacto “official” website devoted to the storm—blizzardof78.org—put together by amateur historian Matt Bowling describes how a failed forecast weeks earlier set up a situation in which people headed to work and school that Monday morning, February 6, as if just a routine snowfall was expected.

It is safe to say that by the time February 6th, 1978 came along, New Englanders had been pretty-well trained to not pay much attention to the weathermen. It had been a difficult winter already. On January 21st, as most forecasters predicted only rain, New England had been blanketed by a major league snowstorm that dropped 21 inches of snow in Massachusetts and downed a record number of power lines in Rhode Island.   This forerunner to the Blizzard of ’78 had brought so much snow that the roof of the Hartford Civic Center actually collapsed from the weight. When forecasters began predicting another big storm, nobody thought too much of it.

In a series of quotes gathered and posted to the site, WTNH-TV meteorologist and Western Connecticut State University professor Dr. Mel Goldstein continues this theme, describing why there was skepticism about the forecast for the storm:

Back in 1978 we did not have the accuracy of the computer models that we have today. And in 1978 there was a brand new computer model that came out and it was predicting the storm to be pretty much the magnitude it turned out to be. But because the computer model was brand new, people did not have confidence in it. And so there was some question whether or not people wanted to buy into the kind of product that it was delivering. To me it looked very reasonable … and I took my little bag of clothes and I moved into Western Connecticut State College weather lab and I said, ‘I’m going to be here for a few days and there’s no question about that. It’s in the logbook on that day: ‘a granddaddy of a snowstorm is coming our way.’

And in another Boston Globe article, noted weather columnist David Epstein wrote four years earlier about The meteorology behind the blizzard of February 6-7th 1978. In his article he reiterates how so many were caught off guard by the blizzard.

Computer models were still relatively new and a series of busted forecasts left many people skeptical that a big storm was actually coming. On the morning of the 6th, snow was suppose to start prior to the morning commute. However, when folks awoke and saw the snow hadn’t begun many of them decided it was another busted forecast and went to work. These same people would then try to get home that afternoon while the blizzard was fully underway.

A search on YouTube turns up numerous documentaries on the Blizzard of ’78, including “Blizzard of ’78,” below, on Leonard’s station WCVB.

Remarkably, New England’s Blizzard of ’78—with its record snowfall observations in Boston and Providence and its utter destruction along the Massachusetts coast as powerful winds slammed monster waves ashore through four tide cycles—came on the heels of a nearly equally intense blizzard that slammed the Midwest on January 25-27. That Blizzard of ’78 became known as the White Hurricane, with wind gusts of 100 mph and feet of snow shutting down states from Wisconsin to Ohio. It set pressure records (956.0 mb in Mount Clemens, Michigan—third lowest non-tropical atmospheric pressure ever recorded in the Unites States) and remains the worst blizzard on record in Ohio, Indiana, and Michigan.

Surface weather analysis of the Great Blizzard of 1978 on 26 January 1978. Source: NOAA

 
Its magnitude was summed up in a statement by NWS Detroit meteorologist C. R. Snider on January 30, 1978:

The most extensive and very nearly the most severe blizzard in Michigan history raged January 26, 1978 and into part of Friday January 27. About 20 people died as a direct or indirect result of the storm, most due to heart attacks or traffic accidents. At least one person died of exposure in a stranded automobile. Many were hospitalized for exposure, mostly from homes that lost power and heat. About 100,000 cars were abandoned on Michigan highways, most of them in the southeast part of the state.

Nearly three dozen times as many cars abandoned—and that was in just one Midwestern state.
To some, Blizzard of ’78 conjures up memories of a similar yet completely different storm.