Scratch that Cat: Revising the Saffir-Simpson Scale

British adult orange cat and little kittenIn recent years minimum sea level pressure (MSLP) measured in a hurricane’s eye has become “a much better predictor of hurricane damage” than the maximum sustained wind speed (Vmax) upon which the revered Saffir-Simpson hurricane wind scale is based.

New research by seasonal hurricane forecaster Phil Klotzbach et al. finds that MSLP is also more accurately measurable than Vmax, “making it an ideal quantity for evaluating a hurricane’s potential damage.”

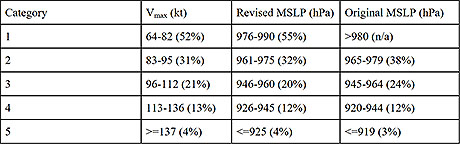
Given that the Saffir-Simpson scale was developed to characterize the risk of hurricanes to the public, we propose classifying hurricanes in the future using MSLP as opposed to Vmax. While no scale will ever perfectly account for the totality of storm risk to life and property (e.g., inland flooding), any improvements to better explain and warn the potential hurricane impacts to an increasingly vulnerable coastal and inland population is, in our view, a worthwhile endeavor.

Klotzbach et al. argue that Vmax is “nearly impossible to measure directly” as the maximum wind mentioned in advisories issued by the National Hurricane Center is the highest 1 minute sustained surface wind occurring “in an unobstructed exposure; (i.e., not blocked by buildings or trees),” which is essentially at sea, not over land. Even with today’s technology, the sparsely observed maximum wind speed is often just an estimate–even land observations are limited by anemometer failure at speeds over 50 kt.

In contrast, MSLP is easy to locate at the storm’s center and is routinely measured by the hurricane hunters in every aircraft reconnaissance mission.

Earlier versions of the Saffir-Simpson scale, created in the early 1970s by engineer Herb Saffir and meteorologist and Hurricane Center director Bob Simpson, incorporated MSLP as a proxy for wind, and they also included ranges by category of storm surge height. But these led to public confusion when actual storm surges and low pressure readings didn’t match up with the categorized winds, and they were removed in 2012.

 Vmax …provides less information on the overall storm risk to life and property than does MSLP. MSLP, on the other hand, is a useful metric in that it is strongly correlated with both Vmax and storm size, which is directly related to storm surge as well as a larger wind and rain footprint. The risk to human life is also more directly correlated to MSLP than to Vmax, given the better relationship of MSLP with storm size. MSLP was a more skillful predictor of fatalities caused by CONUS landfalling hurricanes from 1988-2018 than was Vmax. Consequently, we recommend that more emphasis be placed on MSLP when assessing the potential risks from future landfalling hurricanes.

Saffir-Simpson Hurricane Scale with current Vmax criteria, proposed MSLP criteria and original MSLP criteria from Simpson (1974). Also provided in parentheses are the percentage of Atlantic storms from 1979-2018 whose lifetime maximum intensity exceeded the weakest intensity criteria for each category threshold.


The difference between using MSLP and Vmax when predicting damage potential has become more noticeable in recent years. This is “likely due to larger-sized hurricanes such as Ike (2008) and Sandy (2012) which did much more damage than would be typically associated with hurricanes making landfall at Category 2 and Category 1 intensity, respectively.” Both storms had much larger storm surges than their category rankings suggested, as did Hurricane Katrina, which was Category 3 at landfall based on Vmax, but had a MSLP equivalent to a Category 5. Its storm surge was measured at a record 28 feet and the resulting damage was catastrophic, consistent with a Cat 5 hurricane.

Using MSLP to re-categorize some historic hurricanes at landfall, the study finds the following:

  • Hurricane Katrina (2005) would go from a Cat 3 to Cat 5;
  • Superstorm Sandy, which was post-tropical but considered “just” a Cat 1 when it made landfall in 2012, would rank as a Cat 4.
  • Hurricane Ike (2008) would be elevated from a Cat 2 to a Cat 3.
  • Hurricane Michael (2018) would have been Cat 5 at landfall rather than a high-end Cat 4 stated in advisories.

The new BAMS paper is available as an Early Online Release. It will be adapted for print and published in the February issue.

“Megaflashes”: How Long Can a Lightning Discharge Be?

Even though Earth’s atmosphere is laced by more than a billion brilliant discharges of electricity every year, lightning itself never seems ordinary. But there’s a broad range of lightning, and sometimes, at the extreme, it’s possible to recognize a difference between the ordinary and amazing, even among lightning flashes. The challenge is finding and observing such extremes.

New research by Walt Lyons and colleagues, published in BAMS, reports such a perspective-altering observation of long lightning flashes. To appreciate the observation, consider first the “ordinary” lightning flash. The charge center of the cloud itself is typically 6–10 km above ground. And from there the lightning doesn’t necessarily go straight down: it may extend horizontally, even 100 km or more. Typical lightning might be best measured in kilometers or a few tens of kilometers.

A world record flash in 2007 meandered across Oklahoma for “approximately 300 km.” But that may be a mere cross-counties commute compared to newly discovered interstate “megaflashes” that are almost twice as long. One such megaflash, as the BAMS paper names them, sparked across the sky for ~550 km from northeast Texas across Oklahoma to southeast Kansas in October 2017. And this megaflash, too, may not be the longest ̶ it just happened to occur within the Oklahoma lightning mapping array (OK LMA), allowing for its full study.

Time integrated GLM radiances over 7.18s beginning at 0513:27.433 UTC on 22 October 2017. Two distinct electrical regimes are evident. The first is the cluster of smaller flashes in the leading line of convective cells stretching from eastern Oklahoma and then southwest into north Texas. The second regime is an extensive horizontal flash propagating from near the Red River in Texas across central Oklahoma into southeastern Kansas.
Time-integrated satellite (GLM) radiances over 7.18s beginning at 0513:27.433 UTC on 22 October 2017. Two distinct electrical regimes are evident. The first is the cluster of smaller flashes in the leading line of convective cells stretching southwest from eastern Oklahoma into north Texas. The second is the horizontal megaflash propagating from near the Red River in Texas across central Oklahoma into southeastern Kansas.


Also, just like the official record flash, which produced 13 cloud-to-ground (CG) lightning strikes, including two triggering sprites that shot high into the atmosphere, this horizontal megaflash also triggered a plethora of CG bolts, in-cloud discharges, and upward illuminations during its 7.18 second lifespan.

The new Geostationary Lightning Mapper sensor on the GOES-16/17 satellite has become the latest tool suited to investigating long-path lightning. The BAMS paper says the sensor is showing that a megaflash “appears able to propagate almost indefinitely as long as adequate contiguous charge reservoirs exist” in the clouds. Such conditions seem to be present in mesoscale convective systems—large conglomerates of thunderstorms that extend rainy stratiform clouds across many hundreds of km. The paper adds,

Megaflashes also pose a safety hazard, as they can be thought of as the stratiform region’s version of the ‘bolt-from-the blue,’ sometimes occurring long after the local lightning threat appears to have ended. But some key questions remain – what is the population of megaflashes and how long can they actually become?

The authors conclude:

Is it possible that a future megaflash can attain a length of 1000 km? We would not bet against that. Let the search begin.

What If: Hurricane Michael’s Extensive Wind Swath Would Devastate Houston, NWS says

“In summary, it’s going to be bad.”

That’s how Jeff Evans with the NWS in Houston/Galveston began Wednesday’s presentation, “What if Hurricane Michael Struck Houston? An Examination of Inland Wind Damage,” at the AMS 100th Annual Meeting in Boston.

He was boots on the ground after Hurricane Michael slammed the panhandle as a Category 5 with 160 mph winds on October 10, 2018, assisting the Tallahassee NWS office with surveying the widespread wind damage that extended well away from the coast. Because Michael was intensifying at landfall as well as accelerating, its extreme winds spread deep inland, across the panhandle and well into southwest and southern Georgia.

The Donalsonville, Georgia, airport northeast of Marianna, Florida, and about 90 miles inland, recorded a wind gust to 115 mph, while Marianna had a gust to 103 mph in Michael. Both as well as Blountstown, Georgia, suffered significant damage to structures as well as trees.

Track and power outage extent map from Hurricane Michael overlaying a map of Houston. What 95% of the Houston Metro area without power would equate to.

Evans overlaid maps of Michael’s track, wind swath, and areal power outages on Houston to show the extent of its damage potential. The entire Houston metro area with 7.1 million people would suffer; 6.9 million would lose power. And damage to homes and devastation to the landscape would mimic the widespread destruction he observed in the Florida panhandle and southern Georgia where entire forests were virtually flattened.

Evans said that as an NWS meteorologist responsible for warning the Houston area if such a scenario threatened he would have a lot of trouble following the standard hurricane mantra, “Run from the water, hide from the wind.”

Rice University in the Houston Metro area is about the same distance from the coast as Blountstown, Florida, which was blasted by Hurricane Michael.

“Telling people inland to stay put in such extreme wind conditions is not something I would want to do,” he says.

But, he adds, telling them to get out could prove just as deadly in the mass exodus.

“When you start talking about storms, such as Rita, with 130 mph winds or higher, it’s a spontaneous evacuation.” More than 50 people died just from the evacuation of Houston ahead of that storm, he says

It’s been 37 years since a storm brought a significant wind threat to the Houston area. Hurricane Alicia in 1983 was the last. Hurricane Harvey in 2017 was a widespread catastrophic flood event. Hurricane Ike in 2008 was primarily a surge storm.

“The population in and around Houston has doubled during that time,” Evans says. A 2015 American Community Survey showed more than 130,000 people in just Harris county who live in mobile homes, with thousands more in the surrounding counties.

He conducted the research to raise awareness of a “Michael-like” storm and the immense challenges it would represent.

10-m Resolution Quarter-Trillion Gridpoint Tornadic Supercell Simulation Mesmerizes

An exceptionally high resolution simulation of a supercell thunderstorm fascinated conferees Tuesday at the AMS 100th Annual Meeting in Boston. Leigh Orf of the University of Wyoming presdented imagery and animations of the simulation that ran on the Blue Waters Supercomputer. With a 10 m grid spanning 11,200 X 11,200 X 2,000 (251 billion) grid volumes, the 270 TB subdomain contains the entire life cycle of the tornado, including 10 minutes prior to tornado formation.

Image created with VAPOR3 of a 10-m supercell simulation. (a) Volume rendered cyclonic vertical vorticiy, highlighting the 3D structure of the tornado shortly after formation.
Image created with VAPOR3 of a 10-m supercell simulation. (a) Volume rendered cyclonic vertical vorticity, highlighting the 3D structure of the tornado shortly after formation. The 2D surface field traces the maximum surface cyclonic vertical vorticity, providing a representation of the tornado’s path. The view is following the tornado’s path. (b) As in (a), but later in the simulation when the tornado exhibits a multiple vortex structure. (c) Volume rendered cloud mixing ratio, with parameters chosen to present a quasi-photorealistic view of the cloud field. The 2D surface field traces the minimum pressure found in the tornado’s path. (d)  As in (a) and (b), but a different, wider view and utilizing different opacity and color map choices. The vortex to the left, which merges with the tornado later in the simulation, is weaker than the nascent tornado as evidenced by the vortex’s more transparent and darker visual presentation and path.


Record January Thaw for the 100th AMS Annual Meeting Adds to “Unconventional” Weather Trend

[UPDATED] You’ve heard it before: The convergence of thousands of meteorologists at AMS Annual Meetings brings unusual weather to the host city. Spring-like warmth this weekend in this year’s host city of Boston is continuing this trend.

As of 2 pm ET Sunday, the temperature at Logan International Airport has climbed to at least 73 degrees, breaking the monthly record high of 72 for the city set on January 26, 1950. It smashed the daily record high 61 first established in 1913.

On Saturday, southwest winds gusting to nearly 50 mph drove the day’s high to 70 degrees, topping the daily record set in 1975 by 8 degrees.

The marquee at the Boston Convention and Exhibition Center announces AMS100. The temperature was a record 69 degrees at the time.


Sunday’s temperature could go even higher—nearby Norwood was 74 at 2 pm—before a a north-south cold front halfway across Massachusetts and Connecticut plows through Boston mid afternoon, bringing an end to the record-setting January thaw. Behind the front blustery northwest winds 40 mph or more will quickly tumble temperatures into the 40s by evening and closer to normal levels overnight and Monday.

We’ve written about the Annual Meeting weather coincidences previously on the AMS blog, dispelling the pervasive myth that our meteorological convergence brings bad and even dangerous weather to the Annual Meeting host city.

Students Converse with Air Force Hurricane Hunter Flight Meteorologists, Tornado Field Researcher

Saturday’s Student Conference at the AMS 100th Annual Meeting kicking off in Boston featured a series of Conversations with Professionals to gain insight into a variety of career choices, the work these professionals in our field currently do, and how they got where they are today. This year’s series, in which short introductions are followed by a Q and A session with students, included two meteorologists who fly into hurricanes with the Air Force 53rd Weather Reconnaissance Wing and another who helps c0-operate the Doppler on Wheels radar for tornado field research.

Below is a sampling of questions students asked Lt. Col. Ryan Rickert and Maj. Jeremy DeHart with the AF Hurricane Hunters as well as Karen Kosiba of the Center for Severe Weather Research. The answers have been edited for length and clarity.

Q (Hurricane Hunters): Can you tell us a little about your backgrounds in the Air Force?

A: (Lt. Col. Ryan Rickert) “Meteorology degrees, with active duty [13 years], go to a weather tech school to learn how to deal with military weather, and then pretty much start with your track—go to a main [Air Force] hub weather regional center to learn how to do big, broad forecasting, then … to a different place and forecast for an airfield so your supporting aircraft at the field. But there are different paths you can take: Science, modeling, Army support, Air Force support, many different ways that you can go.

A: (Maj. Jeremy DeHart) “Yeah, I agree. A lot of people think Air Force, military, and are like ‘Oh, I want to do research … it’s not really my cup of tea.’ but there are so many different tracks you can take, and you’re not going to get the breadth of experience you will in the Air Force doing the jobs we did while on active duty. I have a masters degree and they sent me to California for two years [while on active duty], and I was a full-time student and was paid full-time to go to school. And they’ll do that for your Ph.D., go teach at the Air Force Academy … so don’t be scared off by [military] operations.

Lt. Col. Ryan Rickert (r) and Major Jeremy DeHart at Saturday's Conversations with Professionals series.
Lt. Col. Ryan Rickert (r) and Major Jeremy DeHart at Saturday’s Conversations with Professionals series.

Q (Hurricane Hunters): How do you adjust when a hurricane is rapidly intensifying?

A: (Maj. Jeremy DeHart) You’re always adjusting, because it’s never what you exactly expected. We maintain a pressure altitude of 10,000 feet flying into and through the eye of a hurricane. By the time you’re in the eye, in the stronger storms you’re down to 8,000 feet. In Hurricane Wilma, which set a low pressure record, they were flying at 5,000 feet because they didn’t expect it to be that strong, and by the time they got [in the eye] it had bottomed out and the plane flying a 5,000-foot pressure … was down to about a thousand feet and had to pull up.”

A: (Lt. Col. Ryan Rickert) “We don’t do that anymore. We now go in higher. … When we’re briefing we’re changing things. And even in the execution of the mission we constantly have to adjust. … Constantly changing our pattern if there’s a really intense area [of convection] that doesn’t look [on radar] like it’s safe to go through.

Q (Hurricane Hunters): What do you do in the off-season?

A: (Maj. Jeremy DeHart) “We go to a lot of airshows.”

A: (Lt. Col. Ryan Rickert) “We give talks at conferences, promote what we do, find out what kinds of new instruments we want to put on our airplane, things like that.”

A: (Maj. Jeremy DeHart) “A lot of people don’t realize we have a winter storm requirement as well. … We’ll fly a synoptic pattern and just pepper a big storm with [dropwindsondes]. We’ll fly higher, like 30,000 feet or so, and just carpetbomb the whole thing with instruments.”

Q (Tornado Research): What made you target research versus academia on your career path?

A: (Karen Kosiba) “Sometimes when you’re deep in academia you don’t think there’s anything outside academia. I was getting ready to graduate and I had done tons of field research but also applied for jobs in academia, in government … and I got many of those jobs. So I picked what I liked. But even if you don’t know what you’re doing you visualize that you’ll try a little of everything. … When I first started working with the Doppler on Wheels I thought I was going to be a technician … but I started to enjoy some different things and it just ended up this way. Just because you get a bachelor’s, a master’s, a Ph.D., an associate degree—whatever you’re getting your degree in—doesn’t mean you can’t do different jobs.”

Karen Kosiba, with the Center for Severe Weather Research, answers students' questions Saturday at the AMS 100th Annual Meeting.
Karen Kosiba, with the Center for Severe Weather Research, answers students’ questions Saturday at the AMS 100th Annual Meeting.

Q (Tornado Research): Can you elaborate a little on graduate school and how you learned how to write grants?

A: (Karen Kosiba) “For those of you in graduate school, or going to graduate school, you usually work with a professor, and they’re trying to get grants, too. My professor said ‘Hey, you want to write a grant proposal?’ and I was like ‘Sure, let’s write a grant proposal.’  And you don’t really know much about how to write them in graduate school. You can just wing it, or you can have a good mentor, like I did. You know, [as an aside] you think your mentor should be someone exactly like you, and even though you can have someone who likes the same stuff as you, it can be advantageous to find a person who can help you meet your career goals. Someone who understands what you want to do and who you want to be.”

Q (Tornado Research): Do you have any advice for recent graduates who are interested in project-based research rather than forecasting? It seems like a lot of people just take the first thing out there, often university helper.

A: (Karen Kosiba) It’s true. But I think there are more opportunities out there than just waking up and taking those first opportunities. In my case not only did I shop for a mentor but also an advisor who could help me out in the field. Big universities often have big field projects, and they don’t always advertise them as well as they should. It can be tricky to get out and get that experience. But places like NCAR have programs getting [their] people out to do field projects. And the University of Wyoming, NSSL, will have projects going in and out. They’re out there and sometimes you have to do a bit of work to find them. Even if one professor doesn’t have anything, they might know someone who just got funded for a project. And once you’re in them take some responsibilities on … and become an active crew member and contributor to the project.

Tornado Researchers Gather to Improve Wind Speed Estimation

The Wind Speed Estimation (WSE) standards committee–jointly supported by AMS and the American Society of Civil Engineers–is holding its 9th meeting this week in conjunction with an NSF-funded Tornado Hazard Wind Assessment and ReducTion Symposium (THWARTS) at the University of Illinois in Champaign-Urbana.
The WSE committee began in 2014 to develop standards for an improved process to estimate extreme storm winds. Currently, NWS and private post-storm damage surveys use the EF-Scale and treefall pattern analysis, real-time radar and in situ observations, remote sensing, and forensic investigations. The WSE committee includes a data archival team as well as an international working group to broaden the scope of the standard. (Click here for more information about the committee.)
WSE
This is the second joint meeting of WSE/THWARTS and will focus on sharing the latest findings on the multidisciplinary aspects of severe local storms, including the fields of meteorology, wind science and engineering, structural engineering, social science, and policy. A flyer about the symposium with basic information is available online.
Keynote speaker for THWARTS will be Erik Rasmussen. He was the field coordinator of the first of the VORTEX projects in 1994-1995 and a lead principal investigator for VORTEX2 from 2009-2010 and VORTEX-SE from 2016-2017. He currently consults with NOAA’s National Severe Storms Laboratory and the Cooperative Institute for Meteorological Satellite Studies.
The WSE meeting begins after the final session of THWARTS. The meeting is the first step toward a request for public comment on WSE, likely next year.

So, Just What Do "Sunny" Southern California Broadcast Meteorologists Do?

You know the perception: It never rains in Southern California, so forecasting the weather there is easy. Not so fast, says Anthony Yanez of KNBC TV in Los Angeles.
In his recent presentation at the 47th Conference on Broadcast Meteorology in San Diego, titled “Forecasting Southern California: Not as Easy as you Think,” Yanez takes a lighthearted yet very serious look at the myriad weather and other natural phenomena that threaten the state every year. These include heavy flooding rains, high winds, wildfires, mudslides, earthquakes, and hail. As station scientists, Southern California weather broadcasters must cover them all for viewers, and well. “I think that the science is a lot more … cuz everyone thinks the weather’s boring … when we do science, they love that. And they eat it up.”
YanezPresentation
 

So, Just What Do “Sunny” Southern California Broadcast Meteorologists Do?

You know the perception: It never rains in Southern California, so forecasting the weather there is easy. Not so fast, says Anthony Yanez of KNBC TV in Los Angeles.

In his recent presentation at the 47th Conference on Broadcast Meteorology in San Diego, titled “Forecasting Southern California: Not as Easy as you Think,” Yanez takes a lighthearted yet very serious look at the myriad weather and other natural phenomena that threaten the state every year. These include heavy flooding rains, high winds, wildfires, mudslides, earthquakes, and hail. As station scientists, Southern California weather broadcasters must cover them all for viewers, and well. “I think that the science is a lot more … cuz everyone thinks the weather’s boring … when we do science, they love that. And they eat it up.”

YanezPresentation


Report: Hurricane Michael Upgraded to Category 5 at Landfall

2018’s devastating Hurricane Michael struck the Florida panhandle at Mexico Beach and Tyndall Air Force Base in October at Category 5 intensity with 160 mph winds, the National Hurricane Center announced Friday. That’s 5 mph higher than Michael’s wind estimate of 155 mph at the time of landfall.

GOES-16 Pseudo-color image or Hurricane Michael at 1730 UTC October 10, 2018. (Courtesy: NOAA NESDIS)
GOES-16 Pseudo-color image or Hurricane Michael at 1730 UTC October 10, 2018. (Image courtesy: NOAA NESDIS)

 
In its post-storm tropical cyclone report, released the same day, NHC stated it culled an abundance of wind data measurements not available in real-time to add the 5 mph to Michael’s wind intensity. The data came from aircraft reconnaissance, ground observations, satellite intensity estimates, surface pressures, and Doppler radar velocities from Eglin Air Force Base and the NWS in Tallahassee. The report goes in-depth with the data, explaining the observations and identifying those that were believable—a 152 knot (175 mph) aircraft wind measurement at 8,000 feet in the southeast eyewall that yields a surface wind of 137 knots (158 mph)—versus those that were suspect—a 152 knot (175 mph) surface wind measured by the stepped frequency microwave radiometer (SFMR) instrument aboard a different aircraft, deemed too high based on experience with such intense winds in hurricanes Irma, Jose, and Maria in 2017.
The upgrade makes Michael only the fourth Category 5 hurricane to hit the United States, joining a small, elite group of monster landfalling storms that include Hurricane Andrew (1992, 165 mph winds), Hurricane Camille (1969, 175 mph winds), and the Labor Day Hurricane (1935, 185 mph winds). Andrew plowed into South Florida, Camille landed on the Mississippi coast, and the Labor Day Hurricane devastated the Florida Keys.
A realty building destroyed by Hurricane Michael's winds on the east of Panama City, Florida.
A realty building destroyed by Hurricane Michael’s winds on the east side of Panama City, Florida.
(Photo courtesy: Chris Cappella [AMS])
 
Hurricane Michael roared ashore on October 10 as the strongest hurricane on record to strike the Florida Panhandle, with a storm surge around 14 feet above ground level, destroying Mexico Beach and much of Tyndall AFB, while tearing apart homes and businesses in Callaway, just inland, as well as in the eastern side of Panama City. Sixteen people died directly from the hurricane due to storm surge flooding and the intense winds, which blew down entire forests in the panhandle and destroyed crops across southern Georgia. Wind damage extended into the Carolinas.
Very few surface observations of the hurricane’s intense winds were made at landfall. The highest gust was 139 mph measured by an anemometer at Tyndall AFB before it failed. Two coastal monitoring program towers measured 129 mph and 125 mph, substantially lower than the upgraded wind speed at landfall. One of the towers was knocked over before the peak winds struck, and the other was outside the hurricane’s core. NHC notes that the sites “were likely not optimally located to sample the maximum winds, which is typical during landfalling hurricanes.”