Stormy weather increases pain. That fact is actually good news for people suffering from chronic pain whose complaints are often dismissed by family, their friends, and even their doctors.
Speaking, and likely complaining, about the effect of weather on their pain for millennia, chronic pain sufferers finally have a large-scale scientific study to back up their claims. Its findings reveal that, at least in the United Kingdom where the research was conducted, days with higher pain levels correspond with lower pressure and its attendant adverse weather conditions, including higher humidity, precipitation and increased wind. Conversely, low pain days where fewer experience a pain event are dominated by higher pressure with weaker winds and drier air.
In “Weather Patterns Associated with Pain in Chronic-Pain Sufferers,” recently published in the Bulletin of the American Meteorological Society, author David Schultz of the University of Manchester’s Centre for Atmospheric Sciences and Centre for Crisis Studies and Mitigation, along with colleagues, detail their 15-month smartphone study, “Cloudy with a Chance of Pain.” The UK-wide initiative involved more than 10,000 participants suffering from chronic pain who used a special phone app daily to answer 10 questions about their level of pain, related symptoms, mood and physical activity, and other questions about their pain. GPS sensors in their phones enabled concurrent tracking of their location’s average weather conditions, pairing observations with their responses for analysis.
Using an epidemiological method to confine comparisons to individual participants, their research found on any given day that 16 percent of chronic-pain sufferers experience a pain event at least one level above their typical pain level, using a 5-point scale: “no pain,” “mild pain,” “moderate pain,” “severe pain,” and “very severe pain.” This increased to 23 percent on high pain days, and dropped to 10 percent on low pain days. Weather patterns, they found, explain part of the changes, modulating pain in people. It remains to be determined who suffers most, but Schultz et al. have confidence in the findings of the largest and longest-term study of its kind on the weather–chronic pain relationship.
“This result confirms the anecdotal evidence from the three-quarters of those who suffer from chronic pain who say that their pain levels are related to poor weather,” Schultz says in a video he produced to discuss the topic and the study’s findings. [See below.]
He notes that because prior research had inconsistent results and disagreement over findings, reactions to their research have been mixed, with both high praise and disdain.
“It’s perhaps not surprising that the public reaction to our study is one of two things: depending on who you listen to, people either thank us for showing what they already knew and giving support to their strongly held beliefs, or they say it was a waste of time and money because they already knew that poor weather was associated with their pain.”
By the very nature of the smartphone survey, Schultz notes that participants had the opportunity to really look at their pain and the conditions accompanying it. And with evidence in hand, the opportunity now exists for scientists to move toward forecasting such conditions in tandem with people’s pain levels to provide understanding in addition to potential welcome relief.
For people who suffer from chronic pain and believe weather influences their daily pain levels, scientists including them in the study and then conclusively demonstrating this relationship on a large scale gives their suffering meaning and validates their beliefs.
“We’ve received so many emails and tweets of support from those who participated telling us how much they appreciate being able to participate in a study like this where they actually felt their contributions were valued and they were contributing to answering a scientific question that was important to them personally. And, we do value their contributions.”
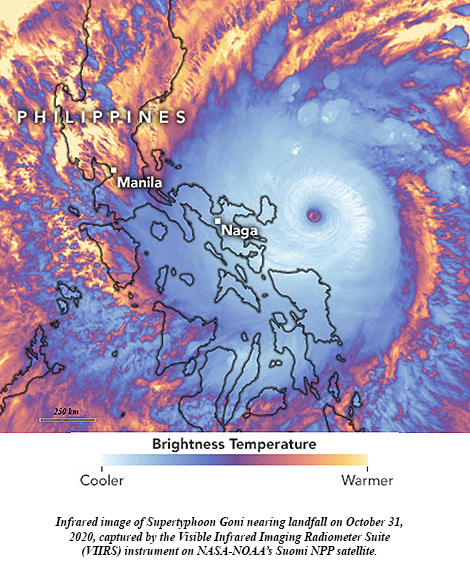
A little more than two weeks ago, Supertyphoon Goni blasted ashore in the Philippines with top sustained winds of 195 mph, becoming the strongest landfalling tropical cyclone on record. It topped STY Haiyan’s 190 mph land strike just seven years ago. With Hurricane Iota in the Caribbean explosively intensifying 100 mph in under 24 hours to reach Category 5 intensity Monday, it set a new record of five consecutive years of Cat 5 hurricanes in the North Atlantic tropical cyclone basin. Among the seven catastrophic hurricanes, starting with Matthew in 2016, were Dorian and Irma, packing 185 mph and 180 mph steady winds, respectively, with peak gusts well over 200 mph.
Goni is the latest formidable example of an increasing trend in tropical cyclone intensity. While Goni established a new landfall wind intensity record, Iota and other recent major hurricanes Eta, Zeta, and Delta set or challenged records for most intense hurricanes so late in the season.
James Elsner of Florida State University says this is to be expected. His research stated in 2008 that there was an upward trend in the intensity of the most intense tropical cyclones. Rising ocean temperatures, as theory predicted, were driving the trend. And with oceans continuing to warm along with Earth’s climate since then, Elsner anticipated the continuing upward trend. New research published in the Bulletin of the American Meteorological Society confirms his prediction, finding that another 3.5 to 4.5 percent increase in intensity has occurred with the strongest tropical cyclones during the period 2007-19.
Globally, all basins show upward trends, Elsner says, with the North Atlantic and Western North Pacific revealing the steepest and most consistent upticks.
Zeta blossomed into the 11th hurricane of this hyperactive season Monday and its forecast track takes it ashore on the Gulf Coast by midweek. The National Hurricane Center (NHC) on Monday said computer models had become more tightly clustered with the forecast in the Gulf, “resulting in an increase in track-forecast confidence,” and Hurricane Zeta is expected to become the United States’ record 11th storm landfall in a single season.
Such confidence is a reflection that NHC’s tropical storm and hurricane track forecasts, which go out 5 days, have substantially improved in the last 25 years. But, a 2018 essay in the Bulletin of the American Meteorological Society (BAMS) found that such improvements in track forecasts have slowed, raising concern about making them any better and extending them out beyond 5 days with any skill. While that study suggested improvements may have reached a limit, new research also published in BAMS finds a way to further refine them in the coming decades. Using a different interpretation of track position errors than the earlier article, the research moves the predictability limit for tropical cyclones out a day per decade to 6-8 days in the next 10-30 years.
While colleges pre-COVID-19 were already designing and implementing courses for online instruction, the pandemic has pushed entire academic course offerings into this rapidly evolving virtual environment. A new article in the Bulletin of the AMS about an online climate science course for undergraduates, which was developed, offered, and honed to near-perfection based on postcourse surveys before coronavirus, provides this tip for virtual success: Have students engage each other often, one-on-one, in a discussion forum. The result, the instructors are finding, is improved comprehension, with a high percentage of students successfully absorbing and accurately communicating course material.
The online course is titled, “Climate and Climate Change,” and has been offered through the Department of Atmospheric and Oceanic Sciences (AOS) at the University of Wisconsin—Madison since 2013. “Students enrolled in this course learn the physical principles governing Earth’s climate and climate change within the broader context of societal impacts and global political considerations,” writes lead author Andrew M. Dzambo and colleagues in the article.
The goal, they write, is to improve student science literacy and address misconceptions by implementing a key learning tool: “the weekly discussion forum where students engage with each other while testing their own knowledge.” The result is an increased knowledge of climate science and the Earth-climate system, as the surveys showed.
The course—AOS 102—has been improved since its inception, and it grew in popularity when it was moved to summer semester in 2016. It expanded its capacity in 2018 to accommodate a growing waitlist of interested students. The course is delivered through weekly worksheets, quizzes, and a final project, but it’s the weekly forum discussions that instructors credit with students’ retaining and being able to discuss climate science.
In their article, the authors present a template of the course for implementation with other atmospheric or Earth-related science coursework:
Although the discussion forums were monitored by course instructors, every student engaged other students at least once a week and freely expressed their own fact-based feedback to one another. By having the majority of the weekly course grade centered around discussion forums and worksheet assignments, complemented with weekly quizzes and an independent final project, the majority of students leave the class with a fundamental understanding of climate science (as evidenced by the course surveys) and with the confidence that they feel well informed about climate change.
With Hurricane Delta poised to strike Louisiana today, the risk of embedded tornadoes will increase as rainbands spiral ashore, along with the primary threats of storm surge and damaging winds. Delta is forecast to plow well inland Friday night into the weekend, continuing a low risk for tornadoes, some of which could occur at night in Alabama, Mississippi and into southern Tennessee. The threat is more than a bit worrisome as new research in BAMS finds through phone surveys and followup interviews in Tennessee that people are woefully unprepared for nocturnal tornadoes.
In their article,” Kelsey Ellis and colleagues found a host of poor practices by residents when it comes to tornadoes at night. The authors recommend forecasters narrow their messaging about nocturnal tornadoes in the Southeast to a single important message to limit confusion.
Almost half of Tennessee’s tornadoes occur at night, as in other Southeast states with large numbers of nocturnal tornadoes, and are two-and-a-half times as deadly as daytime tornadoes. This creates detection, warning, and public response challenges. Yet, respondents in the western part of the state overestimated tornado occurrence at night while those in the east substantially underestimated the number.
Additionally, nearly half of participants in the survey say they rely on sirens to receive tornado warnings. This is despite the fact that sirens are not designed to warn people inside nor be loud enough to wake anyone up. Instead, Wireless Emergency Alerts (WEAs) “should be a constant,” the authors say. Also, people mentioned they rely on TV and social media for receiving warnings even though generally neither will wake you up.
The authors felt it was “dangerous” that even the more tech savvy and tornado aware respondents answered they were compelled to look outside for evidence of a tornado—even in the dark. Interviewees explained they were “checking for sounds instead of visual cues.”
NWS forecasters were also surveyed about nocturnal tornadoes. The forecasters mentioned the lack of ground truth and fear for public safety among challenges to the nighttime warning service. They noted few spotter or social media reports inform them if “the storm is actually showing the signs on the grounds that radar is indicating aloft.” Forecasters said they felt “fearful, worried, or nervous for the public during nocturnal tornadoes because fatalities ‘are a given.’”
The survey responses moved Ellis et al. to recommend a single-emphasis message be presented to residents to combat the nighttime tornado problem:
One strategy that may improve public safety during a nocturnal tornado event, and which addresses the forecaster challenge of communication prior to and during an event, is to develop “One Message”—a consistent message that EMs and the media use throughout broadcasts, briefings, and social media. Examples of messages could be: “Nighttime tornadoes expected. Sleep with your phone ON tonight!” or “Tornadoes will form quickly! Make plans now where you will take shelter!” or “If you live in a manufactured home, you may not have much time to seek shelter tonight!” One Message may decrease confusion for receivers, making them more likely to make safe decisions. Messages could similarly be used to dispel misconceptions about local geography in ways relevant to the specific listening area, for example: “You are not protected by nearby hills. Seek shelter immediately!”
With Hurricane Delta’s nighttime tornado threat ramping up, the authors suggest people use multiple ways to receive warnings, keeps phones on and charged, don’t rely on tornado sirens, and if possible relocate ahead of the weather from “particularly vulnerable” situations, such as mobile homes and vehicles.
COVID-19 has upended air travel for now, but if the growth in global aviation resumes, one real drag on flying is going to be increasing energy needs due to global warming. New research published in the Bulletin of the American Meteorological Society by Diandong Ren (Curtin University, Perth) et al. shows that Earth’s warming climate is going to have an often overlooked—but costly—impact on the fuel consumption of airplanes. The reason: increased viscosity, or “stickiness,” of the air.
For starters, a warming atmosphere will expand and become less dense, reducing the lift produced by aircraft wings, which means planes must increase speed and burn more fuel to maintain carrying capacity. This disadvantage counteracts any fuel advantages of flying in thinner (less resistant) air. There are other small effects on engine efficiency. In all, there is some ambiguity about the direct effect of the warming atmosphere on fuel needs at cruising altitudes. But Ren et al. point to a much larger fuel impact due to increasing atmospheric viscosity.
In a warmer world, more water can evaporate into the air. The extra molecules of water increase the drag on aircraft and that in turn will cause planes to fight harder to cruise through the air, requiring additional fuel. The increasing drag turns out to be the dominant issue—and could become very expensive.
Ren et al. use an ensemble of 34 climate models to project that aviation fuel requirements by the end of the century could be an extra 160 million gallons per year due to viscosity, approaching an extra $1 billion per year in costs more than today in a scenario in which fossil fuel use is basically unabated.
The findings take account of regional and altitudinal variations in warming for different projections based on different amounts of emissions predicted. They also take into account the most trafficked flight paths, based on recent airline data. For example, some high altitude cooling at high latitudes would mitigate the effects of drag in near-polar routes, but few jets fly these paths. Flights at mid- to low-latitudes experience the biggest increases in drag—less than 2% per century, but enough to have consequences in fuel usage. Overall, an air viscosity increase leads to about a 0.22% increase in fuel consumption by the year 2100 over 2010.
While these costs are still a small fraction of the total aviation fuel usage, they are yet another incentive for the industry to mitigate global warming through emissions reductions, as well as to pursue adaptations and efficiencies in aviation technology.
After a veritable flurry of storms in the Atlantic since August, the basin has gone quiet following the landfalls of Tropical Storm Beta in Texas, and Post-Tropical Storm Teddy in Nova Scotia. But late-season storms are quite common in the Atlantic, and as this hyperactive hurricane season combines with confirmed La Niña conditions, this year it seems almost like an expectation. And that means people on the coast need to stay alert to what’s going on in the atmosphere, but it also means there’s still promise for additional hurricane research this year.
Recent Octobers have seen a couple of very intense and even catastrophic hurricanes develop and make landfall. The last big one was Hurricane Michael, which slammed the Florida Panhandle in 2018. In 2016, Hurricane Matthew roared to life in the Caribbean, reaching Category 5 intensity on the Saffir-Simpson scale before crashing into Hispaniola as a Cat. 4, and then menacing the Florida coast for days and eventually swirling into the Carolinas.
Matthew turned out to be a late-season success for NOAA’s Sensing Hazards with Operational Unmanned Technology (SHOUT) project. SHOUT evaluated the ability of observations taken by the high-altitude, unmanned Global Hawk aircraft to improve forecasts of high-impact weather events, which are “one of the most critically needed capabilities of weather services around the world,” write lead author Gary Wick and his colleagues in their article on SHOUT in the Bulletin of the American Meteorological Society.
NASA’s Global Hawk flew 15 missions sampling Hurricane Matthew and 5 other tropical cyclones as well as 3 winter storms in 2015 and 2016. Instrumented with GPS dropwindsondes and remote sensors, Global Hawk’s data were examined in real time by forecasters, assimilated in operational weather prediction models, and applied to data impact studies, demonstrating positive results.
BAMS asked Wick a few questions about his work and SHOUT in particular (for the full answers, see the print or digital edition of the magazine):
BAMS: What would you like readers to learn from your article?
Gary Wick: The primary message we would like to convey is that Global Hawk can provide highly useful observations of high-impact weather events that would be very difficult to obtain with any other
existing aircraft or observing system. It was possible to consistently see the potential for forecast benefit across a wide range of models.
BAMS: How did you get into this focus on improving operational hurricane forecasts with unmanned aircraft?
GW: I was fortunate to have participated in both the NASA-led Genesis and Rapid Intensification (GRIP) and Hurricane and Severe Storm Sentinel (HS3) campaigns and was able to observe the potential application of the Global Hawk to tropical cyclone research. The distinct goals of those campaigns, however, didn’t allow for a real focus on the operational hurricane forecasting problem. We in the NOAA UAS Program were extremely excited when support from the Disaster Relief Act of 2013 gave us the opportunity to conduct a dedicated campaign to examine the impact of observations from the Global Hawk on forecasts of high-impact weather.
BAMS: What got you initially interested in meteorology?
GW: My path to this project was really quite indirect. My interests growing up really centered around planes, due in part to living close to the old Denver airport. As a kid, I would frequently ride my bicycle out to the end of the runway and watch planes take off and land. These interests led me to study Aerospace Engineering as an undergraduate where I just happened to take a class one year in environmental aerodynamics taught by a scientist from a predecessor of my current NOAA laboratory. This class introduced me to remote sensing and I ended up pursuing graduate studies centered primarily around satellite-based remote sensing. The work with UAS in general and this project in particular allowed me to come full circle, in a sense, combining my many interests in aircraft, remote sensing, and weather.
BAMS: What surprised you the most in the SHOUT project?
GW: As someone whose personal work hadn’t centered around atmospheric models, assimilation, and weather forecasting, it was surprising to me early on how providing weather models with more, high quality, direct observations wouldn’t necessarily improve the resulting forecasts and, in some cases, could actually degrade them. One might naively think that better data could only lead to a better final product. After gaining an appreciation of how challenging it is to achieve meaningful forecast improvements through addition of any data to our current observing and assimilation systems, I was
very pleasantly surprised that it does appear that the highly unique observations enabled by the Global Hawk still have the potential to help us improve our forecasts of high-impact weather events.
BAMS: What was the biggest challenge you encountered in the experiment?
GW: As with seemingly any field project, our biggest challenge was probably obtaining the weather events we were hoping to study during the necessarily limited duration of the campaign. Through the multiple years of the GRIP, HS3, and SHOUT campaigns, the Global Hawk developed almost a reputation as a “hurricane repellent” due to the limited number of storms during the experimental periods. Perhaps the most interesting storm sampled during the SHOUT campaign, Hurricane Matthew in 2016, actually occurred after the scheduled end of the experiment. Fortunately, we were able to extend the campaign and collect some very valuable additional observations.
BAMS: What’s next? How will you follow up?
GW: Several additional studies are underway to better evaluate the impact of all the different observations collected in different and the most recent models. NOAA is still working to evaluate and increase the number of UAS observations (particularly from smaller platforms) to help conduct our mission.
Hurricane Sally is inching ashore in southeast Alabama Wednesday morning and has started to flood parts of the central Gulf Coast with an expected 1-2 feet of rain, maybe more. With that much rain forecast, it seems likely to join other recent catastrophic flood disasters Harvey (2017) and Florence (2018) in ushering in a new era of rainier storms at landfall that bring with them an extreme rain and flooding threat.
And with more wetter storms on the way, better communication about these potentially deadly impacts from copious rainfall is needed. Another BAMS article we blogged about addressed this by creating an Intuitive Metric for Deadly Tropical Cyclone Rains. Its authors designed the new tool—the extreme rainfall multiplier (ERM)—to easily understand the magnitude of life-threatening extreme rain events.
Co-author James Kossin explained to BAMS:
Water presents a much greater hazard in a hurricane than wind does, but the Saffir-Simpson categories are based on wind-speed alone. Salt-water hazards along and near the coast are caused by storm surge. Coastal residents are warned about these hazards and are provided with evacuation plans. Fresh-water flooding from extreme hurricane rainfall, however, can happen inland away from evacuation zones, and pose the greatest threat to life and property in these areas where people tend to shelter-in-place. Compound hazards such as dam failures and land-slides in mountainous regions pose additional significant threats. In this case, effective warnings and communication of the threats to inland populations is paramount to reduce mortality. This work strives to present a tool for providing warnings based on people’s past experience, which gives them a familiar reference point from which to assess their risk and make informed decisions.
Lead author Christopher Bosma:
We started out this project focused on analyzing the catastrophic and record-breaking rainfall associated with Hurricane Harvey. But, as we started to finish our analysis of that system, just a year later, Hurricane Florence brought devastating and torrential rainfall to the Carolinas, which forced us to go back and revisit some of our initial analysis. The fact that multiple major storms happened in quick succession grabbed a lot of headlines, but, from a research and scientific perspective, it also provided a chance to note how the messaging used to describe these systems had changed (or not) and think of other ways to use the metric we had developed.
ERM is not yet operational, but that is the researchers’ goal, to “convey effective warnings to people about fresh-water flooding threats,” Kossin says.
Hurricane Sally is one such extreme rainfall flood threat, with “significant to historic flooding” likely, the National Weather Service says.
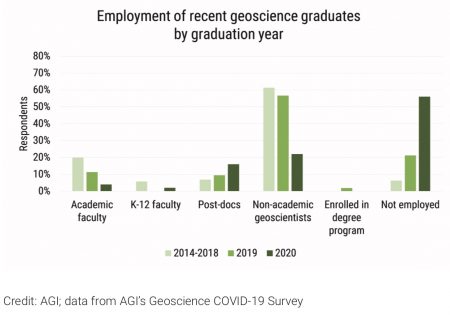
A new survey by the American Geosciences Institute shows that recent graduates in the geosciences are finding employment at the same rates as before the COVID-19 pandemic, but a separate survey from Nature finds that amid tightening funding science postdocs are nervous about ongoing research as well as career opportunities.
The AGI survey covered graduates from the classes of 2018, 2019, and 2020, and found no “deviation from long-term employment trends of recent geoscience graduates.”
As of August 2020, 94% of geoscience graduates who earned their degree between 2014-2018 were employed, while 77% of graduates from 2019 and 44% of graduates from 2020 reported the same. For geoscience graduates who earned their degree this year, 16% of bachelor’s, 57% of master’s, and 91% of doctorates have secured employment.
For comparison, data from the 2013-2018 AGI Geoscience Exit Survey shows that 20% of geoscience graduates secured employment by the time they graduated. This data varied by degree level, with 12% of bachelor’s, 36% of master’s, and 56% of doctorates securing employment by the time they graduated. Only 1% of employed recent geoscience graduates lost their job since February 2020.
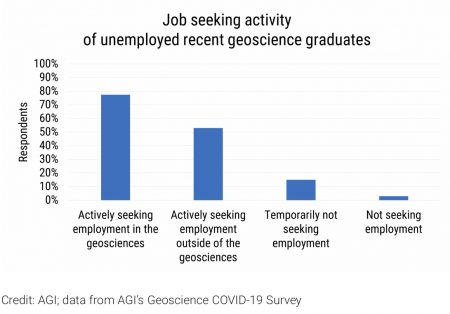
While three-quarters of the still-unemployed graduates of the last three classes were still looking for jobs in the geosciences, half said they were instead, or additionally, now seeking employment outside the field. Of those seeking employment outside the field, more than 80% said this was due to lack of jobs in the geosciences, and about three-quarters felt they did not have sufficient training for the available jobs.
The AGI employment statistics are provided by geoscience graduate job seekers, part of a series AGI is publishing on the effects of the pandemic in the geosciences. The Nature survey, by contrast, sampled views of postdocs worldwide and “paints a gloomy picture of job-loss fears, interrupted research, and anxiety about the future.” It finds that:
Eight out of ten postdoctoral researchers say that the global coronavirus pandemic has hampered their ability to conduct experiments or collect data. More than half are finding it harder to discuss their research ideas or share their work with their laboratory head or colleagues, and nearly two-thirds believe that the pandemic has negatively affected their career prospects.
The pandemic has shuttered or reduced the output of academic labs globally, slashed institutional budgets and threatened the availability of grants, fellowships and other postdoctoral funding sources. The fallout adds up to a major challenge for a group of junior researchers who were already grappling with limited funds, intense job competition and career uncertainties.
The Nature survey drew responses from 7,670 postdocs working in academia from mid-June through the end of July. Some respondents were selected for follow-up interviews, which “filled in an unsettled, precarious picture of postdoctoral research in the era of coronavirus.”
“The [pandemic] has compounded the pressures that postdocs were already under,” reported one of the interviewees, Hannah Wardill, a cancer researcher at the South Australian Health and Medical Research Institute in Adelaide.
Derechos are less common than Midwestern tornadoes, but occur almost every year in that region as well as other parts of the United States. Yet they remain exotic and mystifying. Even to meteorologists.
The reason appears to lie in the complex way the long-lived windstorms form. Derechos are often incorrectly referred to as inland hurricanes; their damaging winds can reach hurricane force, but they are straight-line in nature, rather than circulating around a common center. When people suffer, though, they can be forgiven for using the wrong windstorm term. By definition derechos have to meet specific criteria, such as causing damage continuously or intermittently in a lengthy line of at least 400 miles that’s at least 60 miles wide. But just like hurricanes, they come in a variety of intensities.
Last week’s derecho, roaring 750 miles from eastern Nebraska across Iowa, Illinois and Indiana, was particularly ferocious with winds in multiple swaths across Iowa gusting to over 100 mph. The National Weather Service found damage to an apartment complex in Cedar Rapids, Iowa, consistent with wind gusts of an astonishing 130-140 mph. But even these extreme winds and the severe damage they wrought don’t tell the whole story of the variation in these windy storms with the seemingly odd name.
The AMS Glossary of Meteorology states: “The term derecho derives from a Spanish word that can be interpreted as “straight ahead” or “direct” and was chosen to discriminate between wind damage caused by tornadoes, which have rotating flow, from straight-line winds.” It defines derechos as widespread convectively induced straight-line windstorms.
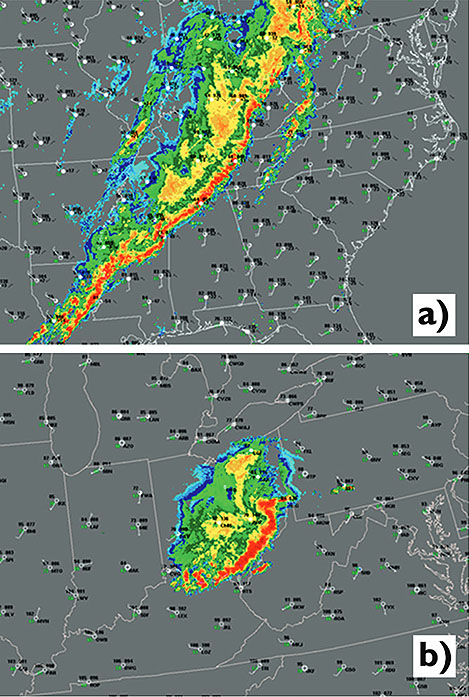
Two Very Different Derechos: Base reflectivity composite radar data for (a) 2056 UTC 4 Apr 2011 and (b) 2234 UTC 29 Jun 2012, with surface observations plotted using conventional station plot format. Convective system in (a) is composed of a series of loosely connected, largely linear bands with low-amplitude LEWPs, whereas that in (b) consists of a single, intense arc of storms with a well-defined bow echo. Animated radar and satellite imagery for these events may be viewed at http://spc.noaa.gov/misc/AbtDerechos/casepages/apr042011page.htm and http://spc.noaa.gov/misc/AbtDerechos/casepages/jun292012page.htm.
This updated definition was the work of a team of meteorologists about five years ago who compared different straight-line windstorms—all meeting the damage criteria of derechos at the time but clearly having different mechanisms driving them. Their published paper in the Bulletin of the American Meteorological Society was “A Proposed Revision to the Definition of ‘Derecho’.” With it, the authors made the case to improve the definition of derecho to make it more physically based and more closely mirror other definable meteorological terms such as tornadoes, extratropical cyclones, and cirrus clouds.
While the paper had a positive effect among the meteorological community, a web search still turns up different definitions of derecho among meteorological websites, including within the NWS.
We asked the lead author of the BAMS paper, Stephen Corfidi (NOAA NWS, CIMMS, University of Oklahoma), for his thoughts on last week’s Midwestern derecho, to put it in perspective and also to help explain the reasons behind the difficulty with meteorologists not only defining but using the meteorological term differently.
BAMS: Was last week’s Midwest fast-moving line of severe thunderstorms with damaging winds a derecho? If so, did it fit the Glossary definition of a derecho?
Stephen Corfidi: Last Tuesday’s Midwest wind storm met the AMS Glossary definition of a derecho. Most significantly, it satisfied the criterion for the presence of “one or more sustained bow echoes with mesoscale vortices and/or rear-inflow jets.” A large mesoscale vortex, located on the north end of the larger-scale bow-shaped convective system from central Iowa to Lake Michigan, appears to have been associated with some of the strongest and longest-duration surface winds that accompanied the event. While the swath of organized damaging winds was not particularly long (on the order of 500 miles (800 km)) in comparison to some past events, the length well exceeded the somewhat flexible 400-mile (~ 650 km) cut-off used to distinguish derecho storms.
BAMS: Among derechos, how does this one rank?
SC: The Iowa-Illinois storm is certainly one of the most memorable of 2020—a year that already has seen other noteworthy events (e.g., those in Colorado, the Dakotas, and Pennsylvania in June). What made the Iowa-Illinois event especially noteworthy was the sizable number of reliably-observed significant surface gusts. There were numerous reports in excess of 80 mph (35 meters/second), and incidental evidence that some locations experienced speeds greater than 100 mph (45 m/s). The strong winds—likely enhanced by the presence of the mesoscale vortex—in some places persisted for more than 30 minutes. The vortex to some extent resembled the “warm-core” (hurricane-like) circulation that formed within the Kansas-Missouri-Illinois derecho of 8 May 2009.
BAMS: What made this one stand out?
SC: The duration of the storm’s high winds over eastern Iowa and western Illinois—again, likely due in part to the presence of the large mesoscale vortex—was certainly outstanding. This is quite a statement considering that the event occurred in a region known for its propensity for derechos (Recall that Gustave Hinrich’s nineteenth century studies of straight-line wind events were based in Iowa).
BAMS: Why are derechos so perplexing and difficult for meteorologists to acceptably define?
SC: There are several reasons why derechos are not only difficult to define, but also challenging to forecast. Unlike supercell thunderstorms that, in most cases, are well-delimited in time and space, broad swaths of damaging convective winds can arise in many different ways. Some of the processes involved in derecho development remain poorly understood and / or are only partly resolved by current observational platforms.
More significantly, unlike weather phenomena like supercells, derechos may or may not be accompanied by meteorological structures that readily are apparent to human observers. For example, most meteorologists recognize a supercell when one appears in the sky. But specific cloud formations are not associated with derechos, and the characteristic meteorological structures that do accompany many derechos (e.g., embedded vortices and rear-inflow jets) are too large or subtle to be recognized by human observers without the aid of remote-sensing devices such as radar and satellite.
These same aspects make derechos difficult to forecast. One can say that derechos arise when a unique combination of known and unknown necessary ingredients is present over a sufficiently broad area to support rapid, repetitive, downshear thunderstorm development. That said, applying this concept in practice presents a formidable challenge. In some cases, the known ingredients are present, but the extent of the favorable environment is too limited for derecho status to be realized. Conversely, expansive environments sometimes appear that are supportive of widespread destructive winds, but not those strongly dependent on the smaller-scale processes associated with rear-inflow jets and mesoscale vortices.
As with any weather forecast, when “missed” derecho events occur, the root causes can be traced to the existence of too many unknowns—both observational and theoretical. In the case of derechos, both unknowns, at present, remain sizable.
BAMS: What has been the impact of your 2016 BAMS paper and proposed new definition?
SC: It does appear that the updated definition proposed in the paper has been adopted to at least some extent in the severe weather community; the updated definition in the AMS’ Glossary likely abetted the effort. There is, of course, no “official” arbiter of general meteorological terms. This explains, in part, the range of derecho “definitions” that appear in some sources. The lack of consistency in the use of the term “derecho” was, in fact, a motivating factor in drafting the paper. We’d like to think that the paper focused needed attention on the value of increased precision in meteorological terminology, but that is not something that is easy to measure. It is probably safe to say that the definition of “derecho” will continue to change as the underlying processes responsible for the most intense storms become better understood.
BAMS: What would you like readers of your 2016 paper to learn about and from the re-defining of derecho?
SC: I think perhaps the most important take-aways are that (1) the existing definition was outdated because of the significant changes that have occurred in observational data, record-keeping, and understanding since the mid-1980s, and (2) that if we are to better understand and forecast high-wind-producing convective systems, we need to first better classify those systems that are observed.
BAMS: You and your colleagues at NOAA-NWS-NCEP put together a comprehensive and impressive website About Derechos. How did you become interested in them?
SC: Convective systems, in general, are interesting because there are so many “moving parts” involved in their development, sustenance, and motion. It is especially challenging—but also rewarding—to try to assess the strength and likely longevity of those processes in real-time so as to prepare useful forecasts. Derechos are high-impact events; they are one area where society would benefit greatly from increased meteorological knowledge.
BAMS: What was the biggest challenge you encountered in your work to update the derecho definition?
SC: Having thoughts on introducing any new idea is one thing, but putting those concepts into words is another. Unlike most other papers in our “business,” in this one I felt we had to be somewhat persuasive. I was not at first comfortable with taking such an approach. But the contrasts presented by the two derecho events introduced in the first part of the paper furthered my conviction that persuasion was needed to both defend and encourage discussion on the definition topic.
BAMS: What got you initially interested in meteorology?
SC: My interest in clouds and storms goes back to my earliest days as a young kid growing up in a house kept super-clean by my mom. Because I was forbidden to play in the yard when the grass was wet (I’d track dirt into the house, of course!), I soon came to appreciate “Mr. Sun.” In particular, I noticed that I’d often not see the sun the next day if certain cloud formations had appeared in the sky on the previous one. A bit later, in first grade, my dad introduced me to weather books in the local library. Some had cloud pictures indicating which formations were “bad,” and which were associated with good weather. I was hooked! Thunderstorm days were always a favorite because the clouds on such days seemed to change the most rapidly—and provided the most surprises. I was very interested in things like rocks and plants, too—but weather was always #1.
 A little more than two weeks ago, Supertyphoon Goni blasted ashore in the Philippines with top sustained winds of 195 mph, becoming the strongest landfalling tropical cyclone on record. It topped STY Haiyan’s 190 mph land strike just seven years ago. With Hurricane Iota in the Caribbean explosively intensifying 100 mph in under 24 hours to reach Category 5 intensity Monday, it set a new record of five consecutive years of Cat 5 hurricanes in the North Atlantic tropical cyclone basin. Among the seven catastrophic hurricanes, starting with Matthew in 2016, were Dorian and Irma, packing 185 mph and 180 mph steady winds, respectively, with peak gusts well over 200 mph.
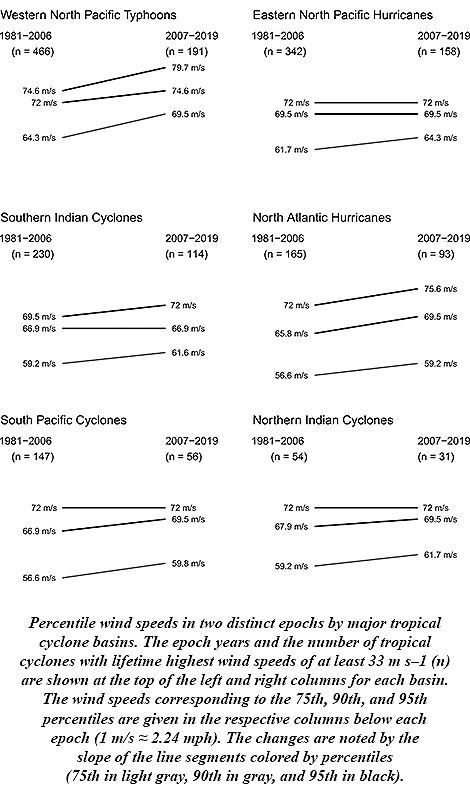 James Elsner of Florida State University says this is to be expected. His research stated in 2008 that there was an upward trend in the intensity of the most intense tropical cyclones. Rising ocean temperatures, as theory predicted, were driving the trend. And with oceans continuing to warm along with Earth’s climate since then, Elsner anticipated the continuing upward trend.
 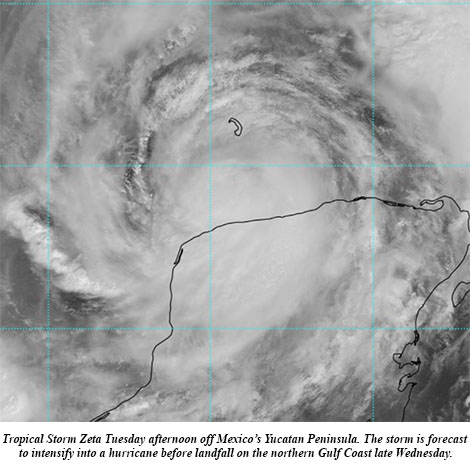 Zeta blossomed into the 11th hurricane of this hyperactive season Monday and its forecast track takes it ashore on the Gulf Coast by midweek. The National Hurricane Center (NHC) on Monday said computer models had become more tightly clustered with the forecast in the Gulf, “resulting in an increase in track-forecast confidence,” and Hurricane Zeta is expected to become the United States’ record 11th storm landfall in a single season.
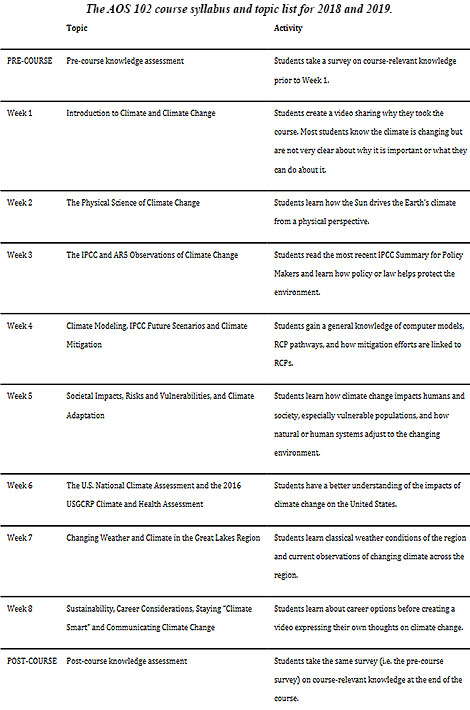
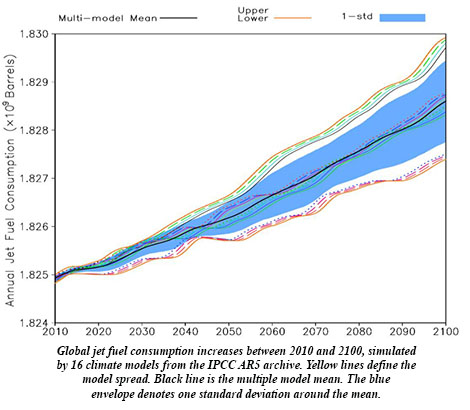 Ren et al. use an ensemble of 34 climate models to project that aviation fuel requirements by the end of the century could be an extra 160 million gallons per year due to viscosity, approaching an extra $1 billion per year in costs more than today in a scenario in which fossil fuel use is basically unabated.
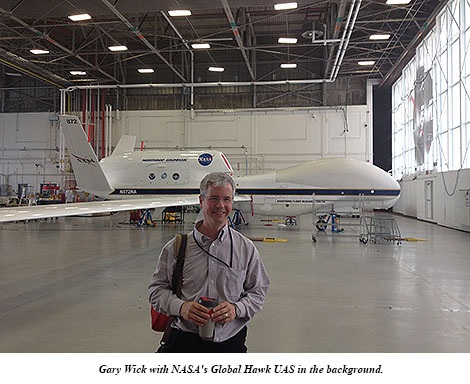 BAMS: How did you get into this focus on improving operational hurricane forecasts with unmanned aircraft?
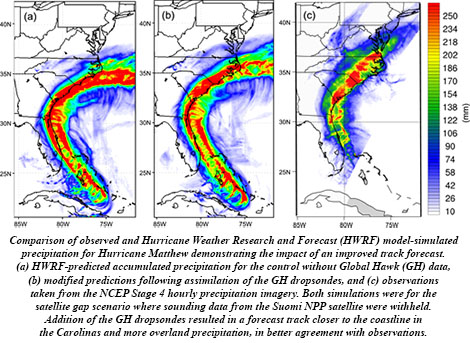 BAMS: What’s next? How will you follow up?
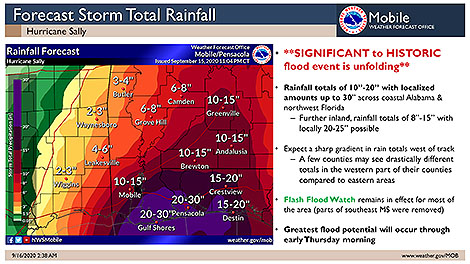
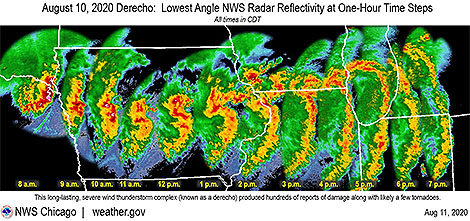 Last week’s derecho, roaring 750 miles from eastern Nebraska across Iowa, Illinois and Indiana, was particularly ferocious with winds in multiple swaths across Iowa gusting to over 100 mph. The National Weather Service found damage to an apartment complex in Cedar Rapids, Iowa, consistent with wind gusts of an astonishing 130-140 mph. But even these extreme winds and the severe damage they wrought don’t tell the whole story of the variation in these windy storms with the seemingly odd name.
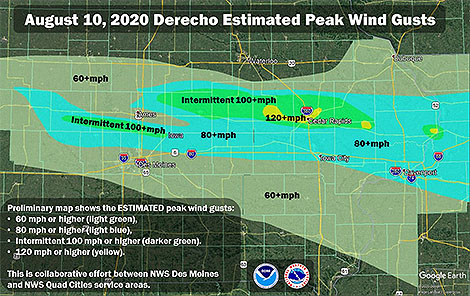 The AMS