A research spotlight from the 36th Conference on Hurricanes and Tropical Meteorology
NOAA’s WP-3D Orion “Hurricane Hunter” aircraft are no strangers to turbulence. Reconnaissance flights through hurricanes are by definition a tad bumpy.
A viral video taken aboard the Hurricane Hunter “Kermit” (NOAA42) as it flew through Hurricane Ian on 28 September, 2022, however, shows that even its experienced crew were shaken.
In the video, equipment is shown having fallen to the floor of the aircraft (“There goes the sondes!”), and after a camera-shaking bump, the crew can be heard reassuring each other, “We’re alright.”
“I’ve been flying hurricanes with NOAA for the last six years, and that was the worst flight that I’ve been on so far,” NOAA Programs and Integration Engineer Nick Underwood (who filmed the video) told MSNBC the next day. “We were coming through the western side of Hurricane Ian, it was intensifying up to its peak Category 4 strength, and we really got bounced around.”
As it turns out, the flight may have been the most turbulent ever on a Hurricane Hunter aircraft, at least in the past 20 years. In a study presented by Joshua Wadler of Embry-Riddle Aeronautical University at the 36th Conference on Hurricanes and Tropical Meteorology, researchers came up with new metrics to better quantify turbulence as experienced by an aircraft’s occupants—and ranked the top ten flights in Hurricane Hunter history.
“It was probably about ten minutes of really extreme turbulence,” said Wadler in his presentation during the “Innovative Observing Technologies to Advance Tropical Cyclone Operations and Research VI” session. As part of the flight crew, Wadler was on the team in charge of the Altius-600 small uncrewed aircraft system’s first-ever deployment into a hurricane.
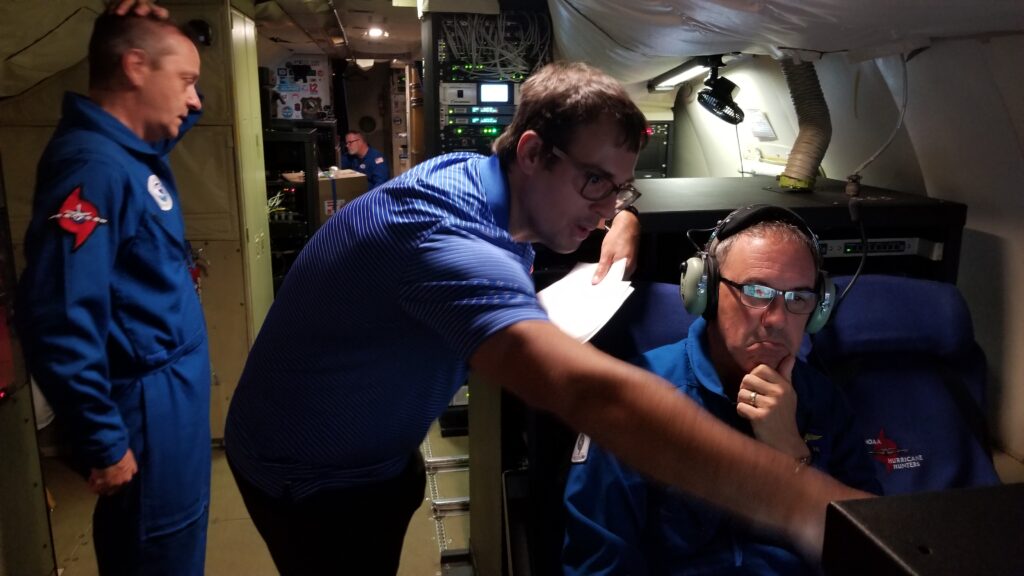
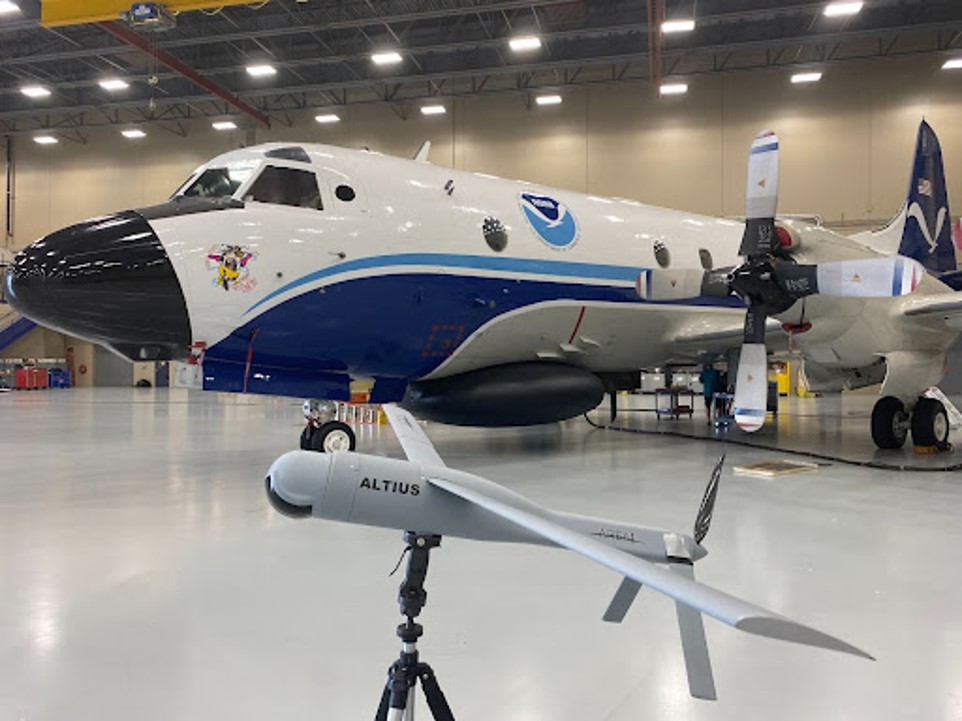
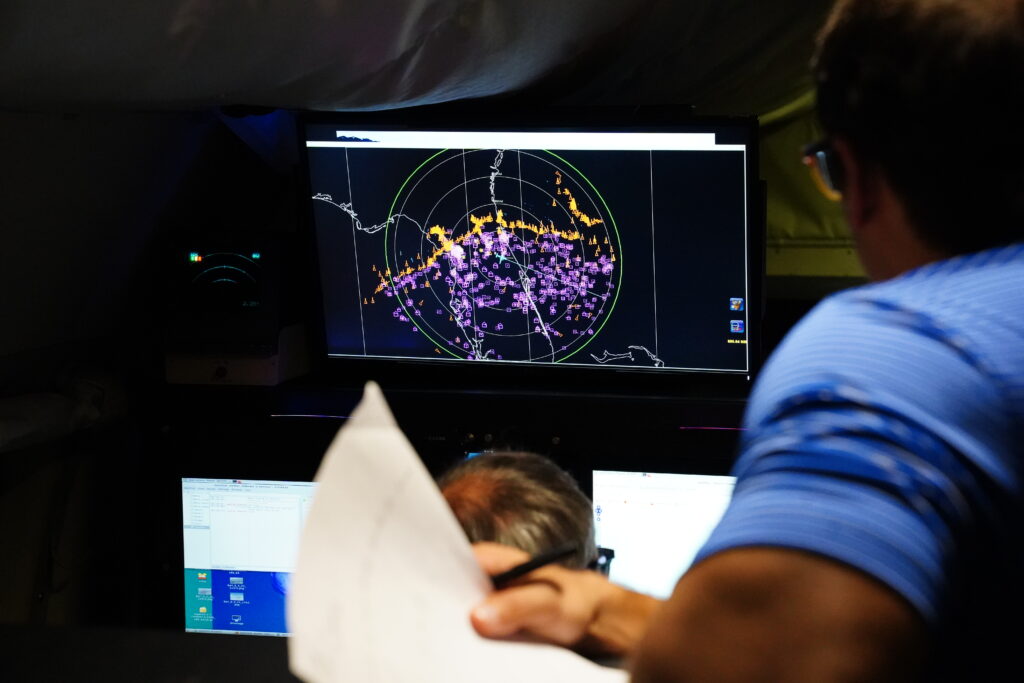
“We were talking on the mission and we [thought], well, is this the bumpiest flight ever?” Wadler said. A few of the crew who had been flying such missions for decades seemed to think so. “We were like, okay, let’s try to figure it out.”
A bumpiness equation
Aside from corroborating hurricane researchers’ harrowing tales, understanding turbulence is becoming increasingly important given its predicted increase due to climate change, and with recent incidents including the death of a passenger during an exceptionally turbulent Singapore Airlines flight. Metrics for turbulence already exist, but most of those only represent vertical motion and focus on atmospheric properties rather than what happens to occupants. “We wanted … to have a 3-D turbulence metric, and one that describes the human experience,” said Wadler.
When an aircraft rapidly accelerates vertically or horizontally, everyone feels the dizzying rise or stomach-clenching drop. But if the aircraft rotates around its center of gravity in any direction, that acceleration will have different effects depending on where someone is seated–for example, when the aircraft tilts (or pitches) upward the people in the front of the aircraft will feel an upward acceleration while the people in the back will feel a downward acceleration. If the plane is also accelerating upwards, such as during takeoff, those in the front will experience a “double whammy” of acceleration. As Wadler noted, “Every seat on the plane experiences different rotational motions depending on where you are.”
Wadler and colleagues’ new “bumpiness” metric accounts for those differences.
The research team combined flight-level data from all P-3 flights since 2004 (when high-enough-quality data became available). They calculated the acceleration forces acting on each seat in the plane relative to the plane’s center of gravity.
They defined the flight’s “bumpiness” by combining acceleration with jerk (the rate of change in acceleration over time), accounting for both in all three dimensions. This equation can be applied to any aircraft where the center of gravity and relative positions of the seats are known, and for which high-quality flight-level data are available.

Their equation accounts equally for bumpiness in all directions, although it can be thrown off by sharp turns. Missions in which the plane turned sharply on purpose (for example, to calibrate instruments) were excluded from the team’s calculations.
Because the end result, the B or bumpiness value, values all dimensions of movement equally, it doesn’t always sync with what people expect. Some Twitter commenters belittled the video from the flight, possibly because it shows few large up-and-down bumps. The main types of motion experienced by the mission’s crew, however, were front-to-back and side-to-side.
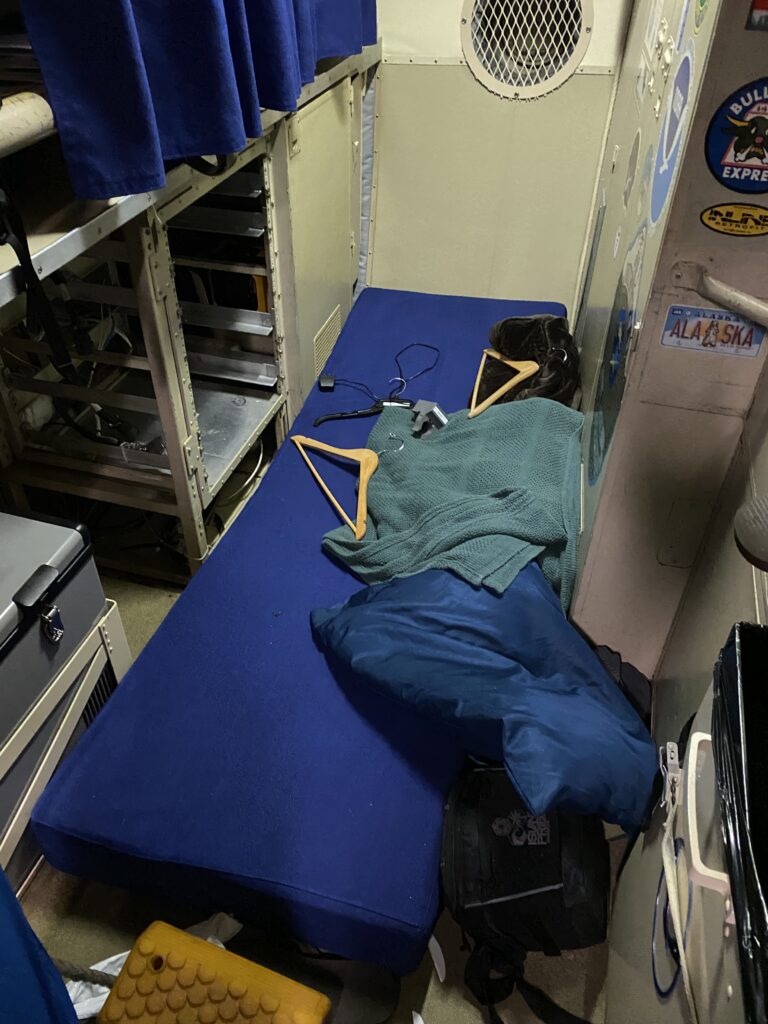
<< The off-duty pilot’s bed was thrown from its bunk onto the floor during flight 20220928H1 into Hurricane Ian, due to lateral motion of the aircraft. Photo courtesy of Jake Barlow.
The bumpiest hurricane flights
The researchers calculated the top 10 bumpiest flights for each of the seats on the plane, based on the most turbulent part of each mission.
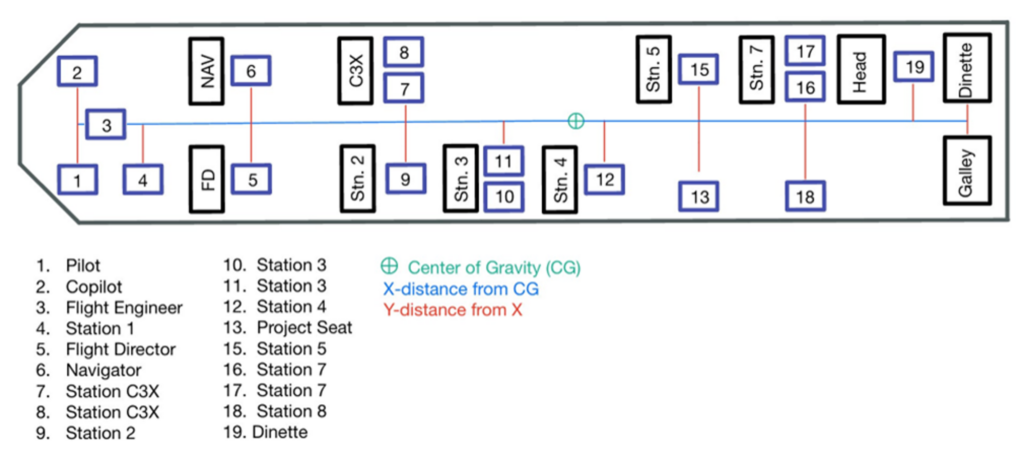
For the person in seat 1 (the “pilot flying,” in the front left seat on the plane), the Hurricane Ian flight was in fact the bumpiest by far—with a B value of 6.04 m/s2, 34% bumpier than any other flight for which good data were available. The second highest B value was experienced during Hurricane Irma in 2017 (B value: 4.5 m/s2), the third by a flight into Hurricane Sam in 2021 (B value: 4.39 m/s2). Subjective rankings from surveyed flight crews came up with a wide range of answers about their bumpiest flights, but were roughly in the same ballpark as those calculated by B value.
| Rank | Storm Name | Mission ID | Maximum Bumpiness Value (m/s2) |
| 1 | IAN | 20220928H1 | 6.04 |
| 2 | IRMA | 20170908H2 | 4.50 |
| 3 | SAM | 20210929H2 | 4.39 |
| 4 | LANE(EP) | 20180822H1 | 4.28 |
| 5 | FELIX | 20070902H1 | 4.27 |
| 6 | DORIAN | 20190830H2 | 4.08 |
| 7 | PATRICIA(EP) | 20151023I1 | 4.05 |
| 8 | RAFAEL | 20121015H1 | 4.02 |
| 9 | GONZALO | 20141017I1 | 3.90 |
| 10 | DORIAN | 20190904H1 | 3.70 |
On the Hurricane Ian mission, the greatest B value (6.13 m/s2) was experienced by the second pilot, sitting in seat 2. Wadler was in seat 10. “I was very fearful during this mission,” he noted during his presentation. But, “lo and behold, my seat had the lowest [bumpiness] value by far.” The pilot in seat 1 experienced 37% worse turbulence than Wadler’s seat in the middle of the plane (6.04 m/s2 vs. 4.4 m/s2).
| Seat | max Bumpiness (m/s2) |
| 1 | 6.04 |
| 2 | 6.13 |
| 3 | 6.02 |
| 4 | 5.87 |
| 5 | 5.52 |
| 6 | 5.68 |
| 7 | 5.03 |
| 8 | 5.08 |
| 9 | 4.79 |
| 10 | 4.4 |
| 11 | 4.46 |
| 12 | 4.45 |
| 13 | 4.54 |
| 14 | 4.52 |
| 15 | 4.45 |
| 16 | 4.53 |
| 17 | 4.51 |
| 18 | 4.59 |
| 19 | 4.55 |
For seat 1, the Ian flight (Flight 20220928H1) ranked above all other flights for back-front and lateral motion. Yet in terms of up-down motion, a mission during Hurricane Lane ranked far higher, with a vertical B value of 17.1; Ian’s highest vertical B value was 8.43, ranking it seventh in terms of vertical motion. When all metrics are combined, however, the Ian flight came out on top. “It’s normal to have vertical bumps with eyewall updrafts and downdrafts,” Wadler noted in a later conversation, “but the lateral motions are rare. … The dropsondes went all over the cabin.”
Currently the bumpiness rankings only count the highest B value experienced during a flight. In future work, the research team aims to develop an equation that can account for cumulative bumpiness over time—a “queasiness index.” We’re well on the way to finding out what flights would make even the most iron-stomached hurricane hunter, in Wadler’s words, “very happy to be on the ground.”
Want to know more about what it’s like to fly a research mission into a hurricane? Take a virtual tour of a Hurricane Hunter aircraft “Miss Piggy.”
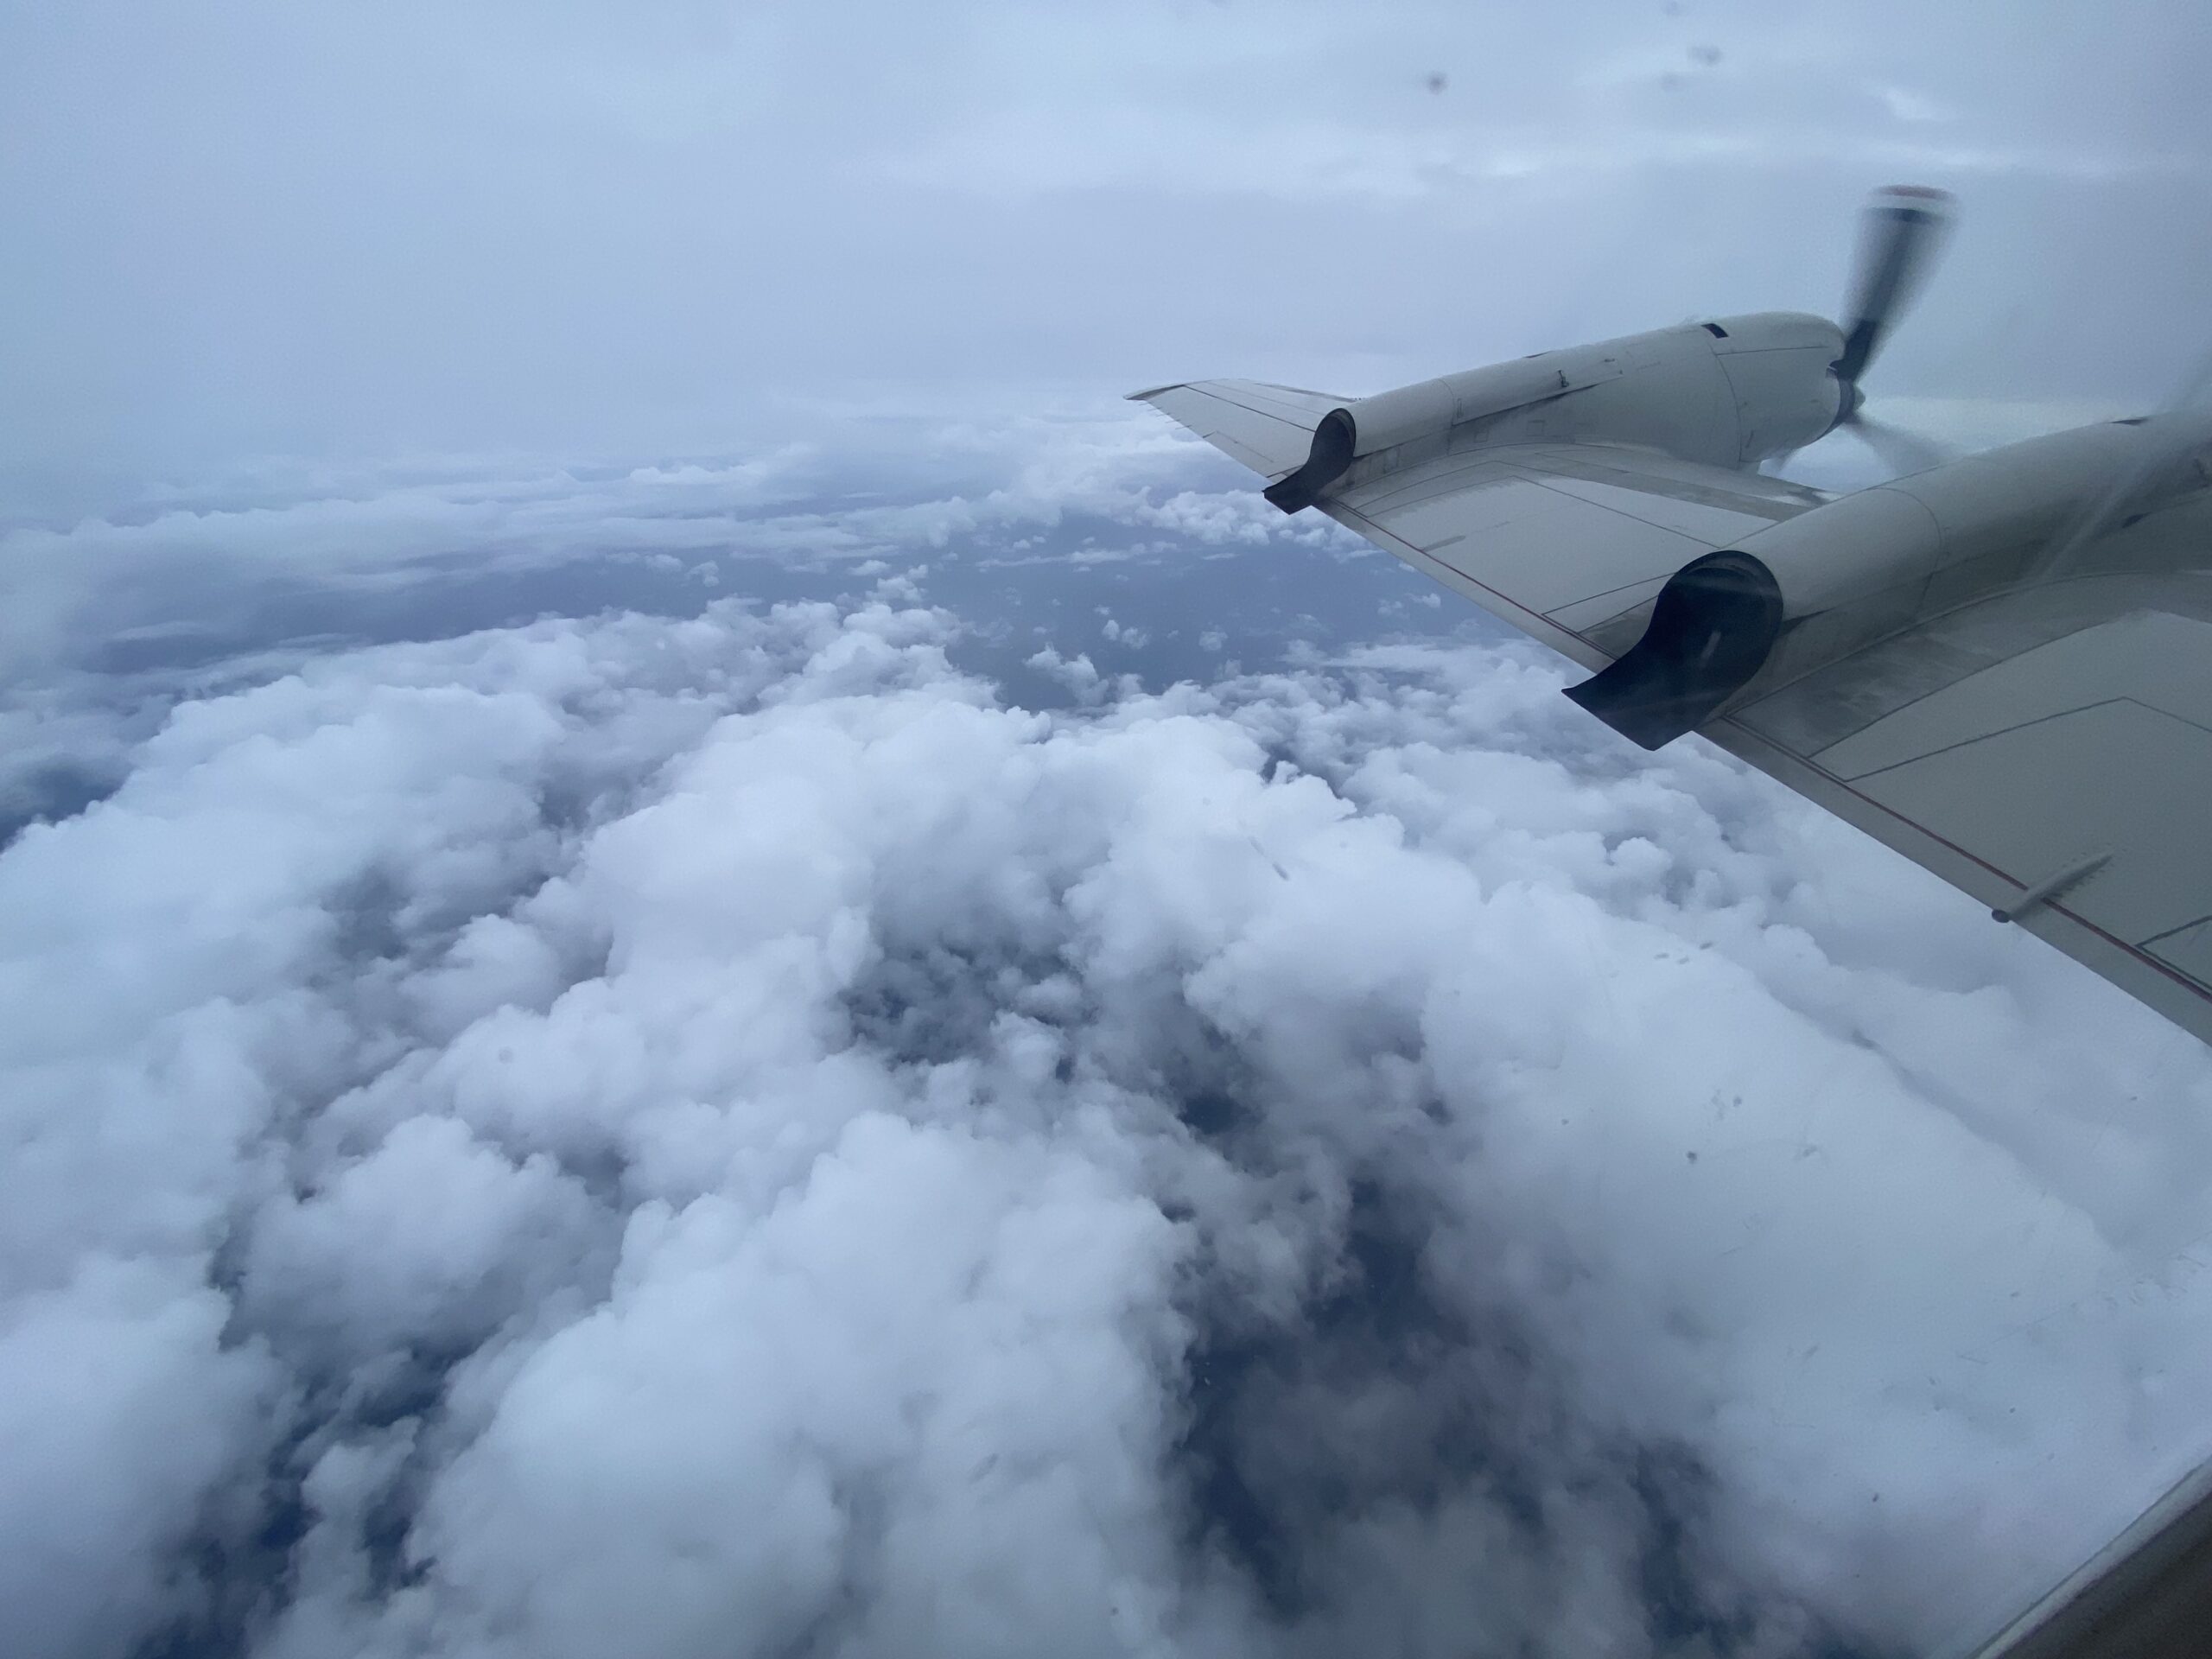
Header photo: View from NOAA WP-3D Hurricane Hunter aircraft “Kermit” during flight 20220928H1 into Hurricane Ian. Photo courtesy of Joshua Wadler.
About 36Hurricanes
The 36th Conference on Hurricanes and Tropical Meteorology brought together hundreds of hurricane researchers, modeling experts, forecasters, emergency managers, communicators, and more May 6-10, 2024, in Long Beach, California to discuss the latest in tropical cyclones and other tropical weather phenomena. It was hosted by the AMS Committee on Tropical Meteorology and Tropical Cyclones.
You can view the online program here. All conference presentations will become available to the public starting in August 2024.
