BEST: Capturing the Worst Tornado Winds

Greenfield tornado

Greenfield, Doppler on Wheels, and what happens where a twister meets the ground

By Katie Pflaumer, AMS Staff

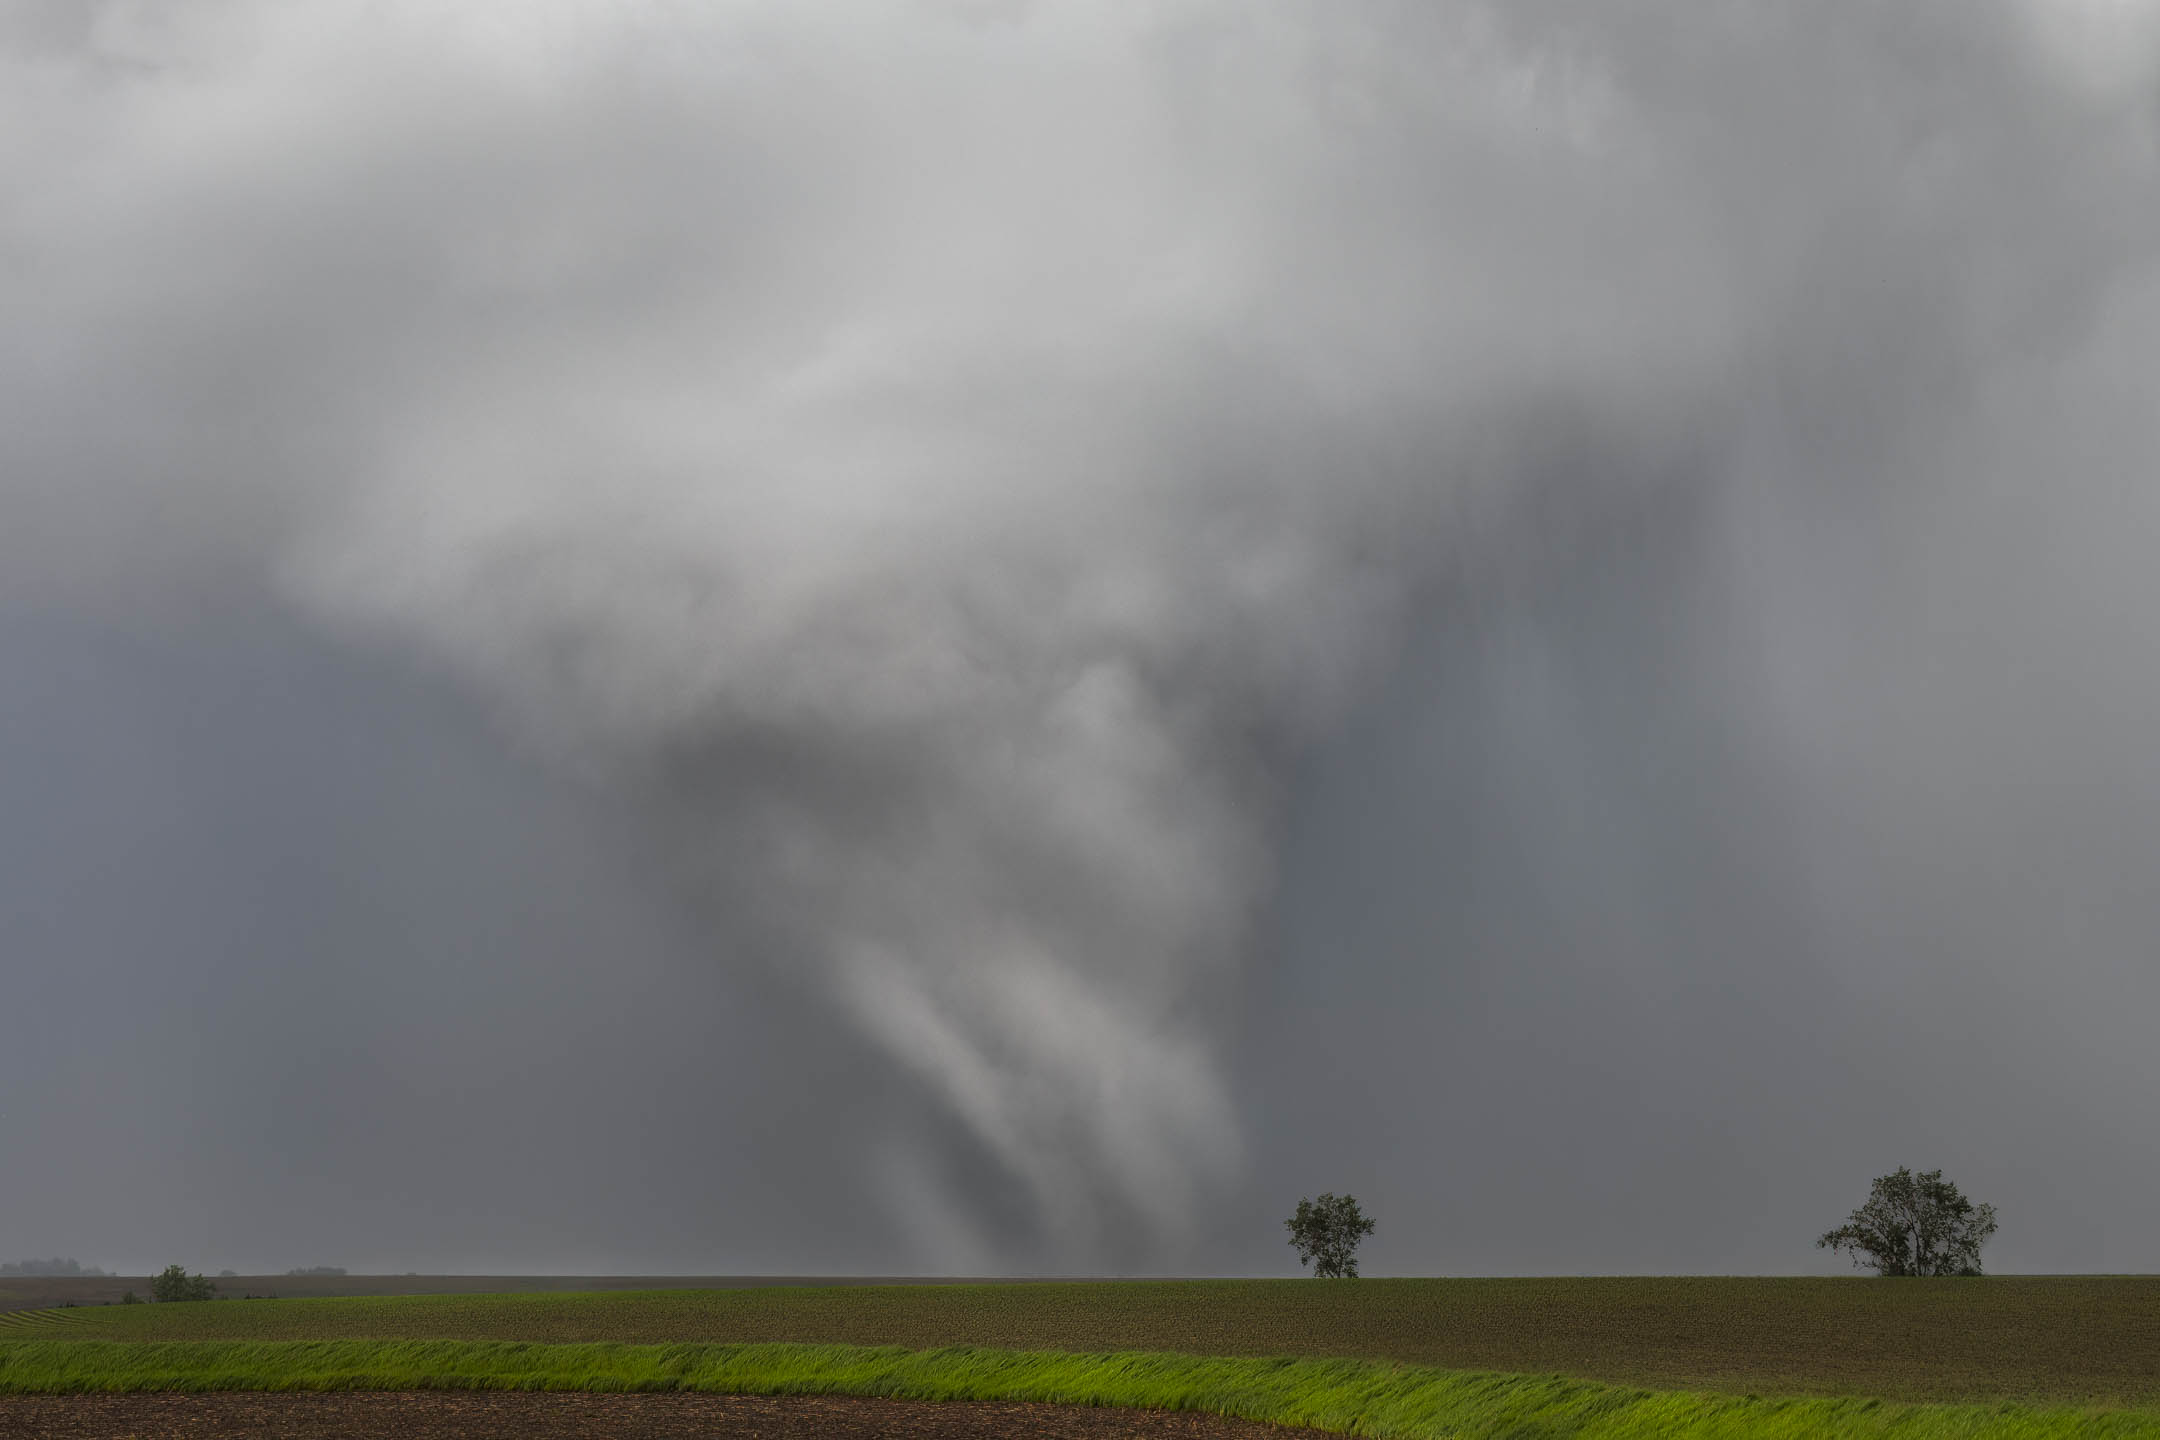
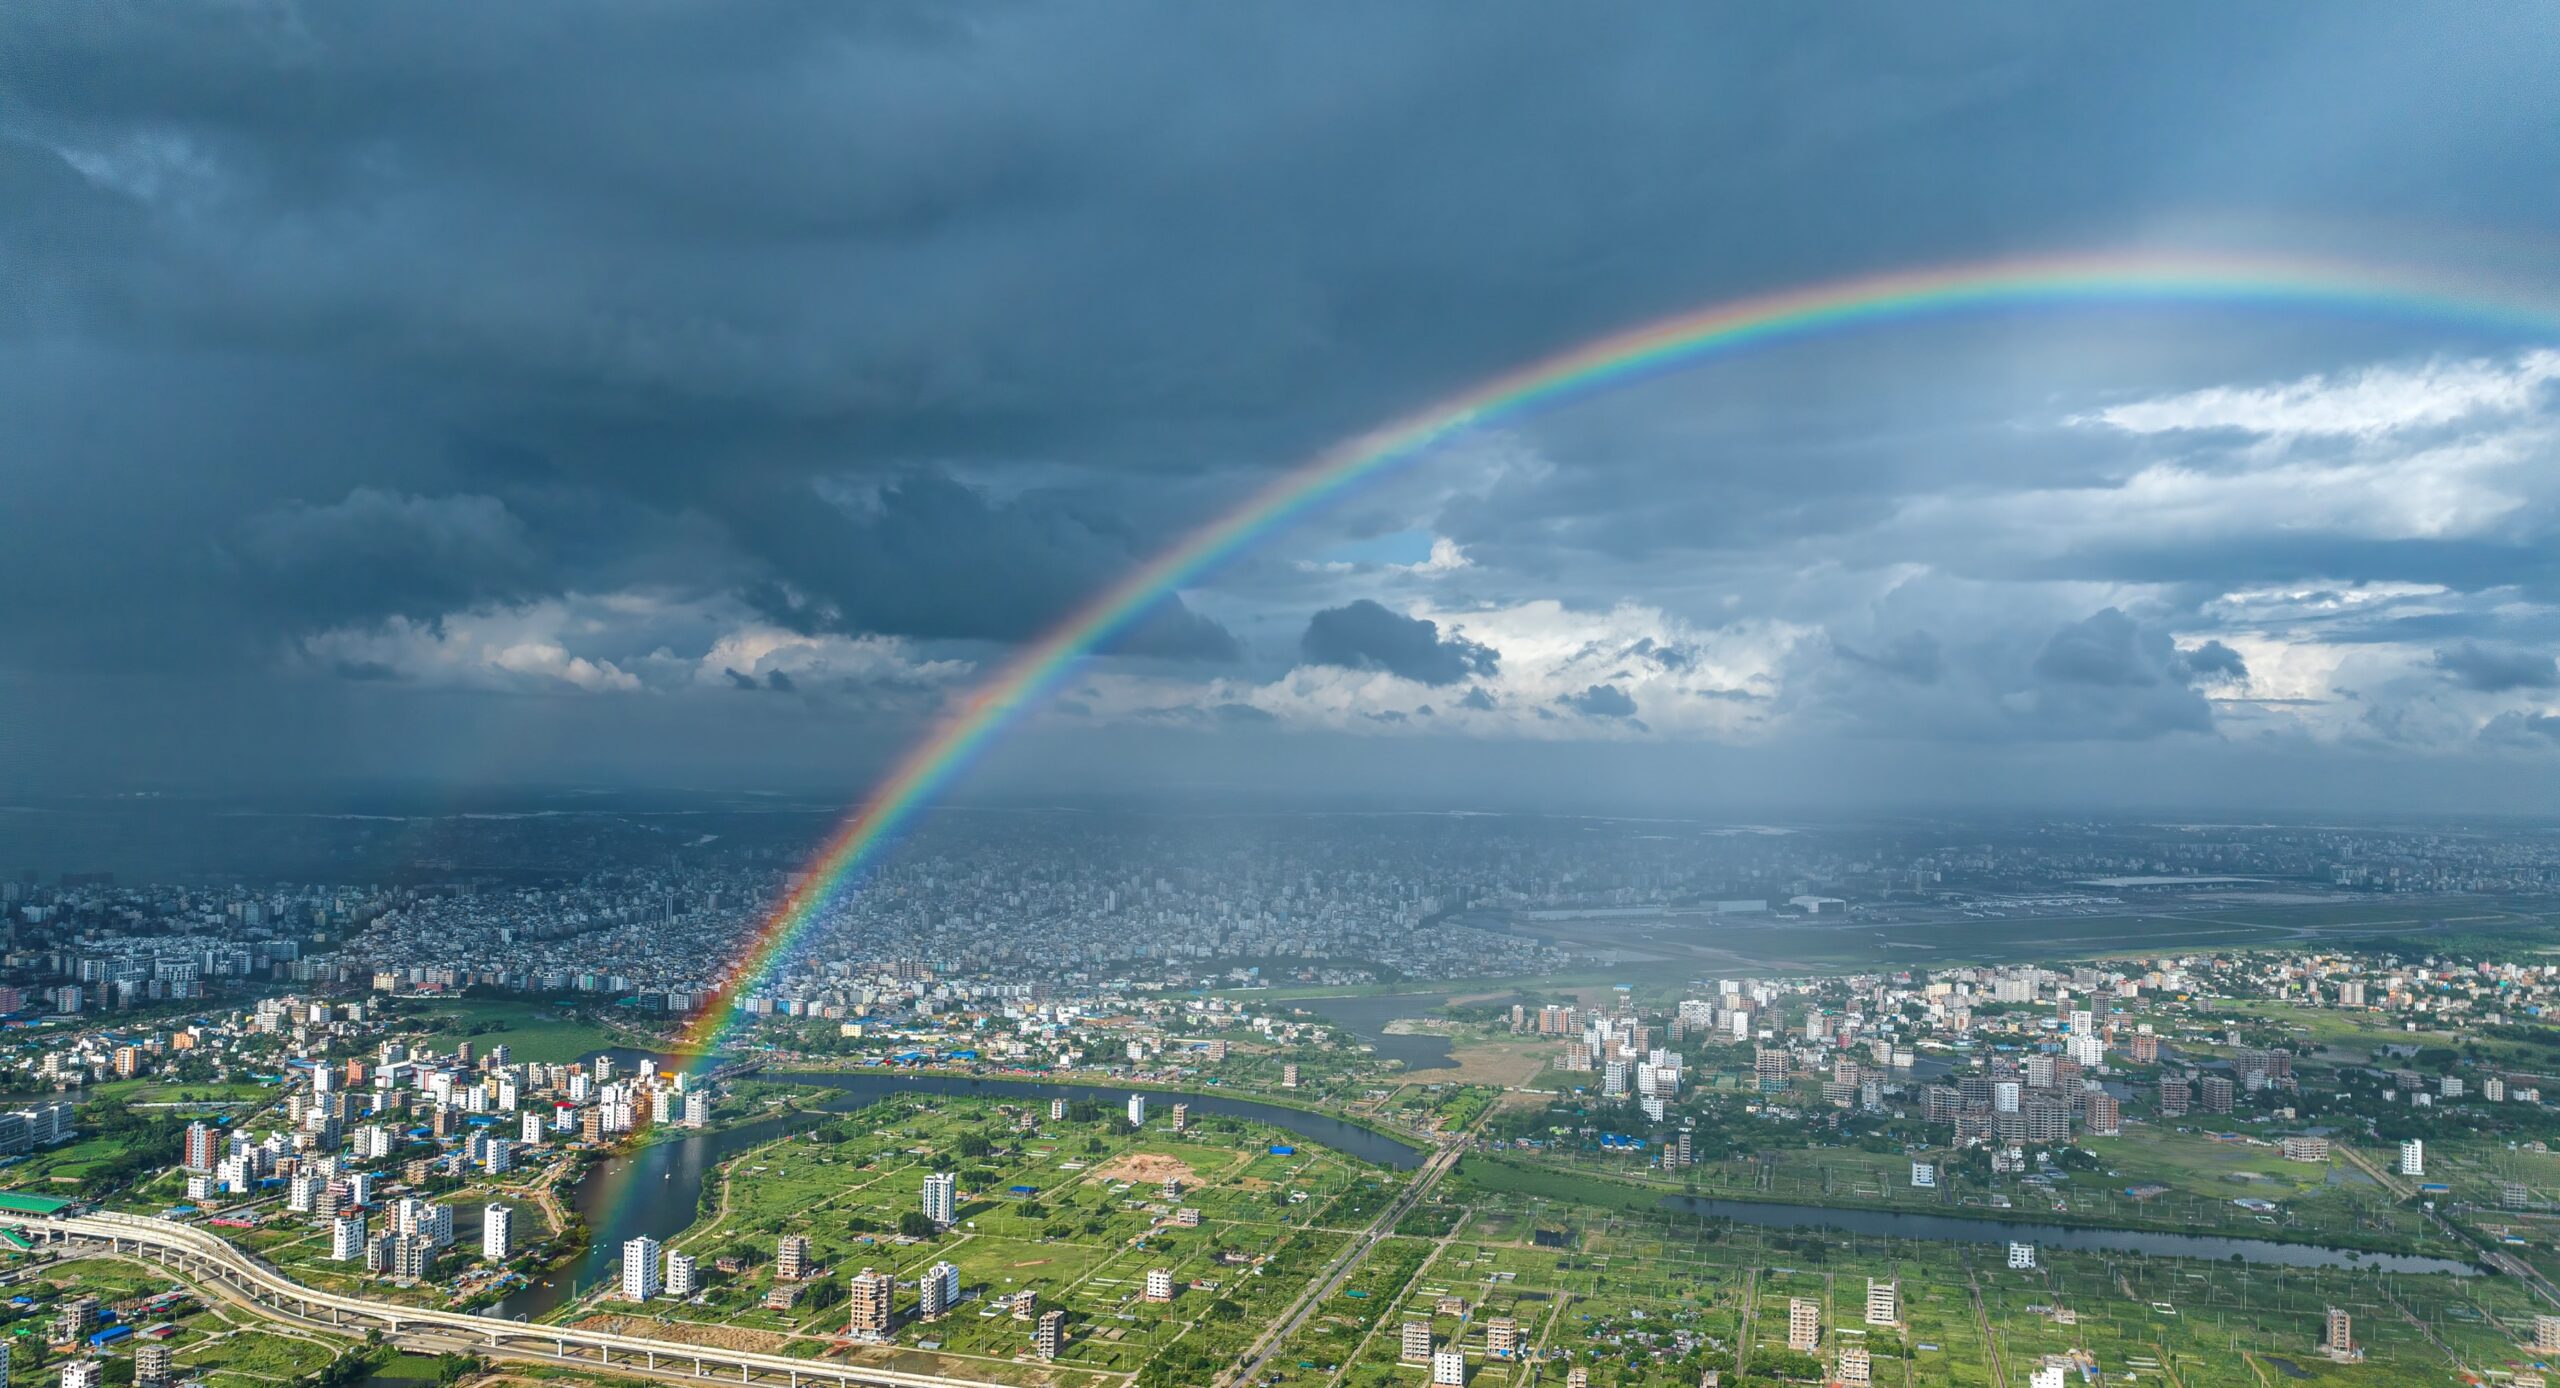
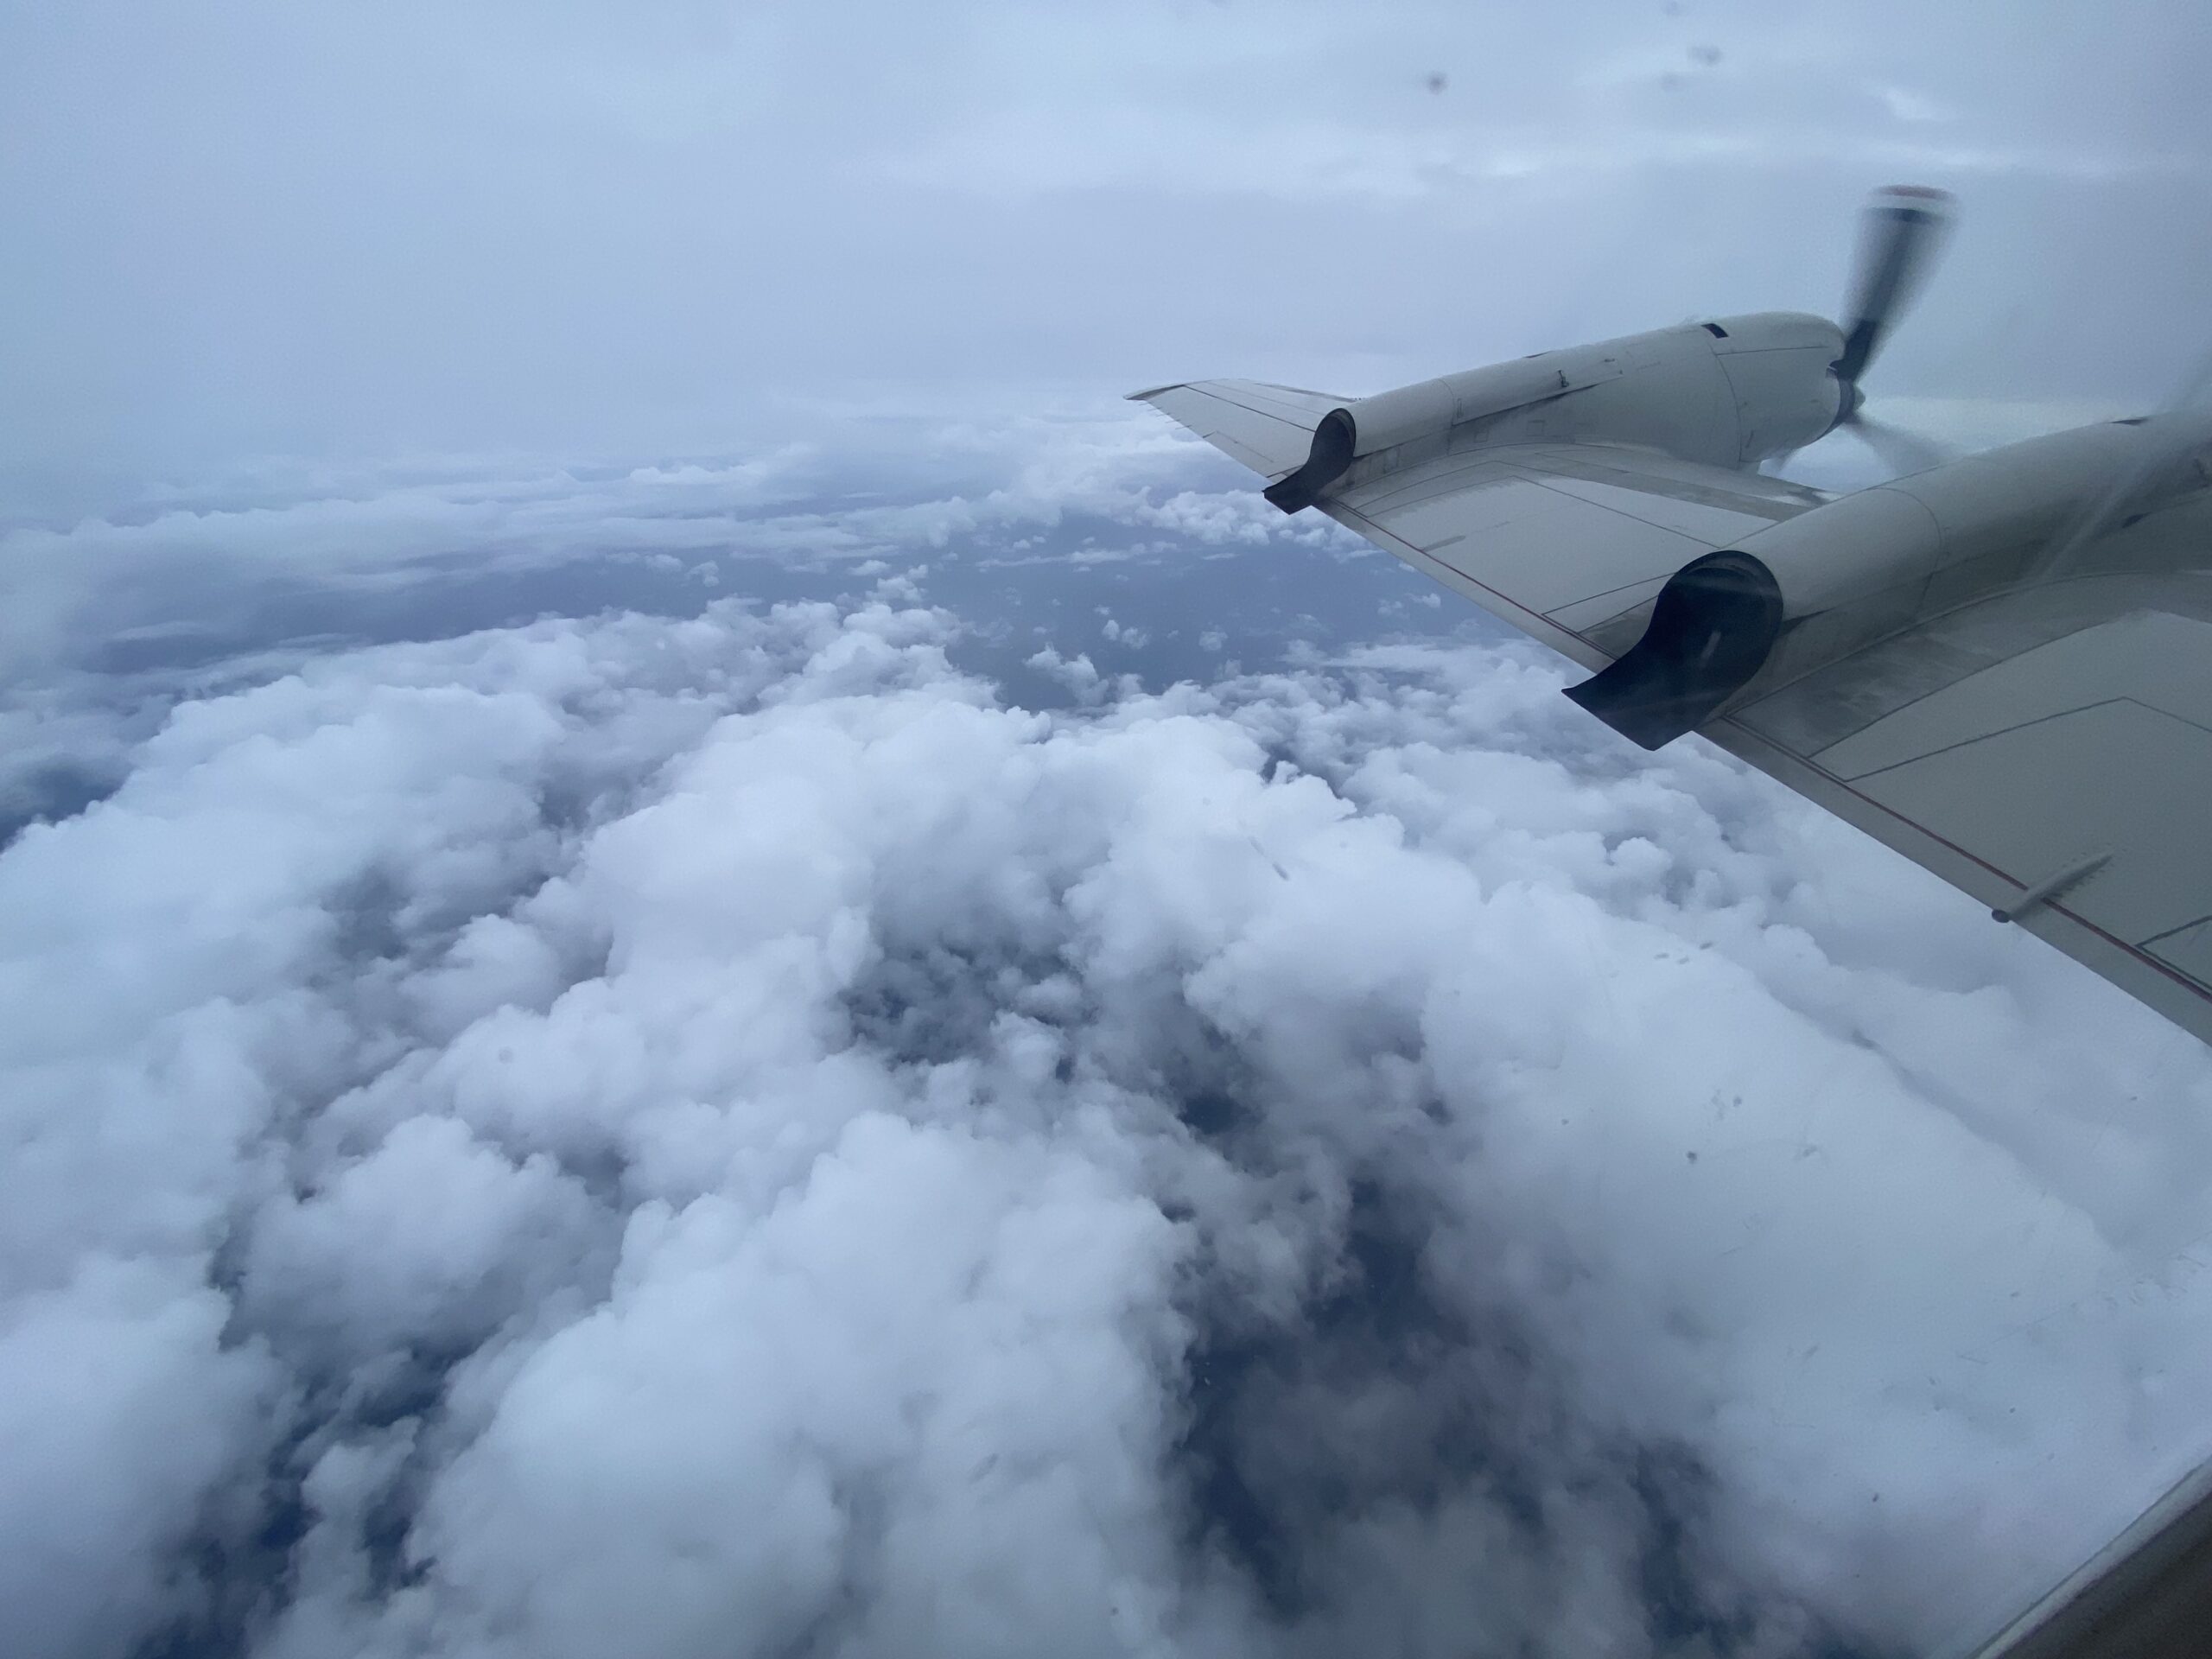
Featured image: The Greenfield tornado, south of the town. Photo credit: Lauren Baca.

On 21 May, 2024, a powerful tornado hit the town of Greenfield, Iowa. A mobile team from the NSF BEST project was able to capture radar and instrument data, measuring one-second gusts among the highest ever recorded. Karen Kosiba, PhD, Principal Investigator (PI) of the BEST project, and Jen Walton, founder of AMS partner organization Girls Who Chase, were both part of the team who intercepted the Greenfield tornado. We spoke with them about what it was like, and what their valuable data might yield.

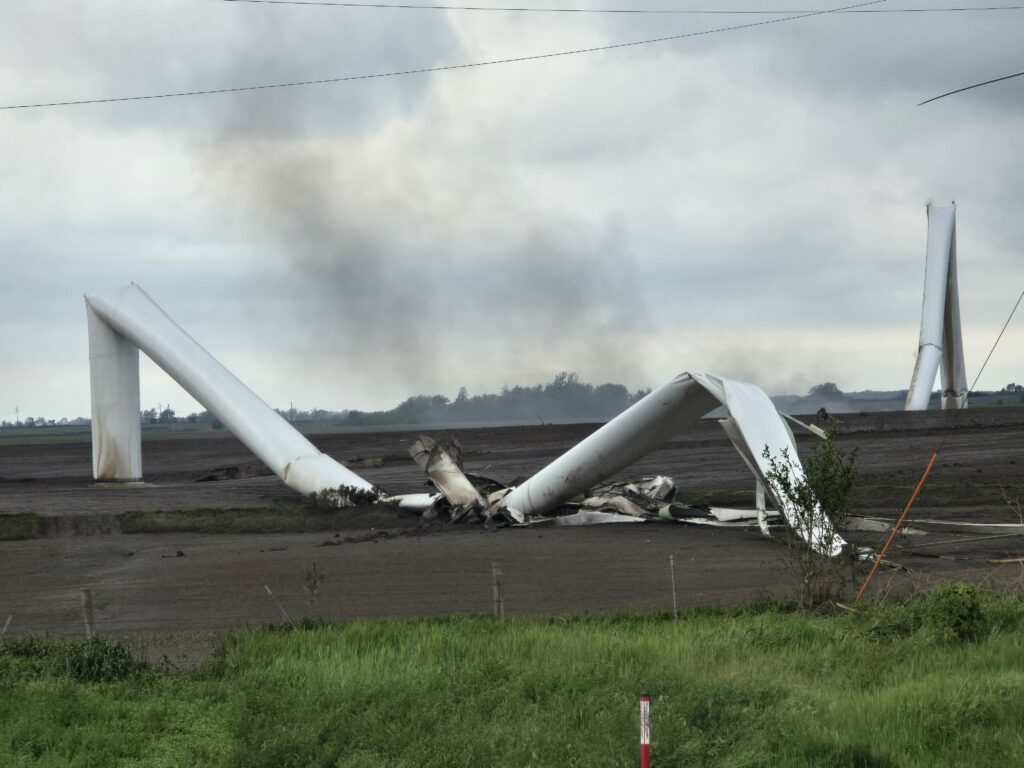
The tornado that hit Greenfield was fast, narrow, and violent, cutting a 44-mile path through southwestern Iowa. Moving into town from the southwest, it had already destroyed wind turbines and family farms, with multiple vortices visibly rotating around its center. 

But as it neared Greenfield, where it would kill five people, the tornado was obscured by a cloak of rain. Racing toward the town with her colleagues, Jen Walton told me, “We could see nothing but a wall of white ahead of us.” They were trying to put themselves right in the path of a hidden monster.

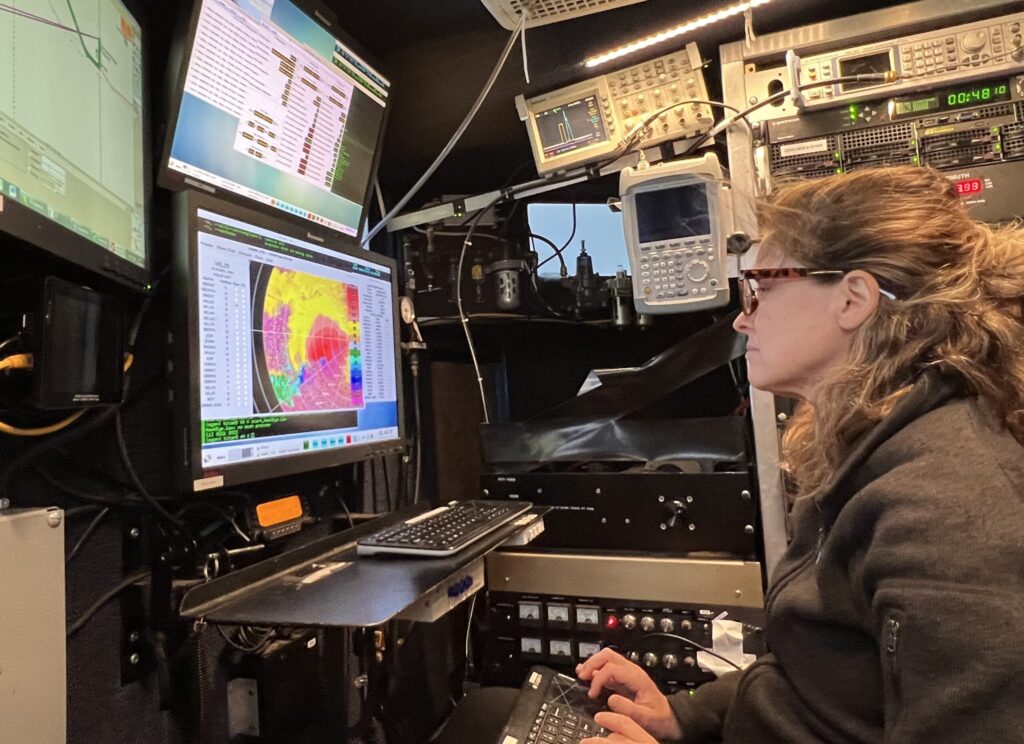
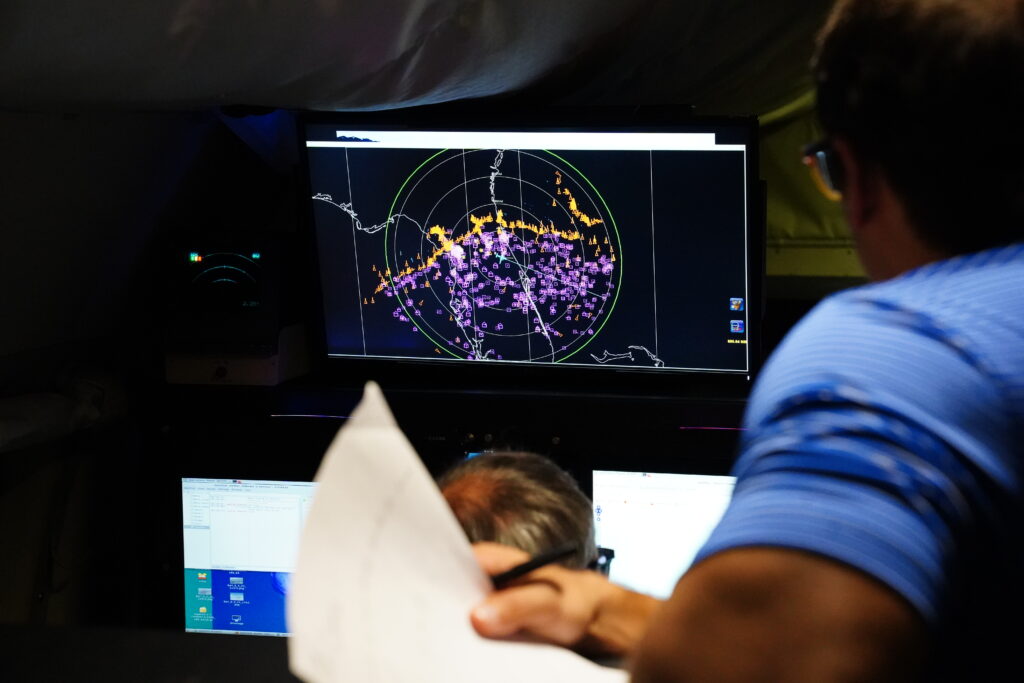
Karen Kosiba wouldn’t have seen it anyway, although she was less than a quarter of a mile from the vortex. “I [almost] never look out the window,” she told me. Her attention was glued to the radar screen. As Principal Investigator on the NSF-funded BEST (Boundary-layer Evolution and Structure of Tornadoes) project, her job was to track the path of the tornado on radar so their team could get close enough to obtain high-resolution dual-Doppler radar and weather instrument data of the tornadic winds closest to the surface of the earth. 

They had sped through Greenfield, and her mobile radar vehicle was now parked just to the east of town, hoping for a clear line of sight in the hilly, tree-covered terrain. “I’m operating the radar, we’re basically scanning through this [storm], tracing the path of the tornado, and it was getting more and more obvious it was going to go through Greenfield,” she said.

Karen Kosiba in DOW
Dr. Karen Kosiba reading the radar screen in a DOW vehicle. Photo credit: Jen Walton/FARM Facility.

DOW(n) Low with Tornadoes

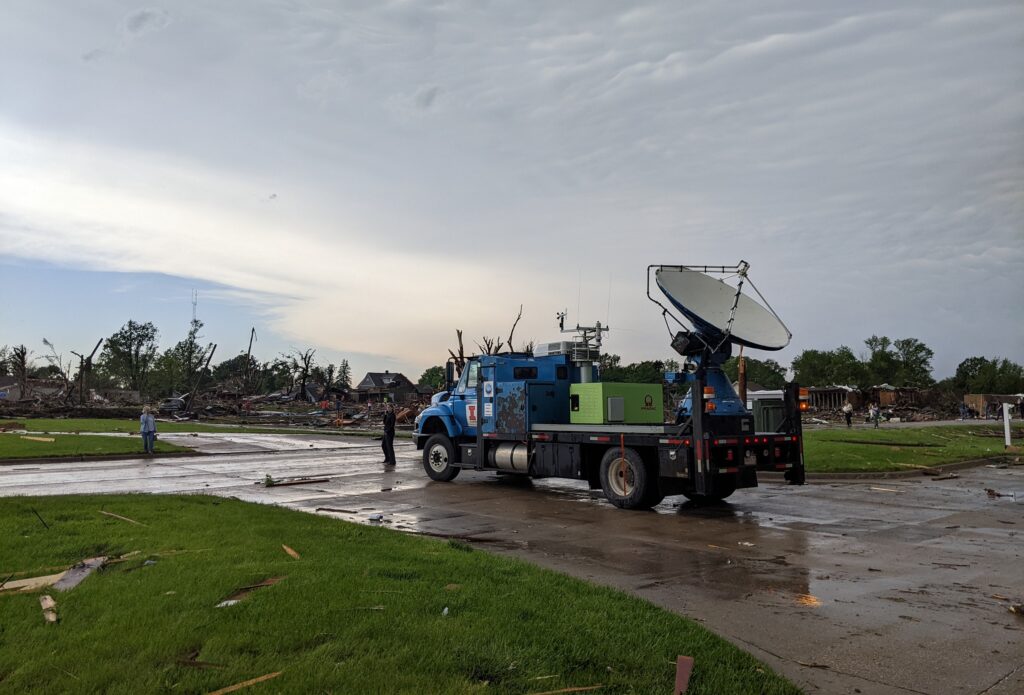
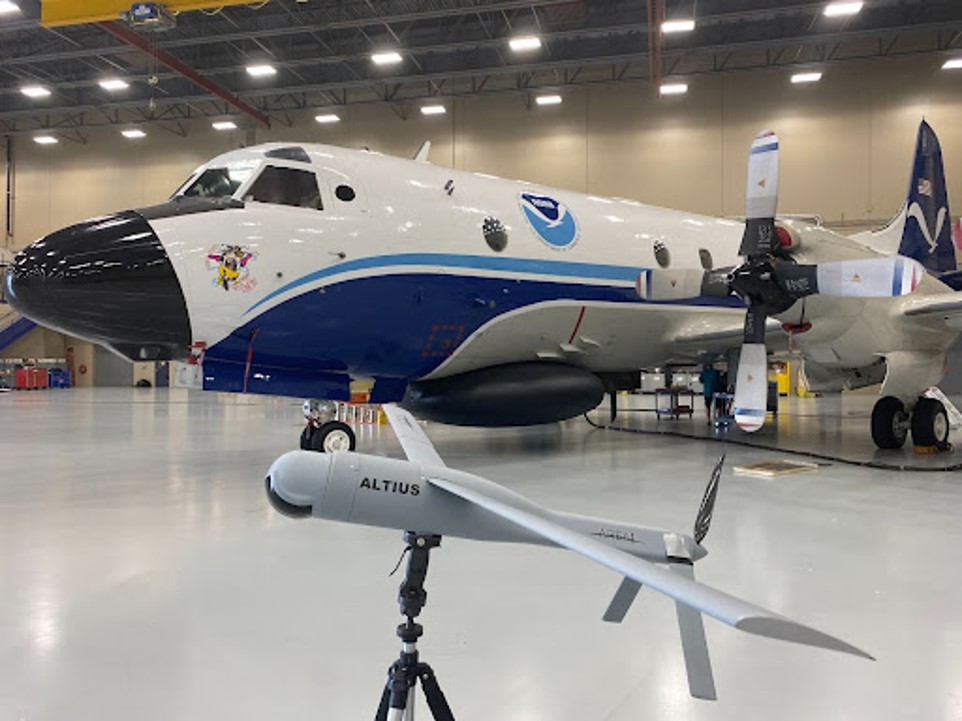
Obtaining high-resolution data from tornadoes is incredibly difficult using stationary instruments and radars — especially for near-surface conditions. The earth’s curvature and obstacles like trees and topography mean that far-away radars simply can’t get a good view of where a twister meets the ground. Also, because of beam spreading, far away radars have worse spatial resolution. Josh Wurman invented the Doppler on Wheels (DOW) network of truck-mounted Doppler radars — now part of the University of Illinois’ Flexible Array of Radars and Mesonets (FARM) Facility — in the 1990s to address challenges like these. DOWs have been used all over the world to look at everything from hurricanes to flooding and wildfires.  

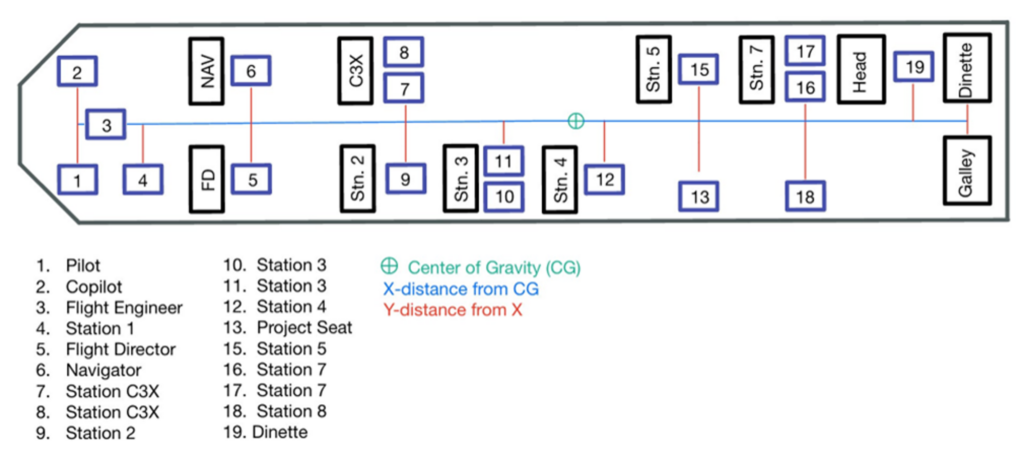
FARM missions currently involve some combination of their four DOWs, a variety of support vehicles equipped with mesonets, and quickly deployable weather stations (Pods), as well as weather balloon-borne instrumentation. The equipment has advanced greatly since the ’90s, Kosiba says. “We scan fast, with really short gates that get us fine-resolution … dual-pol data, which is important for understanding debris signatures and inferring microphysics.” 

The BEST project (which Kosiba co-leads with Wurman) deploys DOWs, Pods, and weather balloons to study boundary-layer tornado winds. “We’re looking at … near-surface wind profiles, and how those vary as a function of tornado structure,” said Kosiba. “We’re also looking at thermodynamics — the relative humidity and temperature, more or less buoyant air, where it originates from — and how that affects tornado intensity, structure, and longevity. Is [the tornado] intensifying, weakening, going on for a long or short time?” It’s the kind of assignment the DOWS were made for.

“Some, rare, observations show that tornado winds can exceed 300 mph, and that the most intense winds are very near the ground, where they are especially hard to measure. In order to mitigate the hazards posed by tornadoes, it is critical to better understand their basic structure and intensity.”

—Excerpt from NSF Boundary-layer Evolution and Structure of Tornadoes (BEST) project grant description

In Greenfield

As TV screens and tornado sirens blared warnings to the town of Greenfield, the BEST team frantically tried to find a place to deploy as the tornado bore down. 

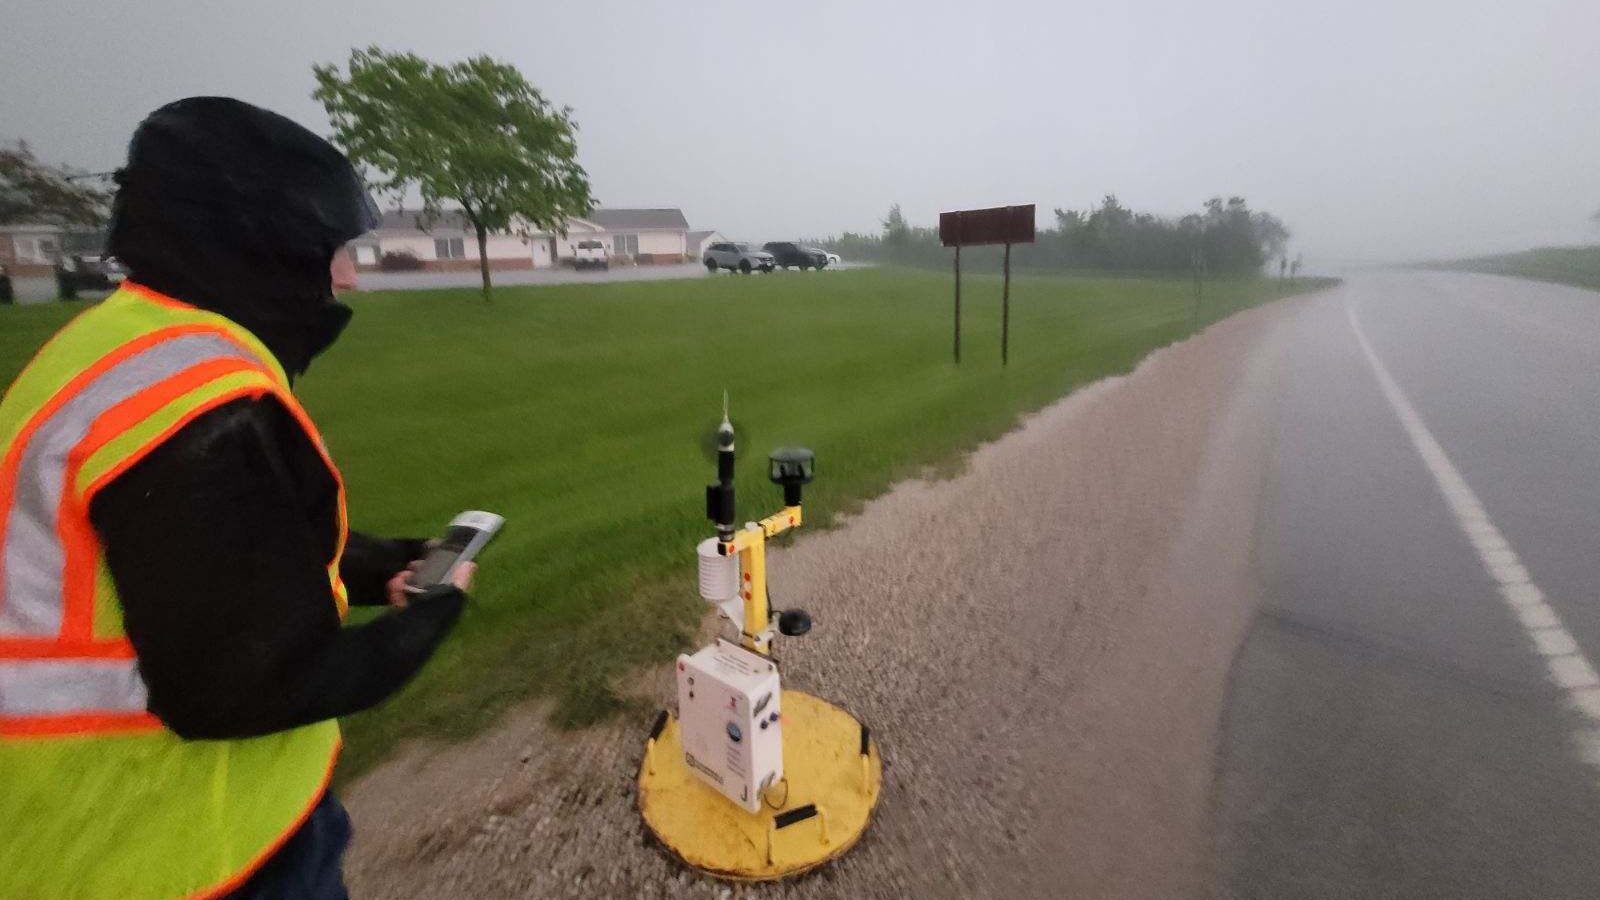
“It was evolving too quickly,” Kosiba told me. One DOW raced to get about 10 miles out, while Kosiba’s DOW truck tried to get closer — and Jen Walton and colleagues went even closer to the tornado, attempting to drop a Pod. Pods are placed in the projected path of the tornado, with the hope that they will obtain surface wind observations from within the radius of maximum winds. Positioning the Pod was difficult with a storm moving at close to 45 mph. 

“As we drove back west toward Greenfield … it was absolutely pouring, making it difficult to make out any features of the tornado-producing storm entering town. But as we pulled up and began to deploy the Pod, the rain bands took on a left-to-right motion indicative of rotation,” said Walton. “That’s when we knew we were in the bear’s cage — chaser slang for the mesocyclone portion of a supercell where a tornado can typically be found, if there is one. As we took GPS coordinates and prepared to depart, debris began falling slantwise out of the rain. We knew it was time to go.”

As it turned out, the Pod team wasn’t the only group having a close encounter. Kosiba’s DOW vehicle ended up directly in the path of a weaker tornado that was forming as they collected data near Greenfield. “The storm was going through a cyclic thing, and there was a new tornado forming very near us. It got windy and rainy.” Although they noticed this in real-time, there wasn’t much they could do except keep collecting data. Luckily, the tornado strengthened after it passed their location.  

As so often happens with this work, for Kosiba at least, there was no time even to be nervous. “Tornadoes are so fast, and you’re so focused on getting people in the right place, in a safe place, and getting the data, so there’s no time to think about anything other than that.” 

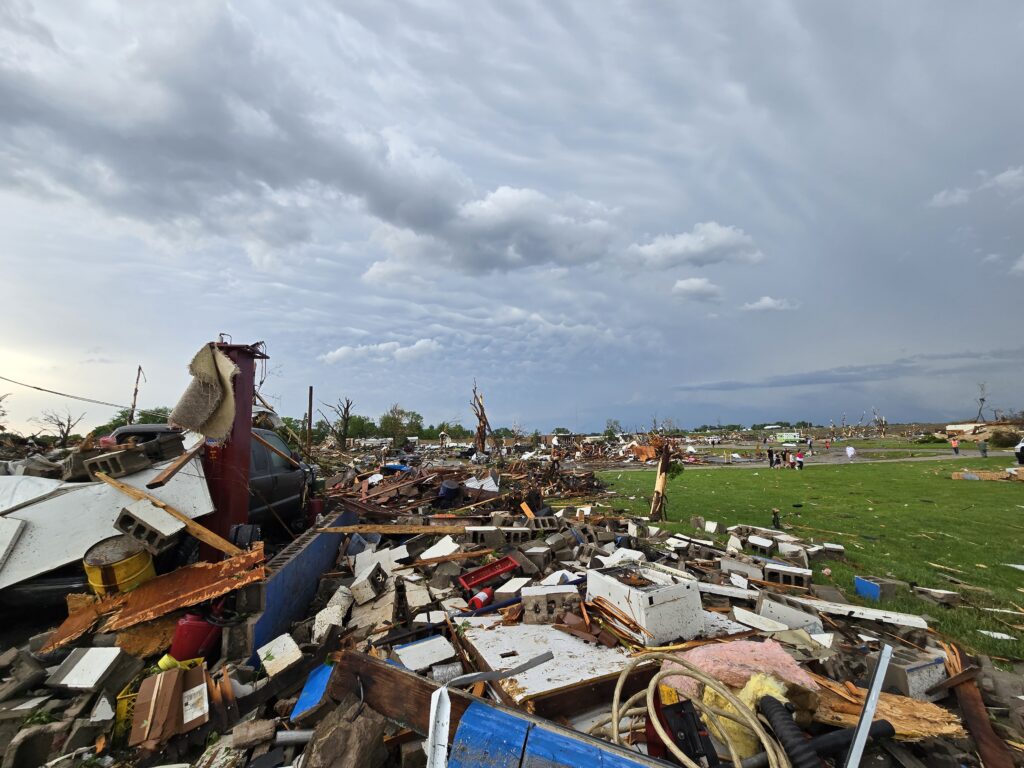
What was harrowing was driving into Greenfield once the tornado had passed. “There’s clearly a path of destruction … In that narrow region [where the tornado went through], it was pretty raked over. People were still coming out of their houses, animals were still trying to get oriented.”

Rare Data from a Disaster

The radar data from the BEST team is high-resolution enough that researchers will be able to examine how specific structures in Greenfield failed in the high winds. “Measuring low-level winds very close to a town is very rare … we can see in a very localized area what these structures experienced,” Kosiba said. These grim analyses could assist damage assessors after future storms, and perhaps even help those building and maintaining man-made structures to make them safer.

“We’re in the preliminary stages of inventorying what we’ve got and what we can do,” said Kosiba. “But it’s a rich and unusual dataset.”

DOW8 in Greenfield
DOW8 vehicle in Greenfield after the tornado’s passage. Photo credit: Maiana Hanshaw/FARM Facility.

Strongest Winds Ever?

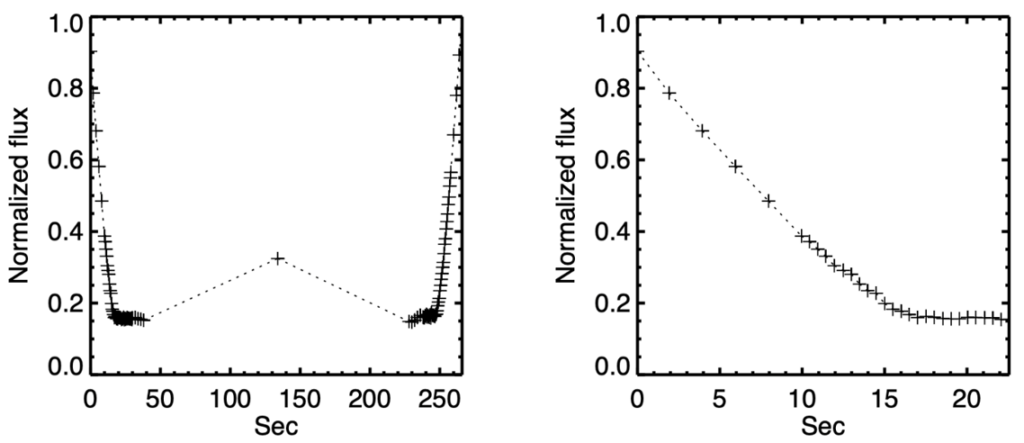
During the storm, the team was concerned only with acquiring good data. When they actually looked at the Greenfield readings, however, they were surprised to note winds of around 270 miles per hour, with gusts well above that. These one-second wind speeds are difficult to pinpoint exactly, said Kosiba, as the particles measured by radar — “debris, raindrops, grass, two-by-fours” — are all moving differently through the air and at different angles to the radar beam. “We’re trying to give a range, which puts this event at 309–318 mph.” The two strongest known tornadoes, El Reno in 2013 and Bridge Creek in 1999, both had DOW-measured wind speeds within that range.

Yet the Greenfield tornado was “only” deemed an EF4 by the National Weather Service (indicating three-second wind speeds up to 200 mph). This is likely because the EF scale is based on the structural damage a tornado leaves, not radar/instrument measurements. To receive the highest rating, EF5, a tornado has to damage structures to a degree that only an EF5 could. “It’s possible there was nothing [in its path] that could have sustained an EF5 level of damage,” said Kosiba. 

In addition, the highest wind gusts measured by the DOW team were for very short intervals, often less than one second, rather than longer-period averages. Due to the relative dearth of close-up measurements, we don’t know enough to say how unusual such high wind speeds near the surface really are.

Chasing the Data

“Twisters,” the long-anticipated sequel to the 1996 movie “Twister,” has hit movie screens, highlighting the awe of dangerous storms–and the divisions sometimes drawn between scientific researchers and those who chase storms because it’s their passion. As researchers and storm chasers who work together to get vital information about tornadoes, what do Kosiba and Walton think?

Jen Walton deploys a Pod of weather instruments in the path of the Greenfield tornado. Photo credit: BEST/FARM Facility.

“In my opinion, storm chasers are fonts of historical knowledge and expertise that are underutilized by the scientific community, and this is something I’m discussing with AMS and the broader research community,” said Walton. “We get a bad rap for being adrenaline junkies seeking our next thrill, and of course some folks are. But many people, myself included, would love to have more tangible ways to contribute in addition to already serving as eyes on the ground for the National Weather Service and/or working with local broadcast meteorologists. When Karen mentioned the opportunity to support the BEST Project, I jumped at the opportunity to use my own knowledge and expertise to contribute to work I know will truly make a difference in peoples’ lives – and even though my 2024 looked very different than a typical season, my time in the field with the DOWs is an experience I wouldn’t trade.”

“This kind of data collection is high risk but high payoff. You have to be out in the field to do it,” said Kosiba. “People who storm chase can make very valuable parts of the scientific team. Jen knows storm structure and forecasting … We want people who know what they’re looking at, who can think about exits; they need to be able to make some autonomous decisions out there. … If you just have a textbook understanding of storms, you have to get ramped up [on the practical side]. But people who’ve been looking at these storms for a long time and making decisions, that’s a great skill.”

To learn more about Girls Who Chase, listen to podcast interviews with experts like Dr. Kosiba, or even start your storm chasing education, check out girlswhochase.com.

To learn more about BEST and the DOWs, AMS Members and Weather Band members can watch our 23 July, 2024 webinar featuring Drs. Kosiba and Wurman and moderated by Jen Walton: Tornado on the Ground: DOW insights from 2024 tornadoes, including the Greenfield, IA EF4.

An Immigrant Scientist’s Experience at the AMS Science Policy Colloquium

By Akanksha Singh, Graduate Student in Atmospheric and Oceanic Sciences at the University of Maryland, College Park

Note: This is a guest blog post; it represents the views of the author alone and not the American Meteorological Society or the AMS Policy Program. The Science Policy Colloquium is non-partisan and non-prescriptive, and promotes understanding of the policy process, not any particular viewpoint(s).

I moved to the United States in 2019 to pursue my PhD in Atmospheric and Oceanic Sciences at the University of Maryland. As a scientist, I have always been passionate about the potential of science to positively transform lives worldwide. Growing up and being trained in the Global South, I have witnessed firsthand the profound effects of environmental changes. The Global North (definition) is primarily responsible for the excess CO2 in the atmosphere, considering historical emissions. However, it is the Global South that disproportionately suffers from the impacts of climate change caused by these emissions. This unfair burden underscores the need for environmental justice and policies not only locally but also globally. Therefore, I was excited to attend the AMS Science Policy Colloquium (SPC) to learn how an immigrant scientist like myself can navigate the U.S. policy process and conduct research that helps hold the U.S. accountable for its impact on the Global South.

During one talk, I found myself particularly interested in an account of a famous World War II-era debate between Vannevar Bush, author of “Science, the Endless Frontier,” and West Virginia Senator Harley Kilgore about how government-funded research should be managed and directed. Bush advocated for funding the “best” scientists to pursue research, without specific social aims, whereas Kilgore pushed for more equitably distributed funding for research, with a focus on addressing urgent social problems. Bush’s viewpoint ultimately prevailed, leading to the creation of the National Science Foundation, which emphasizes and advances his merit-based approach.

However, this debate made me wonder: how do we define merit? How do we determine who the “best” scientists are, particularly in the context of climate science? As several speakers noted, research funding and university resources are overwhelmingly concentrated in wealthy, coastal, urban areas. As a result, climate research often fails to fully consider all relevant stakeholders, particularly to the detriment of rural, marginalized, and indigenous populations. How can we ensure that the contributions of indigenous knowledge systems are valued and integrated into scientific research? How do we bridge the rural-urban disparity in research opportunities and resources to foster a more inclusive and comprehensive approach to addressing global challenges like climate change? Can we reimagine how NSF funding is granted to develop a more equitable solution?

Left: Akanksha at the SPC’s 2024 Hooke Lecture in Science and Society (Photo: AMS staff). Right: Akanksha at the U.S. Capitol (Photo: Akanksha Singh).

We also learned a lot about the growing political divide across the United States, and how it has led to a significant decrease in the productivity of both the House and the Senate. The number of swing districts has dwindled significantly, and ideological divisions over relevant topics have grown steep and bitter, raising concerns about the future of science policy and legislature. This subject is particularly pertinent as a number of recent U.S. Supreme Court decisions have limited the authority of federal agencies, most notably the EPA. If federal agencies are increasingly limited in their power to direct science policy, and Congress is too gridlocked to pass necessary legislation, how will we promote and direct scientific advancement as a nation?

Changing topics, I was surprised by many speakers’ focus on China as a significant economic and national security threat, and how these concerns manifested as suspicion of Chinese scientists. While I understand that many of these concerns are valid, as an Asian immigrant and a member of the scientific community, it is upsetting to hear fellow scientists portrayed as a threat. As future policymakers, we must oppose such rhetoric. Immigrant scientists have significantly advanced American science and form the backbone of our scientific community. Targeting them with suspicion and xenophobic rhetoric is not only unjust but also detrimental to our scientific progress.

That being said, I appreciated other speakers’ suggestions that we view China as the most important international scientific collaborator for the United States, and that the best scientific advancements come from collaboration and a sense of global good. I agree that changing our attitudes towards China and advancing science peacefully should be our goal, especially when forming policies to combat climate change. Climate change does not differentiate between nationalities and it does not respect borders; as scientists, neither should we.

I was struck by one thing I felt was missing from the SPC: there was no discussion of the military-industrial complex, its impact on science policy, and how relying on for-profit defense contractors for funding will never lead to equitable scientific advancements. While I understand the need for private investments, I think it’s high time we push for the triple bottom line—economic, social, and environmental considerations—when calculating the success of a project, rather than focusing solely on economic profitability, especially when these ventures ultimately profit from conflict and involve large amounts of unregulated and untracked greenhouse gas emissions.

Overall, I had a fantastic time at the AMS Science Policy Colloquium. It was truly a once-in-a-lifetime opportunity to engage with a diverse group of individuals involved in the formidable U.S. science policy space. It was also wonderful to interact with fellow attendees, fostering collaborations and connections that will last a lifetime. I’ve gained a deeper appreciation for the challenges of science policy and have come to recognize the importance and necessity of compromise in achieving progress. My research  focuses on understanding tropospheric ozone chemistry and conveying that into policy-relevant tropospheric ozone reduction strategies. In this regard, the SPC has helped me understand the priorities of key stakeholders in the policy making and implementation process, as well as the importance of translating scientific research into policy directives. This SPC has also encouraged me to pursue a career in science policy and/or environmental justice post-PhD.

Last but not least, I would like to thank the people who made this colloquium possible: Paul Higgins, Emma Tipton, and Isabella Herrera, for their passion and commitment in creating such a rich environment of learning opportunities and experiences. 

Featured image: Akanksha Singh, second from left, with her SPC legislative exercise working group. (Photo courtesy of Akanksha Singh).

About the AMS Science Policy Colloquium

The AMS Science Policy Colloquium is an intensive and non-partisan introduction to the United States federal policy process for scientists and practitioners. Participants meet with congressional staff, officials from the executive office of the President, and leaders from executive branch agencies. They learn first-hand about the interplay of policy, politics, and procedure through legislative exercises. Alumni of this career-shaping experience have gone on to serve in crucial roles for the nation and the scientific community including the highest levels of leadership in the National Weather Service, the Office of Science and Technology Policy (OSTP), the National Science Foundation, and the U.S. Global Change Research Program (USGCRP), and AMS itself.

Addressing Extreme Heat and Climate Change Adaptation

Jessica Stewart at the AMS 2024 Science Policy Colloquium

Reflections on the 2024 AMS Science Policy Colloquium

By Jessica Stewart, MHA, MPH, student DrPH, The George Washington University

Note: This is a guest blog post; it represents the views of the author alone and not the American Meteorological Society or the AMS Policy Program. The Science Policy Colloquium is non-partisan and non-prescriptive, and promotes understanding of the policy process, not any particular viewpoint(s).

The 2024 AMS Science Policy Colloquium was a deeply enriching experience, offering valuable insights and fostering new connections. As a second-year doctoral student focusing on climate change adaptation and interest in integration of policy and governance, I found the colloquium’s session discussions to be both inspiring and pivotal for my research and professional growth.

Insights into Policymaking

The colloquium provided a detailed exploration of the policy-making process, which I’ll admit I did not fully understand at first. The sessions highlighted the crucial role of effectively communicating scientific findings, showing how this communication can significantly shape policies affecting our world. This realization drove home the impact and importance of my own dissertation research. Engaging with policymakers and federal officials gave me a real-world perspective on the complexities of policymaking and the collaborative efforts needed to enact meaningful changes.
Networking with a diverse group of students, agency professionals, scientists, and industry leaders was invaluable. These interactions offered fresh perspectives on my research interests and opened doors for future collaborations.

Integrating Climate Change Adaptation into Policy

I was able to find a community of other students and agency professionals who were actively engaged in extreme heat research, and we started sharing ideas—a topic that is particularly significant to me as I thought about my home state of California. California has faced increasingly severe heatwaves and droughts, which have serious effects on public health, infrastructure, and ecosystems. These extreme weather events not only strain the healthcare system but also damage critical infrastructure, such as roads, bridges, and water systems. Additionally, they disrupt the balance of natural environments, leading to loss of biodiversity and increased risk of wildfires.

My research interests explore how new technologies, predictive modeling, and resilient infrastructure can be used to adapt to the escalating challenges of climate change. Making sure these technological solutions fit into policy frameworks is key to their success and long-term sustainability. Policies need to be effective and forward-thinking to accommodate emerging technologies and integrate scientific research into practical applications. This alignment ensures that innovations are not only developed but also effectively implemented, providing real-world benefits and enhancing the resilience of communities against the growing threats posed by climate change.

The dynamic discussions on science, technology and its far-reaching impacts were incredibly insightful. This is one of the many products of the colloquium, this vibrant exchange of ideas and solutions, showcasing a united commitment to tackling today’s challenges and preparing for a more resilient future.

Moving Forward

The AMS Science Policy Colloquium has profoundly deepened my understanding of the intersection between science and policy. The insights and connections I gained will significantly enhance my contributions to the field of science. It was an incredibly enriching experience, providing invaluable insights, professional connections, and strengthened my sense of purpose.

About the AMS Science Policy Colloquium

The AMS Science Policy Colloquium is an intensive and non-partisan introduction to the United States federal policy process for scientists and practitioners. Participants meet with congressional staff, officials from the executive office of the President, and leaders from executive branch agencies. They learn first-hand about the interplay of policy, politics, and procedure through legislative exercises. Alumni of this career-shaping experience have gone on to serve in crucial roles for the nation and the scientific community including the highest levels of leadership in the National Weather Service, the Office of Science and Technology Policy (OSTP), the National Science Foundation, and the U.S. Global Change Research Program (USGCRP), and AMS itself.

The Summer Community Meeting: Why is this year’s meeting so important?

People talking at SCM

Join us August 5–6 in Washington, D.C., as we work to ensure a robust Weather, Water, and Climate Enterprise

By Keith L. Seitter, AMS Senior Policy Fellow and Executive Director Emeritus

The AMS Summer Community Meeting (SCM) is a vital gathering for our community, and one that has played a significant role in shaping the success of the weather, water, and climate enterprise over the past two decades. If you’ve never been to one, it might not be clear why I say that, so as someone who’s attended these meetings from the start, let me explain why they have been so important — and why I am so excited about this year’s SCM.

The SCM was one component of the AMS response to recommendations in the 2003 National Research Council “Fair Weather” report. Many of us view this report as a turning point for the entire community. It acknowledged the serious tensions that existed at the time between the private and government sectors and offered concrete steps that could reduce those tensions and lead to more effective service to the nation. From the standpoint of AMS and its role in supporting the community, the following recommendation was particularly important:

“Recommendation 3. The NWS and relevant academic, state, and private organizations should seek a neutral host, such as the American Meteorological Society, to provide a periodic dedicated venue for the weather enterprise as a whole to discuss issues related to the public-private partnership.”

“Executive Summary.” National Research Council. 2003. Fair Weather: Effective Partnership in Weather and Climate Services. Washington, DC: The National Academies Press. doi: 10.17226/10610.

The full AMS response included establishment, in 2004, of the Commission on the Weather and Climate Enterprise, which later had its scope expanded as the Commission on the Weather, Water, and Climate Enterprise (CWWCE). For the past two decades, as one of several important programs within CWWCE, the SCM has played a pivotal role in improving the collaboration in the weather enterprise and helped greatly reduce tensions and conflict among key players in the community.

We are now two decades past the “Fair Weather” report, and the weather enterprise is very different from those earlier times, with many more players, data from commercial weather satellites, artificial intelligence and machine learning technologies, and many other innovations that are reshaping weather-related fields. These innovations bring the potential for our community to offer even greater service to the nation and the world — if the entire enterprise can work effectively together. So AMS, in 2023, launched a significant study to look at the weather enterprise 20 years after “Fair Weather.” Over 100 volunteers from throughout the enterprise have been participating in the study during this year, and they have identified a number of issues as preliminary findings in that effort.

The 2024 Summer Community Meeting will present some of those key findings as a launching point for extended discussions on foundational issues facing the weather enterprise, now and in the coming decades. That means that this year’s SCM brings the meeting back to its roots two decades ago, and promises to be one of the most influential in recent memory. Among the issues to be discussed are:

  • How can academic programs evolve to create the workforce needed for the Enterprise of today and the future?
  • How can the private, academic, government, and NGO sectors work together to produce the best possible numerical weather prediction platforms?
  • How is the explosion of AI impacting predictions and services?
  • What is the best balance between government observations and commercial data buys?
  • How is the research enterprise changing in the face of new technologies?
  • How do we ensure open science and open data in an enterprise where more observations are under the control of the private sector?
  • How do we ensure our warnings, decision support, and other services are taking best advantage of the strengths of each sector of the community?

The SCM has always provided a unique opportunity for professionals from academia, industry, government, and NGOs to come together to discuss broader strategic priorities, identify challenges to be addressed and opportunities to collaborate, and share points of view on pressing topics. At this year’s SCM, attendees will also contribute to the conclusions and recommendations presented in an important AMS study that could help shape the future of the weather enterprise. I encourage you to consider attending this year’s SCM, regardless of your role in the enterprise, so that you can be part of building our community’s future.

As with all AMS meetings, the SCM will be conducted as a hybrid meeting, so even those who cannot make the trip to Washington, D.C., in person can still take part virtually. Find out more and learn how to register.

Pride Month Spotlight: Progress, History, Future

Clouds with rainbow iridescence

June is LGBTQ+ Pride Month. We asked a few members of the AMS community to give us their thoughts on pride, community, history, and the path forward. Sign up for the Coriolis Committee’s Ask Me Anything Zoom discussion about being LGTBQ+ in the Earth System Sciences (June 26, 2 p.m.) here.

This is part two of a two-part post. Read Part One to learn more about our contributors — Kandis Boyd, Mike Augustyniak, Jerrica Decker, Tevin Wooten, Declan Crowe, and Brad Colman — and their history with the AMS, LGBTQ+ community and advocacy, and coming out.

Our Pride Month blog post contributors. Clockwise from top left: Kandis Boyd, Declan Crowe, Mike Augustyniak, Jerrica Decker, Tevin Wooten, Brad Colman.

How have things changed for LGBTQ+ people in the field over the course of your career?

Brad: There have been dramatic changes, nothing short of remarkable and beyond my wildest dreams when I was growing up. I was just starting to recognize my own sexuality during the Stonewall Riots in 1969. We now have anti-discrimination laws protecting LGBTQ+ people in the workplace and society. Corporations have been strong agents of change with the adoption of inclusive and welcoming policies. One of the most dramatic changes I have observed, and personally feel is one of the most important, is the gain in visibility and representation of the LGBTQ+ community essentially everywhere one looks: politics, TV, academia, corporate, sports, and in many religions. As AMS president, I was proud to be able to bring my husband, Peter, to the annual meeting in Baltimore and introduce him to the AMS community. These dramatic changes have further enabled a number of supportive networks, like our own AMS BRAID and Coriolis.

Kandis: If you asked me 30 years ago what my career would look like, I would have told you a very different story than what I actually experienced. I’ve experienced more changes than I can count — and that is a good thing. Change is inevitable and the best way to embrace your career is to be prepared for change, embrace the unknown, and be a constant learner to build your skills and experience.

Declan: My professional career started just before the pandemic, and there have definitely been changes that I’ve seen since then. For example, people have been more willing to connect with others online, which has helped foster an inclusive space for those who may not encounter accepting spaces in their lives. Also, the pandemic spurred a huge amount of education about the LGBTQ+ community; it’s easier now than ever to take some time and educate yourself about the different parts of the community!

I’m proud of how far AMS and the weather, water, and climate enterprise has come from the time I’ve been involved. I’m also excited about where we can go to make sure we continue to create and support accepting spaces for everyone, both during this Pride month and in the future.

Declan Crowe (with Brad Colman at far right) addressing a packed room at the 15th Annual Coriolis Reception, held at the AMS 104th Annual Meeting.

Mike: I am fortunate to have the support of all my friends and family, as well as (by and large) the community in which I have lived for the last 15+ years. My way of expressing gratitude for this good luck is to help others by being a resource and mentor, when possible. Others did it for me in the past, and now I feel a happy obligation to pay that forward.

What challenges still need to be addressed, both within and outside AMS?

Kandis: Speaking as a Queer Black Woman, intersectionality is a topic that needs much attention. Individuals who belong to multiple marginalized groups — such as people of color, 1st generation graduates, people with disabilities, people marginalized based on their gender or age, and immigrants — add complexity to the conversation and often face compounded discrimination issues related to their intersecting identities. … There are many places and spaces where LGBTQ+ individuals don’t have the same legal protections, are bullied and harassed, face health disparities, are victims of hate crimes, and as a result are at a higher risk of depression, anxiety, substance abuse, and suicide. AMS can be a beacon of light and be a voice to the voiceless for these all-important topics.

Mike: Figuring out who you are, and coming out if you wish, is a challenging but life-affirming experience for many, though some pay a heavy price for it. As the majority, members of the straight community need to be just as vocal and active in their efforts to improve the environment and rights of the members of the LGBTQ+ community, as LGBTQ+ members are. To quote Arthur Ashe: Start where you are. Use what you have. Do what you can.

Tevin: I feel that AMS should be more proactive and vocal in advocating for minority communities. I acknowledge that AMS is standing up for marginalized individuals, but we should be much better at also reaching early childhood and high school individuals, and not being solely a sector for working professionals. In order to change the environment, we must seed and water the foundation.

Declan: Historically, many people haven’t realized the fact that all minority communities face a collective struggle, and it is up to us to work together and fight for what is right. I encourage everyone, particularly within the AMS and other professional societies, to educate themselves on the dangers of ignoring intersectionality, as well as how to listen and amplify voices that have typically been suppressed.

Also, LGBTQ+ people face a huge issue when it comes to having their identities respected, especially our transgender/non-binary communities, who often go by names and pronouns that are not respected in professional spaces. Encouraging everyone, regardless of identity, to identify themselves with their pronouns will help normalize proper pronoun (and name) usage. Additionally, AMS at-large and its members can work to actively educate themselves on the different identities that fall within the LGBTQ+ community, so that they are ready to amplify the voices of community members.

Brad: There are still legal inequalities and workplace discrimination issues, as well as unique and critical healthcare disparities and intersectional challenges, where we still need to make considerable progress. One activity from my tenure as AMS president still stands out in my mind: the Transgender, Non-Binary, Gender Non-Conforming, and Ally Event at the 2023 Annual Meeting in Denver. To listen to these brave individuals share their challenges and life journeys was both educational and inspirational to me.

Another area of remaining challenges has to do with global perspectives. We are by nature a global profession. Many of us travel abroad for conferences and field studies. Sadly, members of the LGBTQ+ community face difficult decisions about traveling to places where they may face violence, persecution, and legal sanctions. As such, efforts to promote global equality and human rights for LGBTQ+ individuals remain ongoing and vital.

What advice would you give other LGBTQ+ people in weather, water, and climate-related fields?

Jerrica: My advice is to be your authentic self because there are lots of people in the AMS who celebrate who you are, and be sure to look for Coriolis events at the annual meetings.

Kandis: First: befriend, network, support, and advocate for people both in and outside of the LGBTQ+ community. 

Second, celebrate your identity and be your true, authentic self at all times. 

Third: be visual and educate yourself about all things weather, water and climate – be an inspiration to others.

Declan: Find a community of LGBTQ+ people and allies wherever you can! It’s nearly impossible to deal with the struggles we face, both as individuals and a community. The good thing is, we don’t have to do it alone! Not every space will be accepting, but whenever you can, live your life to your truest form and find the people that are willing to do that alongside you.

Tevin: To other members of the LGBTQ+ people in the weather, water and climate community, I would say to remember why you’re in this field. Ultimately, it should be to protect vulnerable communities. That’s what matters most … let your expertise and experience be your guide.

Brad: First off, everyone should strive to be authentic and respect both yourself and others by embracing diversity. I recognize this is easy to say but not always easy in real life and I encourage anyone who is struggling with the process of coming out to set their own pace and to seek support if they ever feel it would be beneficial. Not everyone need share this information in their professional life, it is a personal decision. I recognize, however, that those who do so play an important role in supporting others either directly or indirectly. Finally, don’t forget that in the current environment, the large majority of our colleagues are supportive allies.

Mike: Having a support network – even if that’s just one other person – makes navigating all of life’s challenges easier. Invest in yourself by building your network!

Is there anything else you’d like to share?

Kandis: I thank AMS for leading the way to advance the LGBTQ topic for everyone. The Coriolis Committee is sponsoring a webinar to address many of these topics on June 26th – “Ask Me Anything.” I hope everyone takes the time to participate in this all-important topic

Jerrica: To me, pride is about providing a safe place for people to explore and be their authentic selves.

Brad: I’m incredibly excited by how far the LGBTQ+ community has come in the fight for equality and acceptance. While it’s crucial to stand up for our rights and be proud of who we are, it’s equally important to recognize that not everyone may be on the same journey or at the same stage of acceptance. Just as growing comfortable as a gay man was a decades-long journey for me, others in our community and beyond have their own journey and their own pace. We live in a wonderfully diverse world, filled with people from all walks of life, and it’s important that we respect that diversity. Let’s continue to be proud of who we are, [while being] mindful of the impact of our actions on others. Let’s strive to be inclusive, respectful, and supportive of one another, regardless of where we are on our individual journeys. Now, let’s celebrate Pride Month!

Featured image: “Iridescence” by Joshua Intini was an entry in the 2023 AMS Weather Band photo contest.

Pride Month Spotlight: Finding Community

A rainbow over a city, shown from above

June is LGBTQ+ Pride Month. We asked a few members of the AMS community to give us their thoughts on pride, community, history, and the path forward. This is part one of a two-part post.

Our Contributors

Kandis Boyd 

I’ve worked in the federal government since the age of 19 and will celebrate 30 years of continuous service in August 2024. I’ve held over a dozen positions ranging from meteorologist to hydrologist, program manager, subject matter expert, deputy director, and director. I’ve also held positions in the non-profit sector and academia. I have degrees in Public Administration, Meteorology, [and] Water Resources, and certifications in Project Management (PMP) and Logistics, Transportation and Distribution (CLTD). My pronouns are She/Her/Hers and I identify as Queer/PanSexual.

Mike Augustyniak

I’ve been a broadcast meteorologist for WCCO in Minneapolis since 2008, and am an AMS Certified Broadcast Meteorologist and Certified Consulting Meteorologist. I’ve also appeared on The Ellen DeGeneres Show, CBS Evening News, CBS Mornings and the BBC. I received both my Bachelor and Master of Science degrees in atmospheric science from the University at Albany. I am the Outgoing Commissioner on Professional Affairs for AMS. I identify as a gay cis man.

Jerrica Decker

I was born and raised in northwest Ohio. I graduated from OSU with my bachelor of science in 2008 and earned my masters in meteorology from OSU in 2010. I have been a meteorological systems engineer for weatherUSA since 2012. My current work ranges from data management to processing data sources. I am male to female transgender.

Tevin Wooten

I’m currently a morning meteorologist at NBC Boston. I have degrees in broadcast journalism from the University of Arkansas and a meteorology major from Florida State University. Previously, I worked with The Weather Channel as an on-camera meteorologist. I identify as gay and use he/him/his pronouns.

Declan Crowe

I am a recent graduate of NC State University in Raleigh, NC, with degrees in both Meteorology and Spanish. I’m pursuing a path of Emergency Management, and will be attending Millersville University starting in Fall 2024 to earn an MS in Emergency Management. I’ve performed numerous types of research related to both winter weather and tropical meteorology; my work has been featured in the NASA IMPACTS project and at the National Hurricane Center. I identify as gay and genderfluid, and I use he/they pronouns.

Brad Colman

My background includes a nearly 40-year career as an atmospheric scientist in our public sector with NOAA (both in OAR and NWS) and then about a decade in the private sector, ending with Bayer and the Climate Corporation supporting global agriculture. Currently, I’m the 1st past president of the AMS and actively involved in a number of other boards and volunteer activities. I am a gay male with pronouns he/him. While it took a while for me to come to acknowledge it growing up in the 60s and 70s, I now know this was my identity from early childhood.

What has been your experience working on LGBTQ+ issues, or with LGBTQ+ organizations, within or outside AMS?

Tevin: I’m currently on the Culture and Inclusion Cabinet and the current chair of BRAID. The experience is rewarding but it’s also extremely taxing. We are attempting to rewrite several decades of injustice in the weather, water and climate enterprise. Our job is to now interpret and apply forecasts to marginalized communities that have been traditionally overlooked. In my work life, along with meteorology and forecasting, I report climate stories with an environmental justice lens.

Declan: I am currently the Chair of the AMS Coriolis Committee. I came into this role in January, after working with the Committee for a year before. I’ve been very happy to work with such a great group of people who are all dedicated to improving LGBTQ+ visibility and acceptance in AMS. I’ve also had the opportunity to meet a lot of LGBTQ+ community members and allies during my time with Coriolis, who have shared the joys and difficulties with me of being LGBTQ+ in the weather, water, and climate enterprise. These connections have served as motivation for me to continue to extend our outreach and promote acceptance of our community in all spaces.

Kandis: I have served on the Coriolis committee for several years and I have also worked with LGBTQ+ teams/committees in and outside of the workplace. As for my thoughts on the experience, it depended on the space: most LGBTQ+ experiences have been positive, but there is still much work to do because a large sector of our community opts to remain anonymous for safety reasons. The Coriolis group is a great group and I hope that their work will filter into all aspects of the AMS community — using pronouns, all gender bathrooms, and addressing workplace bullying and harassment. Yes, some meetings and events fail to be LGBTQ+-inclusive.

Brad: I have tried to be both supportive of, and be involved with, LGBTQ+ issues and groups in the AMS. It was one of a few personal priorities I set for myself moving into my role as president. We are very fortunate that the AMS has been very proactive in this area. We have the Culture and Inclusion Cabinet, BRAID, and Coriolis. In contrast to my concerns years ago about who might see me at a gay event, I am now both excited to be there and to see many allies from our broader AMS enterprise there as well. At our recent Annual Meeting in Baltimore, I was privileged to speak at the 15-year celebration of Coriolis. Seeing the huge turnout from AMS members of all ages impressed upon me the value of the steady work so many people in our community have done over the decades. 

Jerrica: I am involved with AMS Coriolis and I am on the board for my hometown pride organization. I have done some work with advocacy.

When did you come out in your professional life? What made it easier/harder?

Brad: For me, coming out, especially professionally, was a decades-long process. Through graduate school and my early NOAA career, I only shared this private information with my closest and most trusted colleagues. As I became more comfortable being gay, I expanded my “in-the-know” community. This was challenging and tiring — Who had I told? Who knew via the grapevine? What was I risking by telling? Nonetheless, I was very fortunate and, my personal growth aside, I never felt I experienced discrimination. Eventually I was comfortable sharing this detail with colleagues and friends, and perhaps more importantly, I began to recognize that I might be helping others by sharing this aspect of my life with my professional community.

Kandis: I told myself that I would wait until I reached a certain level in my career before outing myself. I think that was the biggest mistake I made during my 30+ year career, because for so much of my life I led a dual life and constantly had to code-switch to assimilate. It is physically exhausting constantly reshaping your thoughts and actions to meet others’ expectations. So my advice to everyone is to show up and be your true authentic self from Day 1.

Mike: As for many, my coming-out process started in my personal life – family, friends, and eventually co-workers – and occurred over some months. During that process, I found it more challenging to tell long-term acquaintances my truth because, in my mind, I was asking them to readjust their understanding of who I was in a pretty major way, and with very little notice. While peoples’ reactions were almost universally positive and accepting, the process was still stressful for me. Consequently, at the age of 30, when I moved away from my hometown and first two jobs as a broadcaster, I decided to treat my new job and new city as a clean slate – starting from day 1 as “out.” This decision was absolutely the right one for me, and for my new home, where I can proudly represent the LGBTQ community in a very public and positive way.

Jerrica: I came out to my business partner in 2018, and he was very accepting.

Tevin: While I’ve always identified as queer, I came out mid-early career. This was strategic but also out of fear. Because my career is public facing, coming out has made it much easier to relate to viewers and my audience, and show that it’s okay to be my authentic self.

Declan: I’ve been lucky to have been out my entire professional life, but to varying levels depending on the situation. One of the things that has made being out easier has been surrounding myself with LGBTQ+ community members and allies who contribute to supportive and uplifting spaces. Obviously I’m not able to do this all the time, but when I do, I find that I am able to thrive both personally and professionally. In the same token, being around closed-minded individuals often makes it harder to express myself fully, particularly when these individuals have a lot of sway in my future career path.

What was it like finding your LGBTQ+ community, and why is that important?

Mike: AMS has provided a sense of belonging for me in multiple ways, an important one being the vibrant LGBTQ+ community within. For me, the chance social interactions that take place at AMS conferences and meetings have made the biggest impact. Realizing that an admired scientist has more in common with you than just your chosen field has been a very powerful thing. It *was* difficult to find my LGBTQ+ community in the early days of my career. Whether it was the era (early 2000s), my geographic location, my mindset – or, more likely, a combination of all these factors. I am grateful for those doing the work to expand and make the community more visible and welcoming. It has been my goal to be a small part of that change.

Tevin: I’ve had an overall positive experience. A lot of that is self-induced, because I try give off good energy, in hope that it returns. But I also try not to give attention to negativity.

Brad: Across many AMS programs and meetings I get to experience firsthand an active and engaged LGBTQ+ community that is the result of the hard work and commitment of many AMS members and staff over many years. Needless to say, they are a fun and welcoming group!  Today’s experience contrasts sharply with my experience decades ago when there wasn’t a welcomed LGBTQ+ community. Any gatherings were done in secret and privately arranged. Early efforts to publicly organize were resisted.

Jerrica: In my experience it has been very easy to find LGBTQ+ community within the AMS and in central Ohio.

Declan: I’ve had many positive experiences where I’ve felt connected to the LGBTQ+ community within AMS. During the pandemic the Coriolis Reception was held on Zoom. Before I knew it, I felt like I was reconnecting with a bunch of old friends who understood the joys and difficulties of being part of the LGBTQ+ community. I’ve stayed in touch with many people I met in that Zoom call!

At times, it can be very difficult to find an LGBTQ+ community, particularly in smaller spaces where the focus is not on identities. Obviously, not every conversation needs to revolve around identities; however, I believe it would make it easier to find an LGBTQ+ community in every space if identities became a more common subject in weather, water, and climate spaces.

Join us next week for Part 2!

Featured image credit: Asker Ibne Firoz, “Rainbow over the city,” entry to 2023 Weather Band Photo Contest.

Bumpy Flight into Hurricane Ian Births a New Metric for Turbulence

Airplane over hurricane

A research spotlight from the 36th Conference on Hurricanes and Tropical Meteorology

NOAA’s WP-3D Orion “Hurricane Hunter” aircraft are no strangers to turbulence. Reconnaissance flights through hurricanes are by definition a tad bumpy.

A viral video taken aboard the Hurricane Hunter “Kermit” (NOAA42) as it flew through Hurricane Ian on 28 September, 2022, however, shows that even its experienced crew were shaken.

In the video, equipment is shown having fallen to the floor of the aircraft (“There goes the sondes!”), and after a camera-shaking bump, the crew can be heard reassuring each other, “We’re alright.”

Part of video of Hurricane Hunter flight into Hurricane Ian, September 28, 2022. Video courtesy of Nick Underwood.

“I’ve been flying hurricanes with NOAA for the last six years, and that was the worst flight that I’ve been on so far,” NOAA Programs and Integration Engineer Nick Underwood (who filmed the video) told MSNBC the next day. “We were coming through the western side of Hurricane Ian, it was intensifying up to its peak Category 4 strength, and we really got bounced around.”

As it turns out, the flight may have been the most turbulent ever on a Hurricane Hunter aircraft, at least in the past 20 years. In a study presented by Joshua Wadler of Embry-Riddle Aeronautical University at the 36th Conference on Hurricanes and Tropical Meteorology, researchers came up with new metrics to better quantify turbulence as experienced by an aircraft’s occupants—and ranked the top ten flights in Hurricane Hunter history.

“It was probably about ten minutes of really extreme turbulence,” said Wadler in his presentation during the “Innovative Observing Technologies to Advance Tropical Cyclone Operations and Research VI” session. As part of the flight crew, Wadler was on the team in charge of the Altius-600 small uncrewed aircraft system’s first-ever deployment into a hurricane.

“We were talking on the mission and we [thought], well, is this the bumpiest flight ever?” Wadler said. A few of the crew who had been flying such missions for decades seemed to think so. “We were like, okay, let’s try to figure it out.”

A bumpiness equation

Aside from corroborating hurricane researchers’ harrowing tales, understanding turbulence is becoming increasingly important given its predicted increase due to climate change, and with recent incidents including the death of a passenger during an exceptionally turbulent Singapore Airlines flight. Metrics for turbulence already exist, but most of those only represent vertical motion and focus on atmospheric properties rather than what happens to occupants. “We wanted … to have a 3-D turbulence metric, and one that describes the human experience,” said Wadler. 

When an aircraft rapidly accelerates  vertically or horizontally, everyone feels the dizzying rise or stomach-clenching drop. But if the aircraft rotates around its center of gravity in any direction, that acceleration will have different effects depending on where someone is seated–for example, when the aircraft tilts (or pitches) upward the people in the front of the aircraft will feel an upward acceleration while the people in the back will feel a downward acceleration. If the plane is also accelerating upwards, such as during takeoff, those in the front will experience a “double whammy” of acceleration. As Wadler noted, “Every seat on the plane experiences different rotational motions depending on where you are.”

Wadler and colleagues’ new “bumpiness” metric accounts for those differences. 

The research team combined flight-level data from all P-3 flights since 2004 (when high-enough-quality data became available). They calculated the acceleration forces acting on each seat in the plane relative to the plane’s center of gravity.

They defined the flight’s “bumpiness” by combining acceleration with jerk (the rate of change in acceleration over time), accounting for both in all three dimensions. This equation can be applied to any aircraft where the center of gravity and relative positions of the seats are known, and for which high-quality flight-level data are available. 

Bumpiness equation
Wadler and colleagues’ equation for defining “bumpiness” (B) in meters per second squared (m/s2).
Pilot's bed on floor

Their equation accounts equally for bumpiness in all directions, although it can be thrown off by sharp turns. Missions in which the plane turned sharply on purpose (for example, to calibrate instruments) were excluded from the team’s calculations.

Because the end result, the B or bumpiness value, values all dimensions of movement equally, it doesn’t always sync with what people expect. Some Twitter commenters belittled the video from the flight, possibly because it shows few large up-and-down bumps. The main types of motion experienced by the mission’s crew, however, were front-to-back and side-to-side.

<< The off-duty pilot’s bed was thrown from its bunk onto the floor during flight 20220928H1 into Hurricane Ian, due to lateral motion of the aircraft. Photo courtesy of Jake Barlow.

The bumpiest hurricane flights

The researchers calculated the top 10 bumpiest flights for each of the seats on the plane, based on the most turbulent part of each mission. 

WP-3D Orion seat map
Seat map of WP-3D Orion Hurricane Hunter aircraft. Image: Josh Wadler.

For the person in seat 1 (the “pilot flying,” in the front left seat on the plane), the Hurricane Ian flight was in fact the bumpiest by far—with a B value of 6.04 m/s2, 34% bumpier than any other flight for which good data were available. The second highest B value was experienced during Hurricane Irma in 2017 (B value: 4.5 m/s2), the third by a flight into Hurricane Sam in 2021 (B value: 4.39 m/s2). Subjective rankings from surveyed flight crews came up with a wide range of answers about their bumpiest flights, but were roughly in the same ballpark as those calculated by B value.

RankStorm NameMission IDMaximum Bumpiness Value (m/s2)
1IAN20220928H16.04
2IRMA20170908H24.50
3SAM20210929H24.39
4LANE(EP)20180822H14.28
5FELIX20070902H14.27
6DORIAN20190830H24.08
7PATRICIA(EP)20151023I14.05
8RAFAEL20121015H14.02
9GONZALO20141017I13.90
10DORIAN20190904H13.70
Rankings of B values for Hurricane Hunter flights since 2004, for the pilot in seat 1.

On the Hurricane Ian mission, the greatest B value (6.13 m/s2) was experienced by the second pilot, sitting in seat 2. Wadler was in seat 10. “I was very fearful during this mission,” he noted during his presentation. But, “lo and behold, my seat had the lowest [bumpiness] value by far.” The pilot in seat 1 experienced 37% worse turbulence than Wadler’s seat in the middle of the plane (6.04 m/s2 vs. 4.4 m/s2).

Seatmax Bumpiness (m/s2)
16.04
26.13
36.02
45.87
55.52
65.68
75.03
85.08
94.79
104.4
114.46
124.45
134.54
144.52
154.45
164.53
174.51
184.59
194.55
Rankings of B values for all seats on the Hurricane Hunter flight 20220928H1.

For seat 1, the Ian flight (Flight 20220928H1) ranked above all other flights for back-front and lateral motion. Yet in terms of up-down motion, a mission during Hurricane Lane ranked far higher, with a vertical B value of 17.1; Ian’s highest vertical B value was 8.43, ranking it seventh in terms of vertical motion. When all metrics are combined, however, the Ian flight came out on top. “It’s normal to have vertical bumps with eyewall updrafts and downdrafts,” Wadler noted in a later conversation, “but the lateral motions are rare. … The dropsondes went all over the cabin.”

Currently the bumpiness rankings only count the highest B value experienced during a flight. In future work, the research team aims to develop an equation that can account for cumulative bumpiness over time—a “queasiness index.” We’re well on the way to finding out what flights would make even the most iron-stomached hurricane hunter, in Wadler’s words, “very happy to be on the ground.”

Want to know more about what it’s like to fly a research mission into a hurricane? Take a virtual tour of a Hurricane Hunter aircraft “Miss Piggy.”

Header photo: View from NOAA WP-3D Hurricane Hunter aircraft “Kermit” during flight 20220928H1 into Hurricane Ian. Photo courtesy of Joshua Wadler.

About 36Hurricanes

The 36th Conference on Hurricanes and Tropical Meteorology brought together hundreds of hurricane researchers, modeling experts, forecasters, emergency managers, communicators, and more May 6-10, 2024, in Long Beach, California to discuss the latest in tropical cyclones and other tropical weather phenomena. It was hosted by the AMS Committee on Tropical Meteorology and Tropical Cyclones.

You can view the online program here. All conference presentations will become available to the public starting in August 2024.

Asian American and Pacific Islander Heritage Month Spotlight: Dr. Syukuro “Suki” Manabe

By Anjuli S. Bamzai, AMS President

My graduate advisor at George Mason University, Dr. Jagadish Shukla, displayed the photos of four meteorologists in his office: Drs. Norman A. Phillips, Jule Charney, Edward Lorenz, and Syukuro “Suki” Manabe. All giants in their field, they had been his PhD advisers at Massachusetts Institute of Technology (MIT). In the 1990s, as I pursued my graduate degree at Dr. Shukla’s Center for Ocean-Land-Atmosphere Studies (COLA), the scientific family tree remained strongly connected, and so I in turn had the chance to cross paths with luminaries like Manabe in person.

Suki Manabe photo

Circa 1994, I had the privilege of hearing Manabe–or, as I came to refer to him, Suki-san–give the inaugural talk at the newly established COLA. He spoke about the use of dynamical general circulation models to study the atmosphere and its coupling to land, using a simple ‘bucket’ model to discover emergent properties of this complex, chaotic system. He was an animated speaker; it was apparent that he was driven by curiosity and sheer love of the science that he was pursuing.

I was inspired by his ability to explain the properties of such a complex system as the Earth in such elegant terms. Suki-san’s clarity and scientific passion resulted in contributions to our understanding of climate the importance of which cannot be overstated. As I began my own foray into Earth system science, those initial interactions were a formative experience.

Left: Suki-san enjoying his work. Photo courtesy of Dr. V. Ramaswamy.

The models he used were relatively simple compared to the complex Earth system models of today. Yet Manabe and Wetherald (1967), published in the AMS’s Journal of the Atmospheric Sciences, is arguably one of the most influential papers in climate science. It demonstrated a key feature of the atmosphere with an increase in carbon dioxide: rising temperatures closer to the ground while the upper atmosphere got colder. If the variation in solar radiation was primarily responsible for the temperature increase, the entire atmosphere would have gotten warmer.

Graphic from Phys.org, based on Manabe and Wetherald (1967), Figure 16, “Vertical distributions of temperature in radiative convective equilibrium for various values of CO2 content.”

The work that Suki-san and his team conducted comprised a major component of the 1979 report, “Carbon dioxide and climate: A scientific assessment.” Led by Jule Charney from MIT, it is now commonly referred to as the Charney Report. The main result of the succinct 22-page report was that “the most probable global warming for a doubling of [atmospheric] CO2 [is] near 3°C with a probable error of ± 1.5°C.” Perhaps most importantly, the report ruled out the possibility that increasing CO2 would have negligible effects. This estimate of climate sensitivity has pretty much withstood the test of time; in the past forty years, annual average CO2 concentrations increased by ~ 21% and the global average surface temperature increased by ~0.66°C. How prescient!

Suki-san was one of the panelists who shared their insights at a session that the National Academy of Sciences’ Board on Atmospheric Sciences and Climate (BASC) convened during its November 2019 meeting to commemorate the 40th anniversary of the Charney Report. Suki-san’s concluding slide pretty much summed up his philosophy: make your model just as complicated as it needs to be, no more. (See photo below.)

Panelists photo and concluding slide. Slide text says, "Concluding Remarks: 
[Bullet point one] Satellite observation of outgoing radiation over annual and inter-decadal time scale should provides macroscopic constraint that is likely to be useful for reducing large uncertainty in climate sensitivity.
[Bullet point two] It is desirable to make parameterization of subgrid-scale process 'as simple as possible', because simpler parameterization is more testable."
Left: Panelists at the November 21, 2019 session on The Charney Report: Reflections after 40 years at the BASC meeting. (Left to right) Drs. Jagadish Shukla, former student of Jule Charney; D. James Baker, member of the original authoring committee; Jim Hansen and Syukuro Manabe, major contributors to the original report; and John Perry, staff lead for the report. Right: Dr. Manabe’s final slide at the Charney Report session at BASC. Photos courtesy of Anjuli Bamzai.

October 5, 2021, was such an exciting day to wake up to! The Nobel Prize in Physics was shared by Drs. Syukuro Manabe, Klaus Hasselman, and Giorgio Parisi. The citation reads: “The Nobel Prize in Physics 2021 was awarded for groundbreaking contributions to our understanding of complex physical systems” with one half jointly to Syukuro Manabe and Klaus Hasselmann “for the physical modelling of Earth’s climate, quantifying variability and reliably predicting global warming,” and the other half to Giorgio Parisi “for the discovery of the interplay of disorder and fluctuations in physical systems from atomic to planetary scales.”

As he eloquently stated on the momentous day that he received the Nobel Prize, “I did these experiments out of pure scientific curiosity. I never realized that it would become a problem of such wide-ranging concern for all of human society.”

The accompanying press release on the Nobel Prize particularly cites Suki-san’s work at NOAA in the 1960s, noting that “he led the development of physical models of the Earth’s climate and was the first person to explore the interaction between radiation balance and the vertical transport of air masses. His work laid the foundation for the development of current climate models.”

Left: Event to honor Nobel Laureate Dr. Suki Manabe at National Academy of Sciences. (Left to right) Drs. Jagadish Shukla, Suki Manabe and Marcia McNutt, President National Academy of Sciences. Photo courtesy of Dr. J. Shukla. Right: (Left to right) Drs. V. Ramaswamy, Director, NOAA GFDL, Suki Manabe, and Whit Anderson, Deputy Director, NOAA GFDL, celebrating the big news of Suki-san’s Nobel Prize, October 2021. Photo courtesy of Dr. V. Ramaswamy.

It is no exaggeration to state that the modeling findings by Suki Manabe and, about a decade later, Klaus Hasselman, opened not only an era of climate modeling but also an entirely new subfield of climate science, viz., detection and attribution (D&A) through fingerprinting and other techniques. Observations have provided an important reality check to model simulations through these D&A efforts.

The current torchbearers of the D&A tradition are Drs. Ben Santer, Tim DelSole, Reto Knutti, Francis Zwiers, Xuebin Zhang, Gabi Hegerl, Claudia Tebaldi, Jerry Meehl, Phil Jones, David Karoly, Peter Stott MBE, Tom Knutson, and Michael Wehner, among others. Over the years several of them have also gone on to receive AMS awards—including, in Meehl’s case, the Jule G. Charney Medal. Speaking of awards, Jonathan Gregory is the most recent recipient of AMS’s Syukuro Manabe Climate Research Award, which has also been bestowed on Drs. Joyce Penner and Cecilia Bitz. Next year, consider nominating someone for the Manabe Award, the Charney Medal, or the new Jagadish Shukla Earth System Predictability Prize!

Those of us in the atmospheric and related sciences benefit directly from Suki Manabe’s scientific legacy and intellectual passion, and all of human society owes Suki-san a great debt for helping us to understand climate change, one of the greatest challenges humankind has ever faced.

Anjuli is grateful to Katherine ‘Katie’ Pflaumer for providing useful edits.

Asian American and Pacific Islander Heritage Month Spotlight: Dr. Tetsuya “Ted” Fujita

Tidal Basin with cherry blossoms and ducks (NPS photo)

By AMS President Anjuli S. Bamzai

Blossoming cherry trees are stars of springtime in Washington, D.C., and the most popular place to visit the cherry blossom trees is the Tidal Basin. Their bloom is one of the most joyful events of the year, awaited with much anticipation by tourists, meteorologists, local businesses, and the National Park Service.

Celebrating the friendship between the Japanese and American peoples, the Tidal Basin cherry trees were a gift from the Mayor of Tokyo to the United States in 1912. While the precise timing of peak bloom varies from year to year (April 4 on average, driven largely by winter/early spring temperatures), peak bloom has been occurring earlier due to warming trends. Furthermore, a combination of rising sea level and sinking land has necessitated plans for a new seawall that requires many existing trees to be removed. Yet the government of Japan has promised new trees to replace those that were lost.

This year’s beautiful blossoms strongly reminded me of the remarkable contributions of Japanese Americans — in particular Japanese American meteorologists. Our science would be especially bereft without the contributions of several scientists who, after receiving their advanced degrees at the University of Tokyo in the so-called “Syono school” of dynamic meteorology, immigrated to the U.S. from postwar Japan. Among them were Tetsuya Fujita, Akio Arakawa, Akira Kasahara, Kikuro Miyakoda, Takio Murakami, Katsuyuki Ooyama, Michio Yanai, and of course, Syukuro ‘Suki’ Manabe, one of the three recipients of the Nobel Prize in Physics in 2021.

Celebrating AAPI Heritage Month, in this post I chose to showcase the contributions of the legendary Dr. Tetsuya Theodore ‘Ted’ Fujita. Nicknamed “Mr. Tornado,” he linked tornado damage with wind speed and in 1971, developed the Fujita scale for rating tornado intensity based on ground and/or aerial damage surveys. He is also recognized as the discoverer of downbursts and microbursts, which are serious potential threats to aviation safety. Thus his discoveries made aviation safer.

Fujita (left) with John McCarthy, Inaugural Director of NCAR-RAP/RAL, in 1982. After studying tornadoes for over two decades, Fujita had just seen his first one in person. Photo: Texas Tech, found in Fujita’s memoir, “Memoirs of an Effort to Unlock The Mystery of Severe Storms During the 50 Years, 1942–1992,” in the Texas Tech Southwest Collection/Special Collections Library.

But let’s take a step back. How did Fujita get interested in tornadoes in the first place? In part, his involvement was yet another legacy of the Manhattan Project: Fujita began his life’s work studying damage in Hiroshima and Nagasaki in the aftermath of the atomic bombs.

Fujita was working as assistant professor in physics at Meiji College of Technology in Tobata, exactly halfway between the two cities. A couple of years earlier, in compliance with his dying father’s wishes, he had opted to go to Tobata for his studies in mechanical engineering rather than Hiroshima. In the month following the bombings, Fujita and his team of students went on an observational mission to study the blast zones at both sites. At Nagasaki, through studying the burn marks of various objects, Fujita had the goal of estimating the position of the atomic bomb when it exploded. At ground zero, most trees, though scarred black by radiation, were still standing upright while buildings were in ruins. Seen from above, it looked like a giant starburst pattern.

After WWII ended, he joined the University of Chicago. By a stroke of genius, the Japanese American meteorologist was able to draw comparisons between severe weather and the nuclear shock waves he had studied some twenty-five years earlier at Hiroshima and Nagasaki, through studying the debris and damage of tornadoes before cleanup. He led the development of the Fujita Scale to categorize tornado intensity, a modified version of which remains in use today.

Following the Super Outbreak of 3–4 April, 1974, which covered over 2,600 miles and produced nearly 150 tornadoes in an 18-hour period, Fujita carried out aerial and ground damage surveys covering over 10,000 miles. Through meticulous analysis of the observational data, he demonstrated the existence of smaller tornadoes — suction vortices — within the parent tornado. The aerial surveys also led to the discovery of microbursts.

Photo: Dr. Fujita as a professor of Geophysical Sciences at the University of Chicago, photo taken in April 1961. Special Collections Research Center, University of Chicago Library.

You can read more about his discovery of the downburst and its contributions to aviation safety (including his work as a principal investigator for the National Intensive Meteorological Research On Downburst [NIMROD] project) here.

In 2000, two of his former students organized the “Symposium on the Mystery of Severe Storms: A Tribute to the work of T. Theodore Fujita,” held at the 80th AMS Annual meeting. They were none other than Gregory S. Forbes from The Weather Channel and Roger M. Wakimoto from UCLA, both distinguished meteorologists in their own right. Roger was of course our AMS President in 2017–2018. The photo below shows the three of them at an event at the University of Chicago from the early 1980s.

Dr. Roger Wakimoto (left), Dr. Ted Fujita (middle) and Dr. Gregory Forbes (right), taken in the early 1980s when all were at the University of Chicago. Photo Courtesy of Roger Wakimoto, honorary member of the AMS.

You can read the proceedings of the Symposium here to get a fuller sense of Fujita’s immense contributions to atmospheric science. In this short piece, I have barely scratched the surface.

You can also learn about Fujita through the PBS American Experience series, which describes events and people who have shaped the landscape over the course of history. Fujita is profiled in the episode titled, “Mr. Tornado.”

Featured image: Cherry blossoms surround the Tidal Basin in Washington, D.C. Photo: National Park Service, Kelsey Graczyk

Anjuli is grateful to Katherine ‘Katie’ Pflaumer for providing useful edits.

SunSketcher (Part 2): Ordinary People Become Solar Eclipse Scientists for a Day

Eclipse sequence through sculpture

Guest post by Gordon Emslie (Western Kentucky University) and Hugh Hudson (University of Glasgow)

During the 2024 North American solar eclipse, a pioneering project aimed to use citizen-science smartphone data to help determine the true shape and size of the sun. How did it turn out? This is part two of a two-part post. Read part one here.

Eclipse-day weather

The SunSketcher program required clear skies, and during the wait for our rapidly approaching, astronomically imposed deadline, the national weather patterns were not looking good. About two days in advance, the predicted region of cloud cover did a remarkable, and indeed seemingly contrived, job of tracing the eclipse path all the way from Mexico to Vermont, with only New Hampshire and Maine mercifully spared.

Weather forecasts for eclipse day. Note the almost surreal way in which the forecast area of clouds tracks the path of totality. Left: Forecast cloud cover a couple of days before the eclipse (April 4), with yellow regions showing clearer skies, and black regions denoting cloudy skies (data from ECMWF IFS HRES model, image from Weather.US). Right: National Weather Service weather forecast from April 7, 2024, for afternoon of April 8, 2024. Purple lines indicate path of totality. Graphic: NWS Weather Prediction Center on Twitter.

Despite the gloom, we reportedly had some coverage from about 80% of the users, and we may be able to use much of the data from partially covered sites. (This remains to be assessed as a part of our data analysis.) As often happens during an eclipse, the drastic and sudden cooling of the lower atmosphere, and resulting drop in the ambient lapse rate, resulted in a seemingly magical parting of the clouds for many observers, including one of the authors stationed in Dallas, TX. The other author was at New Harmony, IN, on the banks of the Wabash river between Indiana and Illinois, and was able to witness the entire eclipse without a single cloud in the sky (see featured image at top of post).

Initial analysis of data from the 2024 eclipse

Over 35,000 users downloaded the SunSketcher app and activated it on eclipse day.1 The first user’s data upload from the SunSketcher app proved to be excellent. Here we show the observed variation of the total brightness in each of the 101 images uploaded.

Observed variation of the total brightness across 101 images taken by one SunSketcher app user around the time of eclipse totality, April 8, 2024. Left, the total signal in each of the 101 images (the central image has a longer exposure time); right, an expanded view around the time of second contact. The Baily’s Bead will be just at the intersection between the bright sliver of the partial eclipse at the left edge, and the base level of the corona itself at the bottom.

Our task in data analysis is to make detailed measurements of each user’s data in comparison with the LOLA archive prediction, thus allowing progressive adjustment of the assumed solar profile, culminating in a measurement of the height of the solar limb with the highest precision yet achieved. The redundancy of the 35,000 sets of data will let us explore the shape of the Sun and characterize its distortions (such as the oblateness) better than ever before. Contributions from along the path may allow us to search for time variations on time scales of an hour, which would be another first. The great length of the eclipse path will have produced coverage across the track, essential for detecting Baily’s Beads at different azimuthal angles around the Sun/Moon periphery.

1 Because we intentionally did not upload Personally Identifiable Information, we have no idea who these 35,000 citizen scientists were. [We do know, however, that the data presented in Figure 1 was obtained from a phone located in northeastern Ohio.] Nevertheless, they know who they are, and we thank them all for their valuable (and, in all cases, unique) contributions to the SunSketcher project.

Future work

The single “snapshot” of 2024 will have measured the solar oblateness, but we can be sure that effects related to solar magnetism will be evident on time scales of years. Given the success of the SunSketcher app project in 2024, the logical next step is to search for solar-cycle effects on the shape of the solar disk, using succeeding eclipses. For the eclipses of 2026 (the track of which includes Eastern Greenland, Western Iceland, and Northern Spain) and 2027 (Southern Spain, Gibraltar, Algeria, Libya, Egypt, Saudi Arabia and Yemen) we will refine our techniques, for example shifting to “burst mode” photography to improve time resolution around the critical times of second and third contact. We will need to deal with making the app available in different languages, and with legal issues regarding user privacy and international transfer of data. We may also implement a very simple scheme of color selection to help reject contributions from the sun’s reddish chromosphere layer. (Indeed the 2024 eclipse had a very visible pink/red chromospheric prominence, as reported by many observers and as shown below.)

Totality during the 2024 April 8 eclipse, as viewed from New Harmony, IN. Note the conspicuous pink-colored chromospheric prominence at the bottom of the solar disk, near the white-light Baily’s Bead. Credit: Clinton Lewis/WKU.

Closing thoughts

The SunSketcher project is unlike any other science project we have ever conducted. Its blend of technology, functionality, and aesthetics, its absolute dependence on the participation of ordinary people as “citizen scientists,” and the inexorable path toward an absolutely rigid project deadline made for an interesting few months. We are elated that the weather cooperated to an extent far greater than feared in the days leading up to the eclipse, and, given the impossibility of actual “field testing” during other total eclipses, that the app worked as well as it seems to have done. 

We have been privileged to be part of an endeavor that introduced tens of thousands of members of the public to participation in solar science. Having taken our collective deep breath, it is time to move on to future eclipses, and the insights into the structure of our nearest star that a lengthy program of SunSketcher observations will ultimately reveal.

You can learn more about SunSketcher at http://sunsketcher.org/.

Featured image: A montage of eclipse stages during the 2024 April 8 eclipse, as viewed through a propitiously erected metal sculpture in New Harmony, IN. This image was also used on the NASA website. Credit: Clinton Lewis/WKU.