Bumpy Flight into Hurricane Ian Births a New Metric for Turbulence

Airplane over hurricane

A research spotlight from the 36th Conference on Hurricanes and Tropical Meteorology

NOAA’s WP-3D Orion “Hurricane Hunter” aircraft are no strangers to turbulence. Reconnaissance flights through hurricanes are by definition a tad bumpy.

A viral video taken aboard the Hurricane Hunter “Kermit” (NOAA42) as it flew through Hurricane Ian on 28 September, 2022, however, shows that even its experienced crew were shaken.

In the video, equipment is shown having fallen to the floor of the aircraft (“There goes the sondes!”), and after a camera-shaking bump, the crew can be heard reassuring each other, “We’re alright.”

Part of video of Hurricane Hunter flight into Hurricane Ian, September 28, 2022. Video courtesy of Nick Underwood.

“I’ve been flying hurricanes with NOAA for the last six years, and that was the worst flight that I’ve been on so far,” NOAA Programs and Integration Engineer Nick Underwood (who filmed the video) told MSNBC the next day. “We were coming through the western side of Hurricane Ian, it was intensifying up to its peak Category 4 strength, and we really got bounced around.”

As it turns out, the flight may have been the most turbulent ever on a Hurricane Hunter aircraft, at least in the past 20 years. In a study presented by Joshua Wadler of Embry-Riddle Aeronautical University at the 36th Conference on Hurricanes and Tropical Meteorology, researchers came up with new metrics to better quantify turbulence as experienced by an aircraft’s occupants—and ranked the top ten flights in Hurricane Hunter history.

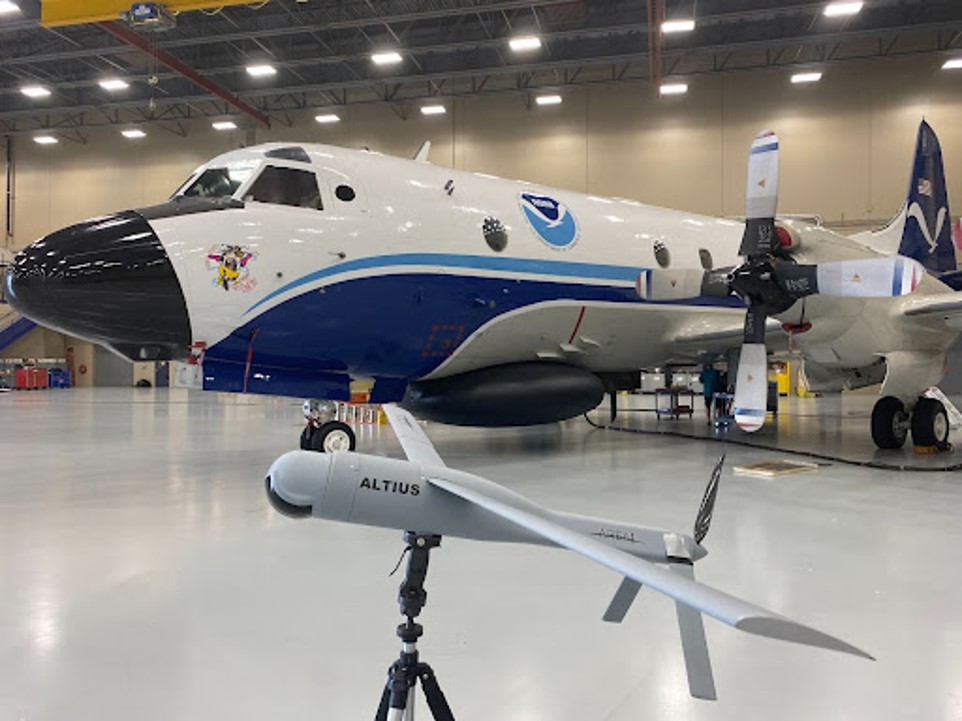
“It was probably about ten minutes of really extreme turbulence,” said Wadler in his presentation during the “Innovative Observing Technologies to Advance Tropical Cyclone Operations and Research VI” session. As part of the flight crew, Wadler was on the team in charge of the Altius-600 small uncrewed aircraft system’s first-ever deployment into a hurricane.

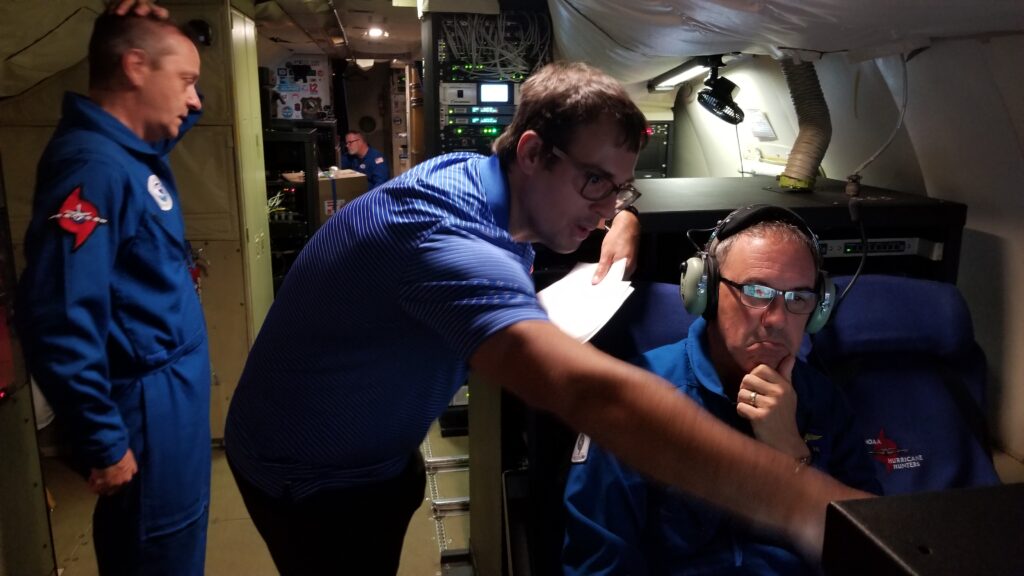
“We were talking on the mission and we [thought], well, is this the bumpiest flight ever?” Wadler said. A few of the crew who had been flying such missions for decades seemed to think so. “We were like, okay, let’s try to figure it out.”

A bumpiness equation

Aside from corroborating hurricane researchers’ harrowing tales, understanding turbulence is becoming increasingly important given its predicted increase due to climate change, and with recent incidents including the death of a passenger during an exceptionally turbulent Singapore Airlines flight. Metrics for turbulence already exist, but most of those only represent vertical motion and focus on atmospheric properties rather than what happens to occupants. “We wanted … to have a 3-D turbulence metric, and one that describes the human experience,” said Wadler. 

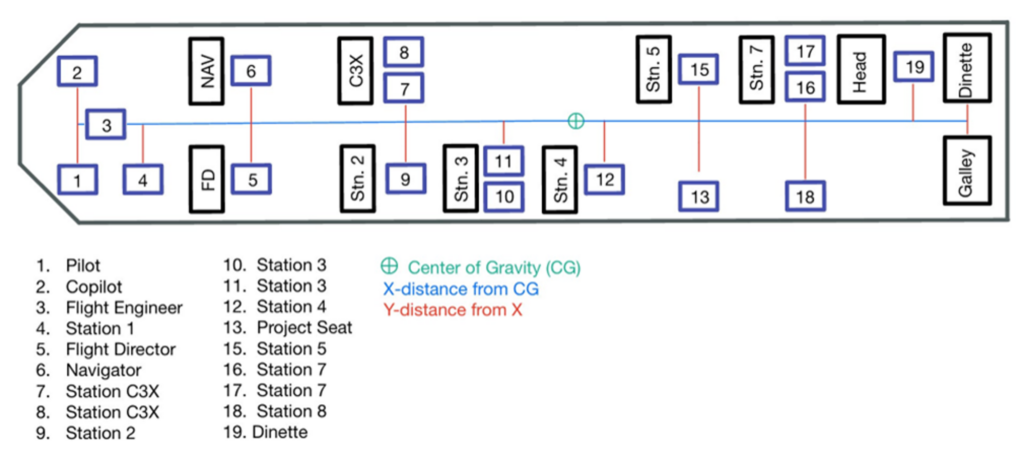
When an aircraft rapidly accelerates  vertically or horizontally, everyone feels the dizzying rise or stomach-clenching drop. But if the aircraft rotates around its center of gravity in any direction, that acceleration will have different effects depending on where someone is seated–for example, when the aircraft tilts (or pitches) upward the people in the front of the aircraft will feel an upward acceleration while the people in the back will feel a downward acceleration. If the plane is also accelerating upwards, such as during takeoff, those in the front will experience a “double whammy” of acceleration. As Wadler noted, “Every seat on the plane experiences different rotational motions depending on where you are.”

Wadler and colleagues’ new “bumpiness” metric accounts for those differences. 

The research team combined flight-level data from all P-3 flights since 2004 (when high-enough-quality data became available). They calculated the acceleration forces acting on each seat in the plane relative to the plane’s center of gravity.

They defined the flight’s “bumpiness” by combining acceleration with jerk (the rate of change in acceleration over time), accounting for both in all three dimensions. This equation can be applied to any aircraft where the center of gravity and relative positions of the seats are known, and for which high-quality flight-level data are available. 

Bumpiness equation
Wadler and colleagues’ equation for defining “bumpiness” (B) in meters per second squared (m/s2).
Pilot's bed on floor

Their equation accounts equally for bumpiness in all directions, although it can be thrown off by sharp turns. Missions in which the plane turned sharply on purpose (for example, to calibrate instruments) were excluded from the team’s calculations.

Because the end result, the B or bumpiness value, values all dimensions of movement equally, it doesn’t always sync with what people expect. Some Twitter commenters belittled the video from the flight, possibly because it shows few large up-and-down bumps. The main types of motion experienced by the mission’s crew, however, were front-to-back and side-to-side.

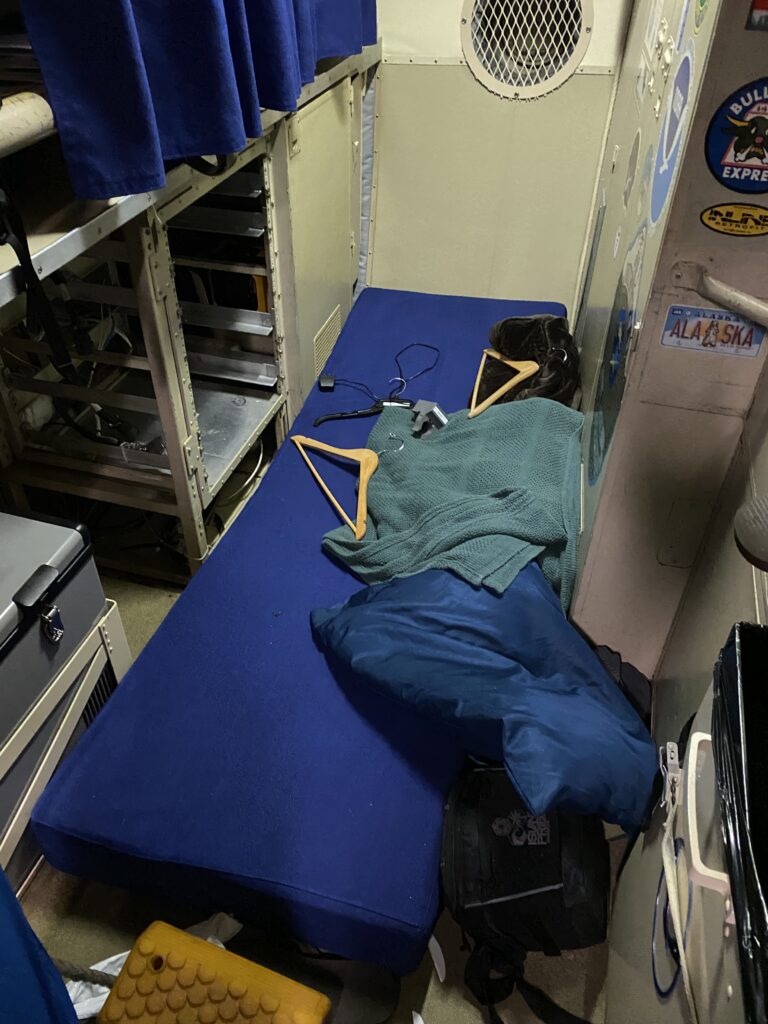
<< The off-duty pilot’s bed was thrown from its bunk onto the floor during flight 20220928H1 into Hurricane Ian, due to lateral motion of the aircraft. Photo courtesy of Jake Barlow.

The bumpiest hurricane flights

The researchers calculated the top 10 bumpiest flights for each of the seats on the plane, based on the most turbulent part of each mission. 

WP-3D Orion seat map
Seat map of WP-3D Orion Hurricane Hunter aircraft. Image: Josh Wadler.

For the person in seat 1 (the “pilot flying,” in the front left seat on the plane), the Hurricane Ian flight was in fact the bumpiest by far—with a B value of 6.04 m/s2, 34% bumpier than any other flight for which good data were available. The second highest B value was experienced during Hurricane Irma in 2017 (B value: 4.5 m/s2), the third by a flight into Hurricane Sam in 2021 (B value: 4.39 m/s2). Subjective rankings from surveyed flight crews came up with a wide range of answers about their bumpiest flights, but were roughly in the same ballpark as those calculated by B value.

RankStorm NameMission IDMaximum Bumpiness Value (m/s2)
1IAN20220928H16.04
2IRMA20170908H24.50
3SAM20210929H24.39
4LANE(EP)20180822H14.28
5FELIX20070902H14.27
6DORIAN20190830H24.08
7PATRICIA(EP)20151023I14.05
8RAFAEL20121015H14.02
9GONZALO20141017I13.90
10DORIAN20190904H13.70
Rankings of B values for Hurricane Hunter flights since 2004, for the pilot in seat 1.

On the Hurricane Ian mission, the greatest B value (6.13 m/s2) was experienced by the second pilot, sitting in seat 2. Wadler was in seat 10. “I was very fearful during this mission,” he noted during his presentation. But, “lo and behold, my seat had the lowest [bumpiness] value by far.” The pilot in seat 1 experienced 37% worse turbulence than Wadler’s seat in the middle of the plane (6.04 m/s2 vs. 4.4 m/s2).

Seatmax Bumpiness (m/s2)
16.04
26.13
36.02
45.87
55.52
65.68
75.03
85.08
94.79
104.4
114.46
124.45
134.54
144.52
154.45
164.53
174.51
184.59
194.55
Rankings of B values for all seats on the Hurricane Hunter flight 20220928H1.

For seat 1, the Ian flight (Flight 20220928H1) ranked above all other flights for back-front and lateral motion. Yet in terms of up-down motion, a mission during Hurricane Lane ranked far higher, with a vertical B value of 17.1; Ian’s highest vertical B value was 8.43, ranking it seventh in terms of vertical motion. When all metrics are combined, however, the Ian flight came out on top. “It’s normal to have vertical bumps with eyewall updrafts and downdrafts,” Wadler noted in a later conversation, “but the lateral motions are rare. … The dropsondes went all over the cabin.”

Currently the bumpiness rankings only count the highest B value experienced during a flight. In future work, the research team aims to develop an equation that can account for cumulative bumpiness over time—a “queasiness index.” We’re well on the way to finding out what flights would make even the most iron-stomached hurricane hunter, in Wadler’s words, “very happy to be on the ground.”

Want to know more about what it’s like to fly a research mission into a hurricane? Take a virtual tour of a Hurricane Hunter aircraft “Miss Piggy.”

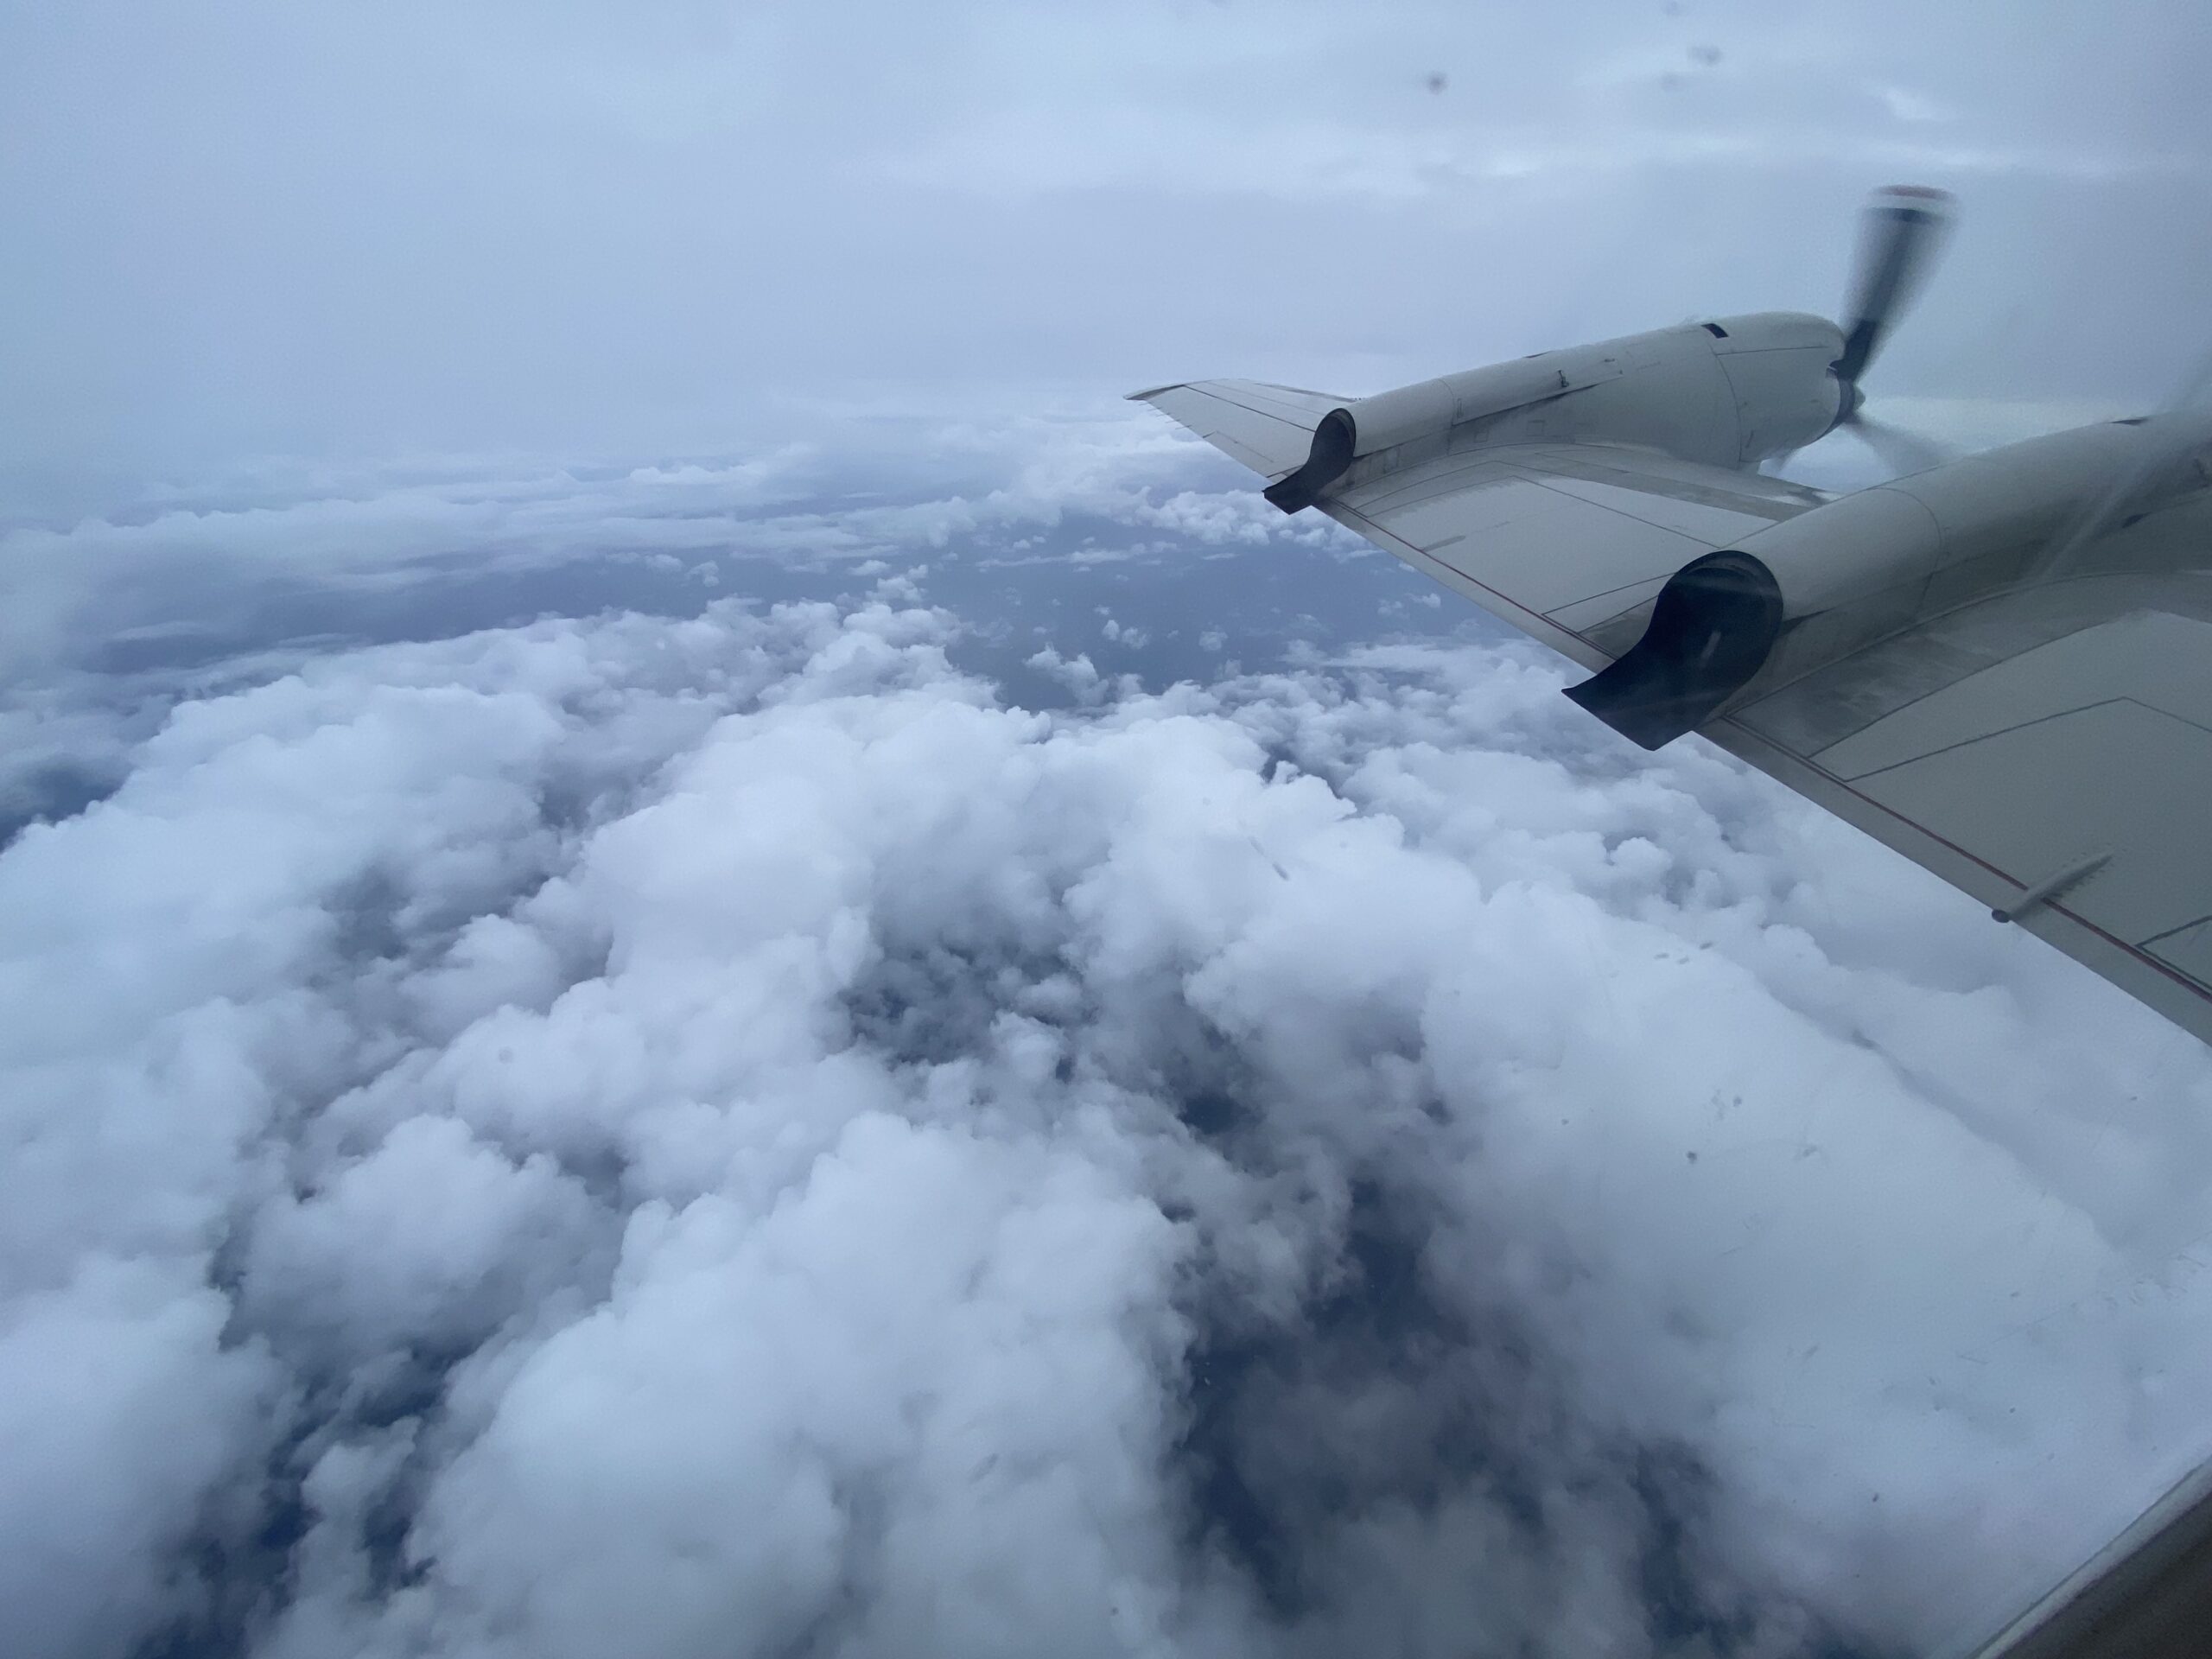
Header photo: View from NOAA WP-3D Hurricane Hunter aircraft “Kermit” during flight 20220928H1 into Hurricane Ian. Photo courtesy of Joshua Wadler.

About 36Hurricanes

The 36th Conference on Hurricanes and Tropical Meteorology brought together hundreds of hurricane researchers, modeling experts, forecasters, emergency managers, communicators, and more May 6-10, 2024, in Long Beach, California to discuss the latest in tropical cyclones and other tropical weather phenomena. It was hosted by the AMS Committee on Tropical Meteorology and Tropical Cyclones.

You can view the online program here. All conference presentations will become available to the public starting in August 2024.

AMS 2024 Session Highlight: WRN Asks “What If…?”

Graphic: WRN Asks "What If...?"

Since 2013, the AMS Symposium on Building a Weather-Ready Nation (WRN) has brought together meteorologists and other Weather, Water, and Climate Enterprise partners to discuss efforts in advancing what it means to be “Weather-Ready.” At the 104th AMS Annual Meeting, for the second year in a row, the WRN Symposium will be opening their program Monday morning at 8:30 AM ET in Baltimore with a special, interactive session: “WRN Asks: What If…?” We spoke to one of the program chairs for this Symposium, Trevor Boucher from the National Weather Service, about why this session is unique and why AMS attendees might want to check it out.

What’s so special about this session, and how did it come about?

Trevor: The design and discussion are both very different from a traditional 12-minute presentation or panel session. Weather Ready Nation Symposium was created shortly after the National Weather Service introduced the WRN Initiative as a forum to share lessons learned, successes, and best practices. After a decade of this pursuit, several recurring themes arose: How do we, the Weather Enterprise, target underserved and vulnerable populations? How do we communicate our science effectively? How do we focus on our publics/partners while also maintaining our own well-being? These provocative questions are not easily addressed through the traditional paradigm of science conferences. Last year, the 11th WRN Symposium looked to an interactive, collaborative strategy to address big societal challenges, hosting a special session called, “WRN Asks: What if…?” which embraced the concept of “transformative learning.” We shifted the focus to collective, group discussion, and critically reflecting on what we’ve all learned since 2013.

This year’s “What if…?” session not only fits into the Annual Meeting’s “Living in a Changing Environment” theme but intentionally asks the provocative “elephant in the room” questions that are difficult to have in a traditional session. We designed this session as a “reverse panel,” where moderators provide a 3-minute “state of the science” with respect to their backgrounds and propose an open-ended, “What if…?” question to the audience. Then their role shifts to moderating audience discussion for the remainder of their 20-minute slot. So you might see notable names on the agenda, but they do the least amount of talking. The audience are the true panelists, sharing their opinions, their knowledge, and their concerns about these questions.

Where did this idea come from?

Trevor: To be honest, the design inspiration and name largely came from the Marvel Cinematic Universe (MCU). There is an animated series with the same name that explores how certain character storylines would progress in alternate scenarios or timelines. What would the implications be if certain details of these characters changed? Additionally, the show Black Mirror on Netflix is another inspiration, exploring how some seemingly inevitable technological advancements like AI or cybernetic implants may change our society. Similarly, we wanted to explore “What if…?” scenarios around how our science may look if things progress, change directions, or stay the same.

One of last year’s discussion moderators, Dr. Justin Sharpe, helped us also understand how this style of discussion fits very nicely into the concept of Transformative Learning (Mezirow, 1995, 2000) and engendering critical reflection of the audience. For the chairs, this also helps us reflect on how we craft our scientific discussions each year in our program. The single, double, and triple-loop deutero learning model (below) applies to both the audience and the chairs simultaneously.

Deutero Learning: Single, Double and Triple Loop Learning where single-loop learning is primarily related to considering one’s actions — such as improving efficiency; double-loop learning questions priority-setting, such as how solutions are determined (Argyris and Schön, 1978); and triple-loop learning questions underlying values and assumptions, asking, for example, what our goals may be (Sharpe, 2018, 2021, Sweiringa and Wierdsma, 1992).

The goal for this year’s session is to inspire the following year’s call for abstracts. We will be taking notes on everything discussed from the audience and planning follow-up sessions called “What’s Next?” based on the discussion. We hope people will be excited to contribute to these discussions for years to come.

How did the first “What if…” session go last year?

Trevor: Exceptionally well. Even though it was the first time we tried this and it was the opening Monday morning session of the Annual Meeting, with a LOT of competition for the membership to choose from, we had about 40-50 folks and had no problem with participation. In fact, we had to cut discussions off for all four questions proposed. I honestly think everyone who attended spoke up at some point through the 90-minute session.

My favorite part was an idea from Doug Hilderbrand, the creator of the WRN Symposium. He asked all the students in the audience to raise their hand, and promised they would be prioritized in the discussion, since these topics are likely what they will be grappling with throughout their upcoming careers.

What’s in store for attendees this year?

Trevor: Four new moderators with four new questions! And we have become a bit more emboldened to ask even more provocative questions this year. Some of them are excellent examples of #HowtoStartaMetFight (a popular Twitter hashtag from years ago). I personally can’t wait to see where the discussion takes us. The questions include…

“What if all weather information was probabilistic?”
Dr. Sean Ernst (OU’s Institute for Public Policy Research and Analysis)

“What if there wasn’t a stigma when talking about climate change?”
Jared Rennie (Research Meteorologist – NCEI)

“What if we didn’t change anything?”
Dr. Tanya Brown-Giammanco (Director – NIST Disaster and Failure Studies)

“What if there was no ego in the weather enterprise?”
Matt Lanza (Managing Editor – Space City Weather)

I’ve been on all our coordination calls and dry runs with these folks and we have had to cut short our 90-minute meetings each time because we just can’t help but discuss these important questions — and that’s just 6-7 of us. I really think AMS attendees will find it to be an invigorating way to begin their week in Baltimore.

Read more about the session.

About the AMS 104th Annual Meeting

The American Meteorological Society’s Annual Meeting brings together thousands of weather, water, and climate scientists, professionals, and students from across the United States and the world. Taking place 28 January to 1 February, 2024, the AMS 104th Annual Meeting will explore the latest scientific and professional advances in areas from renewable energy to space weather, weather and climate extremes, environmental health, and more. In addition, cross-cutting interdisciplinary sessions will explore the theme of Living in a Changing Environment, especially the role of the weather, water, and climate enterprise in helping improve society’s response to climate and environmental change. The Annual Meeting will be held at the Baltimore Convention Center, with online/hybrid participation options. Learn more at annual.ametsoc.org

Irrigation and Storms in the Inner Mongolian Desert

Images from the DECODE project. Clockwise from top left: Microwave radiometer, wind LIDAR, researcher launching rawinsonde, eddy flux observation system, clouds forming at the boundary line, radar image of convective cells initiating along the boundary, photo of supercell storm growing from the boundary line. Photos courtesy of DECODE team.

A Research Spotlight from 32WAF/20Meso/28NWP

An irrigation oasis in Inner Mongolia, China, is providing unusual, real-world evidence about the effects of sharp vegetation contrasts on local and regional weather. Several presentations at the 32nd Conference on Weather Analysis and Forecasting, the 20th Conference on Mesoscale Processes, and the 28th Conference on Numerical Weather Prediction (32WAF/20Meso/28NWP) discussed findings from the 2022 DEsert-oasis COnvergence line and Deep convection Experiment (DECODE).

In Bayannur City, on the north side of a bend in the Yellow River, sits one of China’s largest irrigated areas: the 2,200-year-old, 769,333 hectare Hetao Irrigation District (HID), which was recognized as a World Heritage Irrigation Structure in 2019. All around this irrigation oasis is arid and semi-arid land, including the Kubuqi Desert to the south. We know that borders between land and water influence weather patterns, but there has been less real-world evidence gathered about the effects of differences in vegetation—and you can’t find a sharper divide than this one.

Image showing treeless mountains and sparsely vegetated foothills next to flat land. In the center of the photo is a dark green area of vegetation which contrasts sharply with the otherwise brown/tan landscape. A road runs to one edge of the green area. At the very right of the image, in the middle distance, is a large, wide building with a bright blue roof.
Above: Aerial view showing part of the Hetao Irrigation District and its sharp contrast with the surrounding desert areas. Video still courtesy of Yijing Liu. Below: Diagram of the juxtaposition between the boundary and its associated convective initiation (CI) and downstream propagation relative to surrounding terrain in Hetao Irrigation District. Image courtesy of Zhiyong Meng.

When cooler air from the Irrigation District meets warm wind from the desert, an atmospheric boundary line can sometimes be seen on radar. During the summer, convection often initiates at this boundary—sometimes leading to impressive storms that can travel long distances. DECODE researchers used a comprehensive set of observations—from radar and satellite to balloon sondes to flyovers—to examine this phenomenon. Their mission was to understand how the boundary forms and under what circumstances it might create unusual weather.

Different views of the boundary. Images courtesy of Zhiyong Meng.

On average, in the three months of summer each year from 2012 to 2016, 60 days produced a boundary, and 44 percent of those boundaries resulted in convective initiation (CI), noted Zhiyong Meng, of Peking University, in her July 20 presentation during Session 16 of 32WAF/20Meso/28NWP. The DECODE field experiment itself lasted 36 days in 2022, from 5 July to 9 August. With two field stations located on the oasis side, and four on the desert side, the teams were able to observe 23 boundaries and 11 occurrences of deep convection initiation, and even one case of a tornado.

Video still with green agricultural fiels and dark storm clouds in the background. A tornado funnel cloud is seen in the right side of the image. The DECODE project logo appears at the top left.
A tornado documented by the DECODE research team. It was generated by a thunderstorm formed at the boundary line. Video still courtesy of Yijing Liu.
Video still shows a bright bolt of lightning in the far left of the image. In the bottom right, a laser wind LIDAR device sits on a rooftop, pointing in the direction of the storm.
Lightning strike during the DECODE experiment. Video still courtesy of Yijing Liu.

Yipeng Huang, of Xiamen Key Laboratory of Straits Meteorology, outlined the most common conditions leading to a boundary/CI in a 21 July presentation. The researchers found that a boundary is most likely on warm summer days, when synoptic forcing is relatively weak, with dominant southerly winds opposing the oasis breeze, and a temperature over the desert that is apparently warmer than over the oasis. They found that along the boundary line between the two masses of air, convection initiation may occur when enough moist air advects north at the west edge of the subtropical high, moves out over the dry desert, and converges with a cool oasis breeze in an environment with large enough instability. Hongjun Liu of Peking University presented the mechanism for this process in a case study on 21 July.

Diagram of boundary formation and convection initiation near Hetao Irrigation District. Image courtesy of Zhiyong Meng.

Meng described “The most beautiful case, on July 29 [2022, when] the boundary produced a CI and the storm became very strong; it actually produced five-millimeter hail in the eastern part of the oasis.” They were also able to observe another storm as it split into two separate supercells. On July 25, a preexisting storm that passed over the area dissipated somewhat, likely due to sinking air over the oasis, then re-initiated strongly once it reached the boundary/convergence line over the desert. On occasion, the boundary would extend over the oasis and strongly increase the precipitation there.

Radar and photograph images of a large thunderstorm forming along the boundary line in the Kubuqi Desert on 29 July, 2022.

In the presentation immediately following Meng’s, Murong Zhang of Xiamen University noted that the team’s real-time forecasts were able to predict the formation of the boundary line in 21 out of 23 cases, although predicting convection initiation was more difficult. They were only able to predict 6 out of 11 CIs, as the numerical model tended to over-predict surface temperature, but under-predict moisture. The observations obtained from DECODE have been used to effectively improve the surface heat flux over the irrigated area, as shown in a presentation by Xuelei Wang of Peking University on the first day of the conference. You can see more from the DECODE team in this video created as part of the project:

With researchers from many institutions* participating, DECODE is an epic undertaking to study a unique natural phenomenon. As field research pioneer Prof. Edward Zipser of Utah University noted after Zhang’s talk, it’s “a program that we want to hear more about.”     

Group photo of the DECODE onsite team at one of the desert stations. Photo courtesy of Yijing Liu.

*DECODE participating organizations include Peking University, Inner Mongolia Meteorological Bureau, Nanjing University of Information Science and Technology, Xiamen Key Laboratory of Straits Meteorology, Xiamen University, Nanjing University, National Satellite Meteorological Center, Foshan Meteorological Bureau, and Jiangxi Storm Hunting Videos Culture Co., Ltd.

Featured image collage: Images from the DECODE project. Clockwise from top left: Microwave radiometer, wind LIDAR, researcher launching rawinsonde, eddy flux observation system, clouds forming at the boundary line, radar image of convective cells initiating along the boundary, photo of supercell storm growing from the boundary line. Photos courtesy of DECODE team.

About 32WAF/20Meso/28NWP

Predicting and understanding storms and other weather events is a complex business with real-world impacts. The American Meteorological Society’s 32nd Conference on Weather Analysis and Forecasting/28th Conference on Numerical Weather Prediction/20th Conference on Mesoscale Processes brought researchers, forecasters, emergency managers, and more together to learn about and discuss the latest scientific developments. The conferences took place in Madison, WI, and online 17–21 July, 2023. Recordings of the sessions are available here.

“Once in a Generation”: The 2022 Buffalo Blizzard

Truck in snowdrift

A Research Spotlight from 32WAF/28NWP/20Meso

On 23 December, 2022, David Zaff of the National Weather Service’s Buffalo office walked out into a blank white world of howling wind. He headed to his car to get supplies, knowing there was no way to get home. He and his coworkers were trapped at the office, in the middle of one of the most deadly and disastrous blizzards Buffalo has ever seen.

Video by David Zaff, showing whiteout conditions outside NWS Buffalo office, December 23, 2022.

At the height of the 2022 holiday travel season, the four-day blizzard and lake-effect snow event knocked out power for more than 100,000 people, paralyzed emergency services and holiday travel, and left at least 47 dead. New York Governor Kathy Hochul described it as “the most devastating storm in Buffalo’s long, storied history.” Yet days earlier, Zaff and colleagues encountered skepticism from the public as they worked to warn the region.

Presenting at the J3 Joint Session at the 32nd Conference on Weather Analysis and Forecasting, the 20th Conference on Mesoscale Processes, and the 28th Conference on Numerical Weather Prediction, Zaff talked about the disaster and how the NWS countered accusations of hyperbole to get the word out.

Sounding the Alarm

The December 2022 snow was shocking, but not surprising. The pattern was easy enough to recognize, even 7–10 days earlier: a large high-pressure ridge forming over the western U.S., with a major trough in the east. “We knew something big was coming,” said Zaff. Five days before the storm, even low-resolution models suggested a major event. Four days ahead, the NWS started ringing the alarm bell. “We started saying, ‘A powerful storm will impact the region heading into the holiday weekend.’”

Three days out, the NWS issued an unusually emphatic Area Forecast Discussion (AFD):

“Some of the parameters of this intense storm are forecast to be climatologically ‘off the charts’ … One could certainly describe this storm system as a once in a generation type of event.”

NWS Lead Forecaster Robert Hamilton, Tuesday, December 20, 2022

That caused a stir, but many on social media dismissed it as hype. “People started saying, ‘There goes the weather service again,’” says Zaff.

He tried to find a way to show the science graphically, highlighting the forecast as “‘outside’ the climatology” for the time of year.

The graphic and its accompanying description got attention. By then, NWS Buffalo was communicating in earnest, including on social media. A tweet with a text-filled screengrab of the Winter Weather Message received 485,000 views. “A picture is worth a thousand words,” Zaff said, “except when people actually read the words, and see how impressive this event might be.”

Left: Graphic showing forecast surface pressure for Friday, December 23, 2022, with shading showing the relative frequency of the forecast MSLP values in the Buffalo region at that time of year. Source: David Zaff.

Surviving the Storm

Before noon on 23 December, visibility dropped to near zero, and it remained that way until around midnight on 25 December. 500 Millibar heights were “extraordinary” as the pressure trough moved into the Ohio Valley, and surface-level pressure was similarly unbelievable. A top wind speed of 79 mph was measured in downtown Buffalo at 10:10 a.m. on the 23rd, and winds in the 60–70 mph range lasted for 12 hours. “[It was] just an incredible bomb cyclone,” Zaff said. “An incredible storm.”

Zaff and some colleagues slept at the office; others attempted to drive in whiteout conditions using GPS alone, while some got stuck in drifts near the office and had to leave their cars to hike the rest of the way. Meanwhile, firefighters and airport employees worked to rescue motorists trapped nearby.

On December 24, the City of Buffalo issued “the scariest tweet I’ve ever seen,” said Zaff. The tweet stated that there were “no emergency services available” for Buffalo and numerous other towns.

“We knew by this time that there were fatalities occurring,” Zaff said. “And it just got worse and worse.”

Blizzard conditions lasted a full 37 hours–and lake effect snow wouldn’t stop for another two days. Three power substations shut down, frozen solid. Hundreds of power poles fell, and a significant percentage of locals were without power during the storm’s peak (some for days afterwards).

The 47 fatalities included people stranded outside, others who died from hypothermia in their homes, and some deaths due to delayed EMS response, according to Erie County. Hundreds of motorists were stranded on roadways during the storm. The Buffalo Niagara International Airport, with a proud legacy of operating under even the most horrific conditions, was closed for six days.

Zaff didn’t return home until late afternoon on the 25th, 18 hours after official blizzard conditions were over and having clocked 50+ hours at the office. On the drive, he saw iced-over buildings and trucks buried in snowdrifts. “It reminded me of [the movie] The Day After Tomorrow. … The impacts were tremendous.”

In his AMS presentation, Zaff compared the 2022 event to disastrous storms in 1977 (20+ fatalities, 69 mph winds, only 12” of snow yet drifts swallowed homes) and 1985 (5 fatalities, 53 mph winds, 33” snow), as well as the “Great Christmas Storm” of 1878, one of the first well-documented lake effect snow events, though lake-effect processes weren’t understood at the time. “This will likely be the storm of comparison now,” he says. “Once-in-a-generation” turned out to be right.

Future Lessons

Moving forward, said Zaff later, “Our intention is to further our relations with our Core Partners, including elected officials, emergency management, and the media [and] provide more probabilistic information that supports our ongoing Impact Decision Support Services. We hope to improve our outreach as well, instilling more confidence with the public.”

NWS will continue to provide improved decision support for partners, which may lead to more proactive road and school closures that could save lives in the future.

Photo at top: Buffalo roadways at 4 p.m. on December 25, 2022, 18 hours after blizzard conditions had passed. Photo credit: David Zaff.

About 32WAF/20Meso/28NWP

Predicting and understanding storms and other weather events is a complex business with real-world impacts. The American Meteorological Society’s 32nd Conference on Weather Analysis and Forecasting/28th Conference on Numerical Weather Prediction/20th Conference on Mesoscale Processes brought researchers, forecasters, emergency managers, and more together to learn about and discuss the latest scientific developments. The conferences took place in Madison, WI, and online 17–21 July, 2023. Recordings of the sessions are available here.