Key Takeaways from the “State of the Climate in 2023”

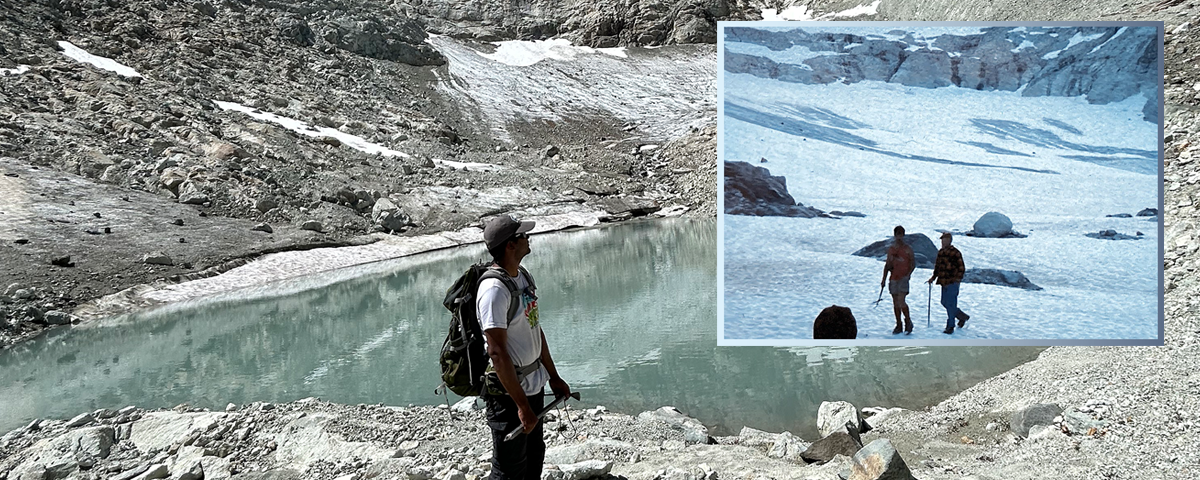
Glacial retreat at ice worm glacier

Earth hit record highs in global temps, greenhouse gases, sea level, and more last year.

By AMS Staff

Last year, global high temperatures, warm oceans, and massive wildfires broke records and sparked increasing concern about climate change. Now the annual State of the Climate report, produced by the National Oceanic and Atmospheric Administration’s National Centers for Environmental Information (NCEI) and peer reviewed and published by the American Meteorological Society, gives us an in-depth global picture of 2023, a year of extremes. 

According to the NOAA/AMS press release, the State of the Climate report this year includes contributions from more than 590 scientists from 59 countries, and “provides the most comprehensive update on Earth’s climate indicators, notable weather events, and other data collected by environmental monitoring stations and instruments located on land, water, ice and in space.”

Below are a few highlights from 2023.

Record-high greenhouse gases (again)

Global atmospheric carbon dioxide, methane, and nitrous oxide all reached higher concentrations than ever recorded. CO2 was 419.3±0.1ppm, 2.8 ppm higher than in 2023 and 50% higher than pre-industrial levels. This is the fourth-largest recorded year-to-year rise in CO2.

Record-high global temperatures

2023 officially beat 2016’s record as the hottest year overall since records began in the 1800s, partly due to the transition from La Niña to a strong El Niño. Globally, 2023 was 0.99°–1.08°F (0.13°–0.17°C) above the 1991–2020 average. The years 2015–2023 have been the hottest nine years on record.
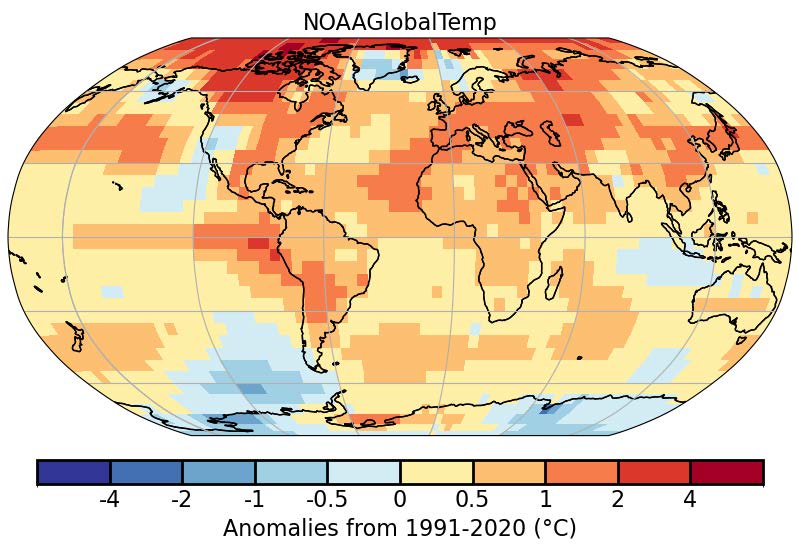
Global Surface Temperatures Were Above Average Across Most of the World (Plate 2.1a in State of the Climate in 2023): During 2023, much-warmer-than-average conditions were observed across most of the world’s surface, with the largest positive temperature anomalies across parts of the higher northern latitudes, shown here as areas shaded from orange to red. Limited areas experienced near-average to cooler-than-average conditions (blue shading). [Note: graphic shows 2023 average temperature anomalies above or below the 1991-2020 average global temperature.]

North America overall experienced its warmest year since records began in 1910, including a heat wave in Mexico that killed 286 people. The Caribbean also experienced its warmest recorded year, and Europe its warmest or second-warmest depending on the analysis.

In Kyoto, Japan, the cherry trees reached peak bloom on March 25, the earliest bloom in the city’s 1,200-year record. Photo: Balazs Simon on Pexels.

Record-high ocean heat

El Niño also contributed to the hottest oceans ever recorded. Mean annual global sea-surface temperature was 0.23°F (0.13°C) higher than 2016’s previous record, and August 22, 2023 saw an all-time high daily mean global sea-surface temperature of 66.18°F (18.99°C). Marine heat waves were recorded on 116 days of 2023 (vs. the previous record of 86 days in 2016) and global ocean heat content down to 2,000 feet also reached record highs.

Record-high sea levels (again)

Global mean sea level rose 8.1±1.5 mm in 2023, to reach a record 101.4 millimeters above the average from 1993, when satellite measurements began.

Massive wildfires caused by heat and drought

37 million acres of Canada burned in 2023, twice the previous record, causing evacuations for more than 232,000 people and with smoke affecting cities as far away as western Europe. Australia experienced its driest August–October since 1900, leading to millions of acres burned in bushfires in the Northern Territory. The European Union experienced its largest wildfire since 2000 (in the Alexandroupolis Municipality of Greece). Notable wildfires also occurred in Brazil, Paraguay, and in the U.S. state of Hawaii.

Warm poles and a greener Arctic

2023 was the fourth warmest year in the Arctic in the 124-year record, and the warmest recorded June–September. Sea ice reached its fifth-lowest extent in the 45-year record (with many monthly and daily records set), and multi-year ice declined. Despite above-average spring snowpack in the North American and Eurasian Arctic, rapid melting led to record and near-record lows in snow-water equivalent by June. The Northern Sea Route and Northwest Passage both opened, and the Northwest Passage saw a record 42 ship transits. Arctic tundra vegetation reached its third-greenest peak in the 24-year record. 

Much of Antarctica also experienced well-above-average heat. In addition, eight months, and 278 days, saw record lows in sea ice extent and area in Antarctica; daily sea ice extent on 21 February was the lowest ever recorded.
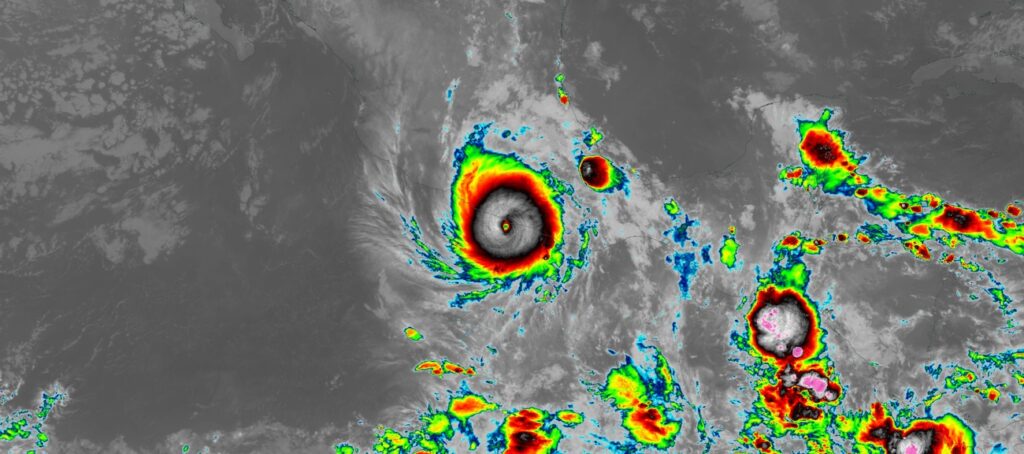
Clean infrared image of Hurricane Otis making landfall near Acapulco, Mexico. Image captured on 25 October, 2023, at 5:20 UTC, by the ABI instrument aboard the GOES-East satellite. Source: NASA Worldview.

Below-average tropical cyclone activity, yet notable storms

There were 82 named tropical storms in 2023, below average. However, global accumulated cyclone energy was above average, rebounding from 2022’s record low, and there were seven Category 5 cyclones. Tropical Cyclone Freddy became the longest lived tropical cyclone on record, lasting from February 6 to March 12; it made landfall three times and caused 165 fatalities in Mozambique and 679 fatalities in Malawi due to flooding and landslides. Typhoon Doksuri/Egay was the costliest economically, causing US$18.4 billion in damages; Beijing saw its heaviest recorded rainfall and 137 residents died in flooding. Rain and floods from Storm Daniel killed at least 4,300 people in Libya. Hurricane Otis underwent the most extreme rapid intensification on record—Category 1 to Category 5 in only nine hours—and became the strongest landfalling hurricane to hit western Mexico, devastating Acapulco.

Persistent ozone hole

The stratospheric ozone hole over Antarctica appeared earlier in the year and lasted longer than normal, and reached its 16th largest extent in 44 years.

The full State of the Climate report includes regional climate breakdowns and notable events in every part of the world. Read the full 2023 report here. Read a summary of key takeaways here.

Image at top: Ice Worm Glacier in the North Cascade mountains of Washington, United States, which was under continuous annual monitoring from 1984 onward and disappeared in 2023. Large photo: The location of former Ice Worm Glacier on 13 August 2023. Inset photo: Ice Worm Glacier on 16 August 1986. Photo credits Mauri Pelto.
CalFiDE: Observing Large-Scale Fires from the Air and the Road

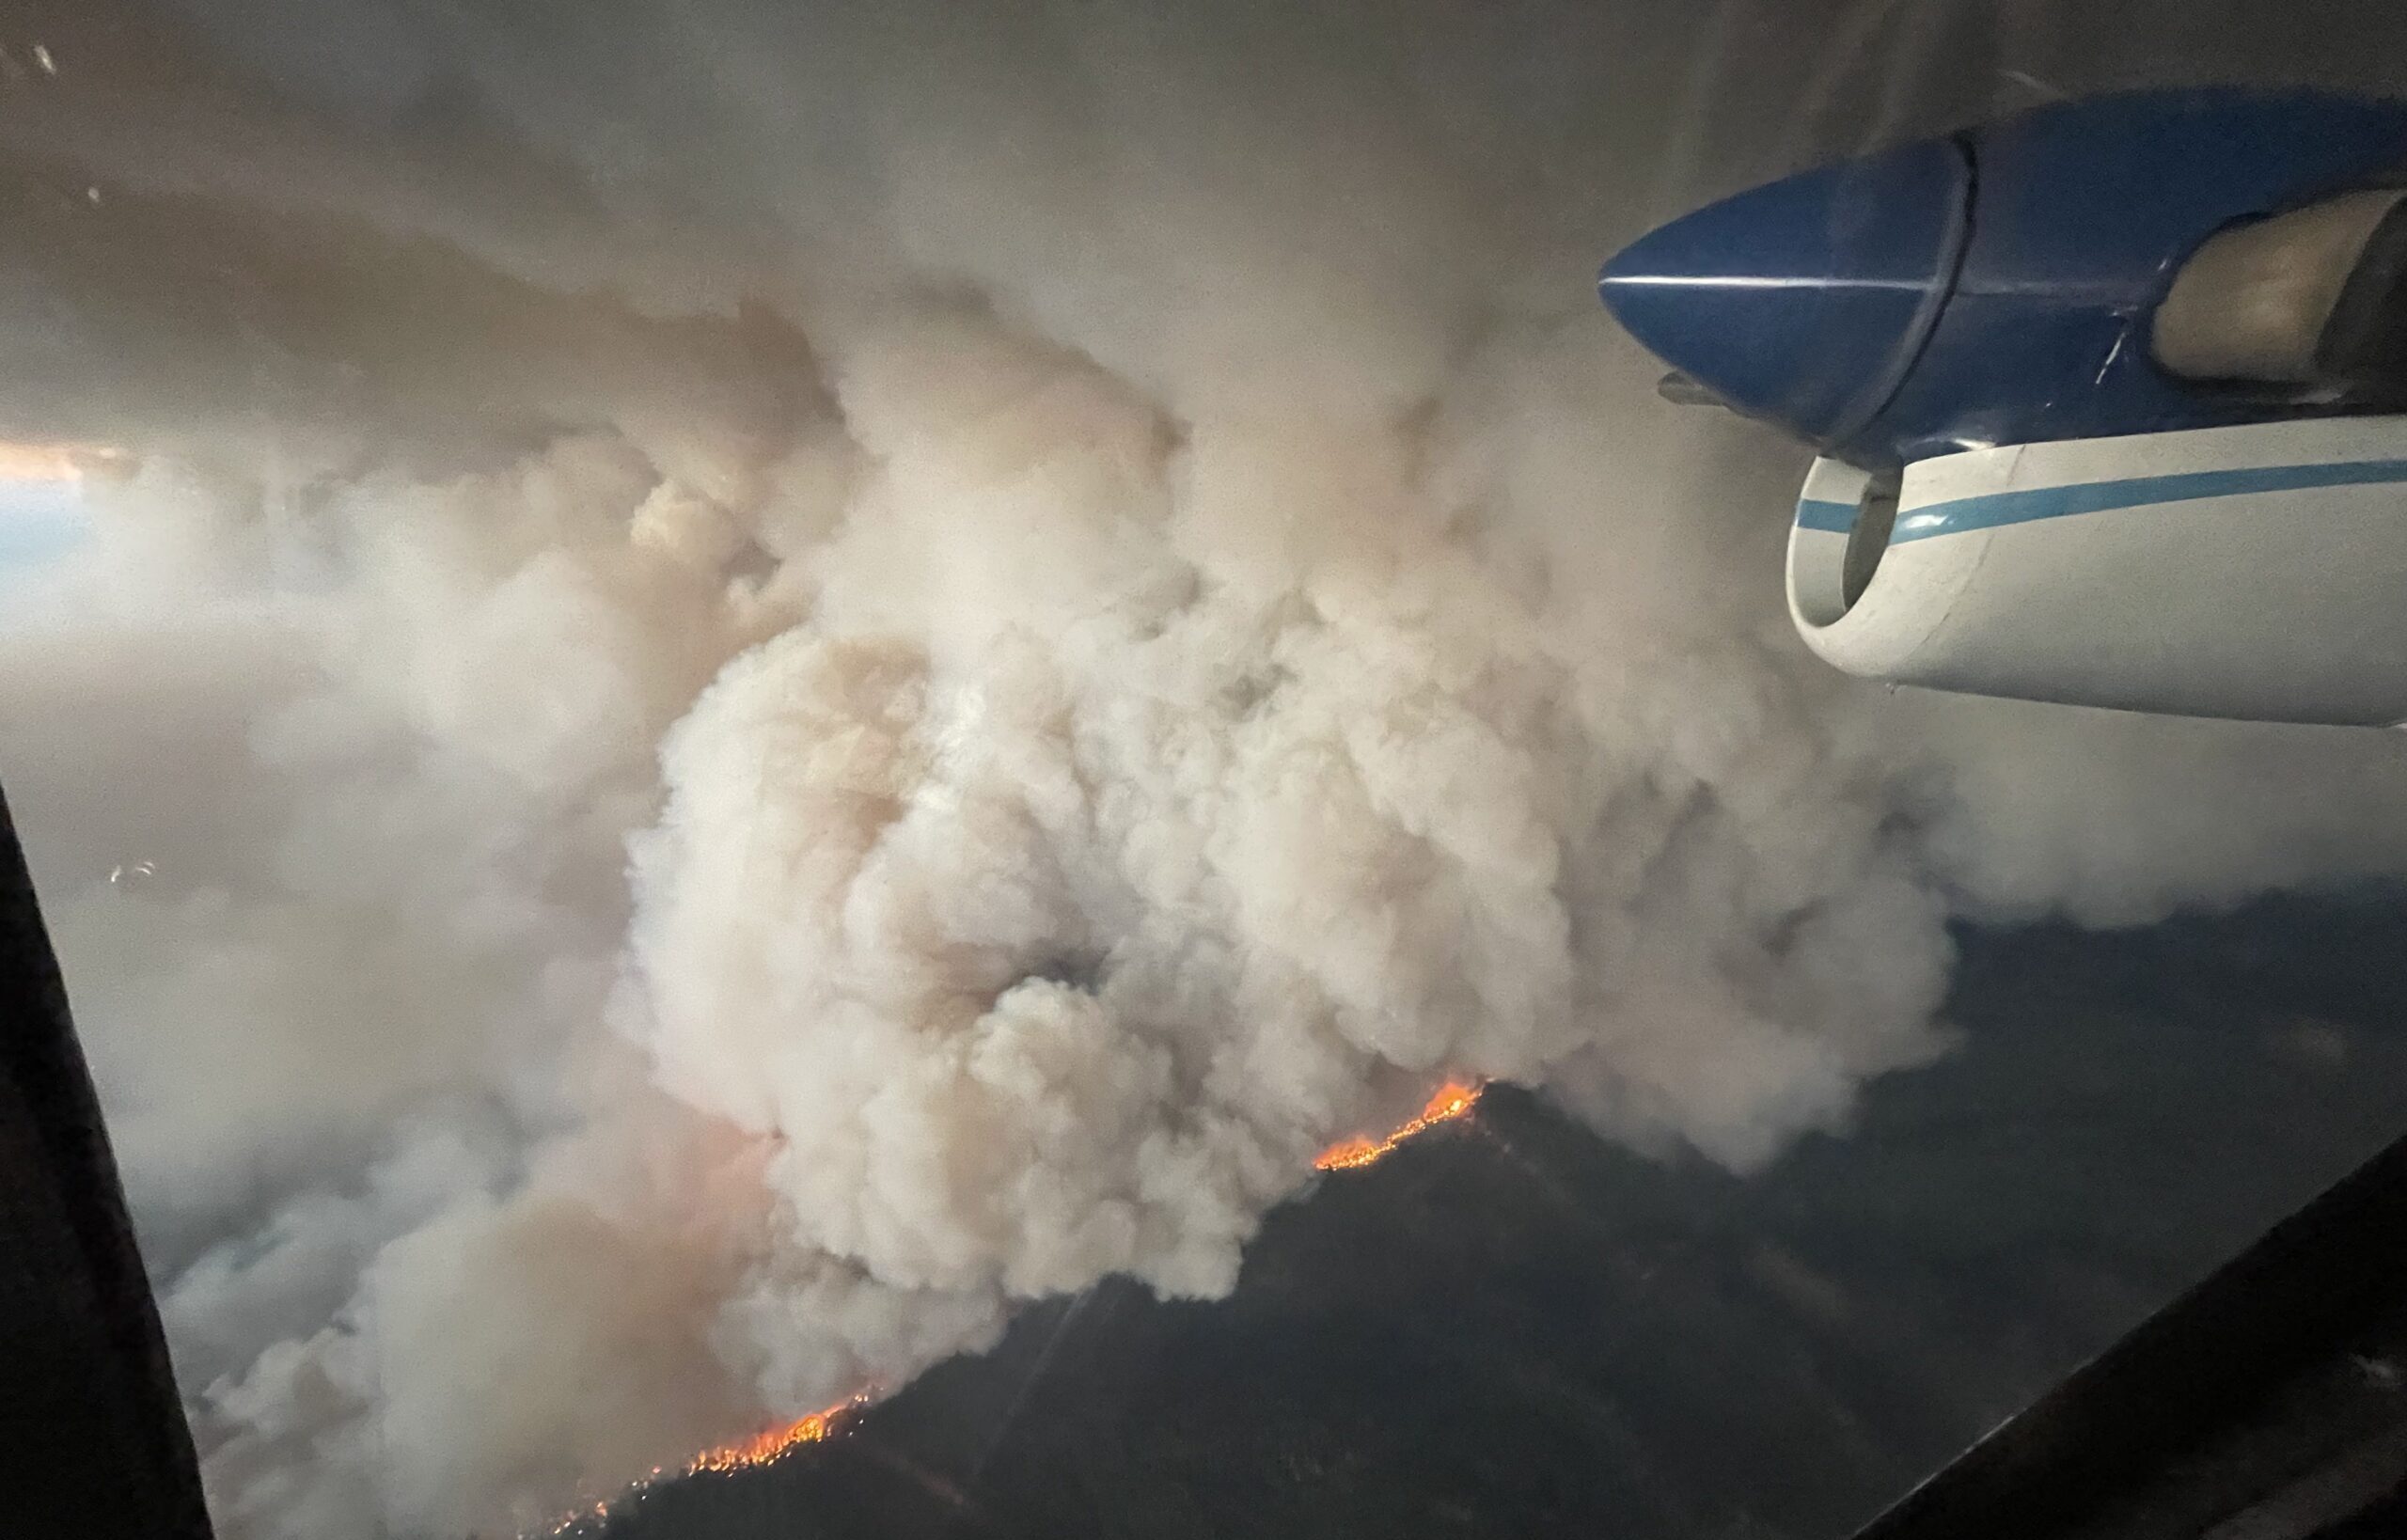
Mosquito Fire and plane propeller

A Research Spotlight from the 14th Annual Fire and Forest Meteorology Symposium, 2–4 May, 2023

Through the smoke of record-setting Canadian wildfires–which continue to burn millions of acres in the north–the importance of understanding huge, landscape-scale fires has never been clearer. In a 4 May presentation in the ninth session of the 14th Fire and Forest Meteorology Symposium, Brian Carroll discussed recent efforts to gather scientific observations on these types of landscape-scale wildfires in California and Oregon through CalFiDE, the California Fire Dynamics Experiment. His team looked at the behaviors of these fires and the winds they create and interact with, as well as the impacts of smoke plumes on air quality.

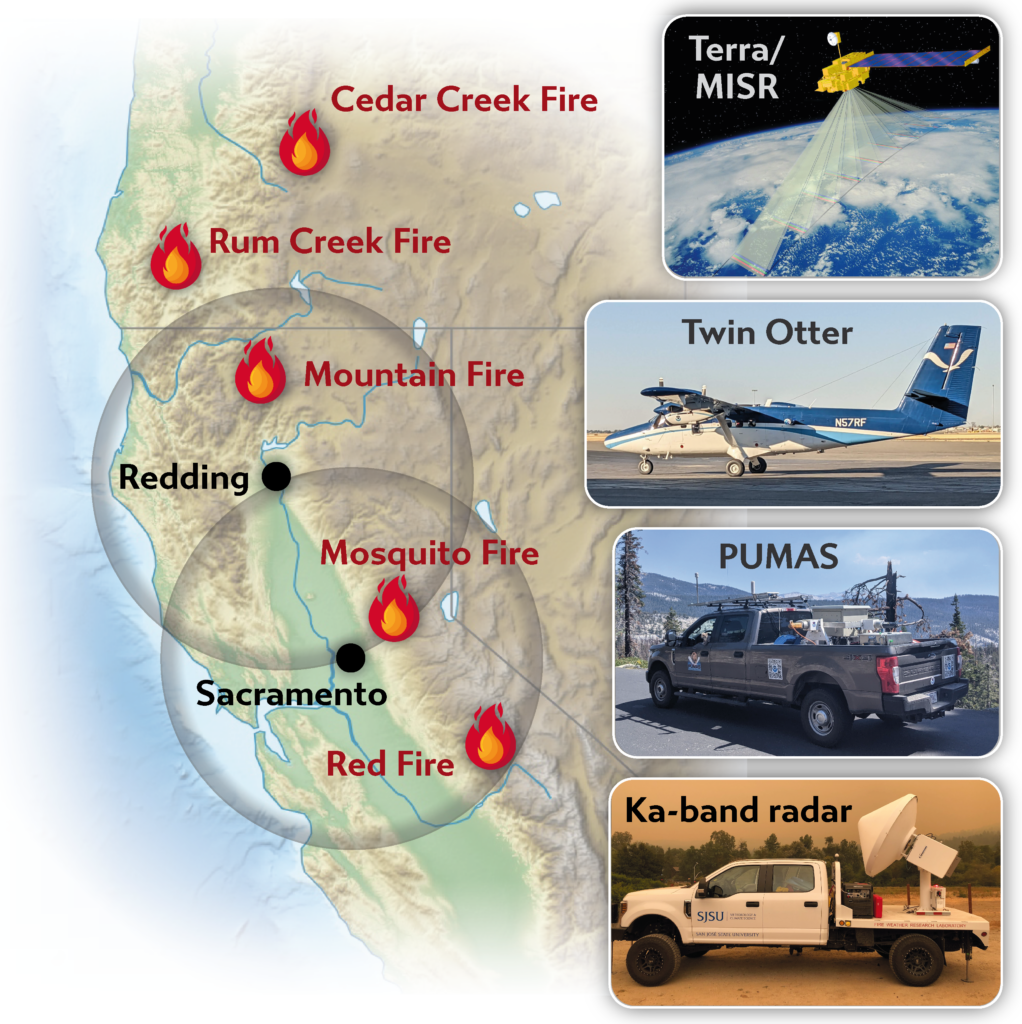
Field observations of wildfires this large are very rare. The CalFiDE team (including scientists from NOAA, CIRES, San Jose State University, the University of Nevada Reno, and NASA) used airborne and ground-based vehicles and a satellite to take measurements of five fires in August–September 2022. That included the Mosquito Fire, the largest in California that year, which burned more than 76,000 acres and prompted evacuation orders for 11,000 people. 

Carroll described the difficult and potentially dangerous process of conducting continuous observations of huge fires, without getting in the way of firefighters and emergency managers.

“There’s an aircraft exclusion zone that’s dedicated for the firefighters,” he notes. “The pilots have that information and avoid those areas but the pilots’ own decisions to keep our aircraft safe against the strong fire-generated winds and smoke are also a big driver. Even at a safe distance from the strong updraft produced by the fire, the wind convergence into the smoke column had to be compensated for by angling the plane away.” 

They were aided by state-of-the-art mobile Doppler lidar systems that allowed them to map air and fire behaviors over large distances in complicated terrain. “There are few lidars in the world capable of making these wind measurements while moving, and that mobility is important when dealing with wildfires that are constantly evolving,” Carroll says. “The lidars also provide real-time information on the winds and location of smoke layers, and we use that information to optimize sampling patterns and target layers for sampling trace gases.”

The CalFiDE team conducted surveys with a NOAA Twin Otter airplane, using Doppler lidar, infrared imaging, and trace gas measurements. They also drove an instrumented pickup truck (known as PUMAS, the Pick-Up-based Mobile Atmospheric Sounder) on the outskirts of the fire with additional Doppler lidar and temperature measurements, getting a 3-D picture of the winds above the truck as they drove. Meanwhile, the Multi-angle Imaging SpectroRadiometer (MISR) instrument aboard NASA’s Terra satellite provided a broad swath of smoke distribution information from space.

Above image: Fires observed during the 2022 CalFiDE campaign. Aircraft bases of operation with 1-hour flight range ring are shown in black, and platforms involved are on the right. The Twin Otter and PUMAS both had scanning Doppler lidars capable of profiling winds while underway.

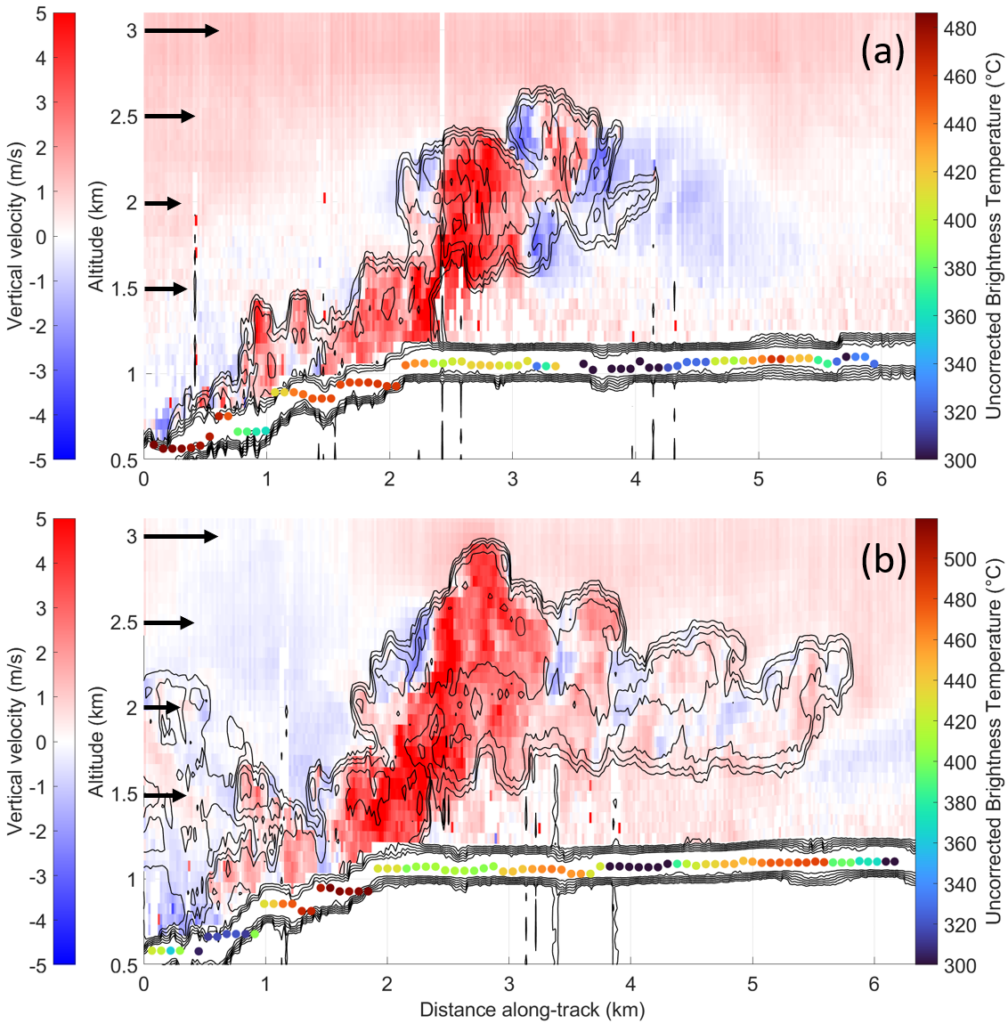
The airborne lidar provided cross-sections of fire updraft cores (areas of hot, rising air) and smoke plume motions, complemented by the infrared imagery capturing the fire’s shape and evolving intensity. These are some of the first measurements of their kind, and will provide important ground-truth comparisons for fire and air quality modeling.

Plots of airborne Doppler lidar measurements show a side-view cross section of smoke plumes over fire. These are vertical profiles of upward/downward winds (vertical velocity) from the Mosquito Fire on 8 September, 2022, taken at 7:03 pm (top) and and 7:17 pm (bottom). Darker red indicates faster upward air movement, and the black lines correspond to the smoke plume. Black arrows show wind speed and direction at different heights. Colored dots show the altitude of the ground surface and the “brightness temperature” (intensity of the fire heat) at each location based on longwave infrared imaging.

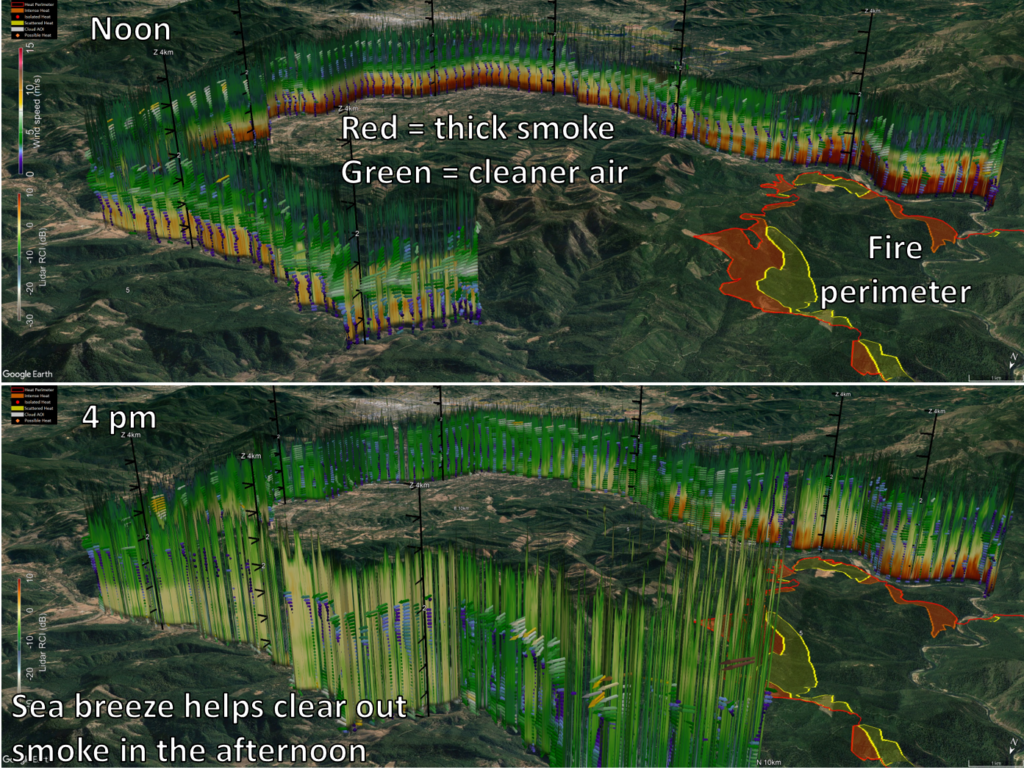
PUMAS observations also allowed the team to generate a high-resolution picture of smoke behavior in nearby areas—for example, the ways smoke lingered in valleys during calm conditions, and how rapidly air quality improved when sea breezes disrupted the smoke layer.

“Driving around these local valleys, in a few kilometers you could have a huge change in how much smoke there was, and a large change in temperature. And there’s a major change in boundary layer dynamics as you move in and out of those regions.”

Brian Carroll, Research Scientist at CIRES/NOAA

PUMAS data showing smoke-filled valleys. Very high concentrations of smoke in the morning, confined in the lowest 500 meters (top panel), transitioned to cleaner air (bottom panel) with the introduction of a sea breeze that traveled through the valleys. Data curtains (colored vertical stripes) depict lidar attenuated backscatter, which correlates with smoke concentration, along a 56 km driving route. Arrows show wind direction, with size and color indicating wind speed.

“The West Coast of the United States has experienced terrible fire seasons recently, with smoke impacting the lives of millions and fires themselves displacing many others. People across the U.S. and Canada have gained additional insight this year into what that’s like. We need more comprehensive information about how these fires grow, how the smoke moves, and the atmospheric conditions that interact with the fires, as we face a future that will likely see even more extreme fire seasons. The CalFiDE team’s efforts will help meet those needs,” Carroll says.

An article providing an overview of CalFiDE has been submitted for publication in the Bulletin of the American Meteorological Society

Brian Carroll is a research scientist with the Cooperative Institute for Research in Environmental Sciences (CIRES), working in The NOAA Chemical Sciences Laboratory (CSL) Atmospheric Remote Sensing Program.

The recording of this session is now publicly available here.

About 14Fire

Meteorology and wildfires are intimately interconnected—and wildfires are becoming increasingly severe and frequent in many parts of the United States. From local residents and firefighters on the ground to planners and insurers, to people hundreds of miles away breathing wind-driven smoke, society relies on our ever-improving ability to understand and forecast fires and the related atmospheric conditions. The American Meteorological Society’s 14th Fire and Forest Meteorology Symposium brought together researchers and fire managers to discuss the latest science. All conference presentations are now publicly available.

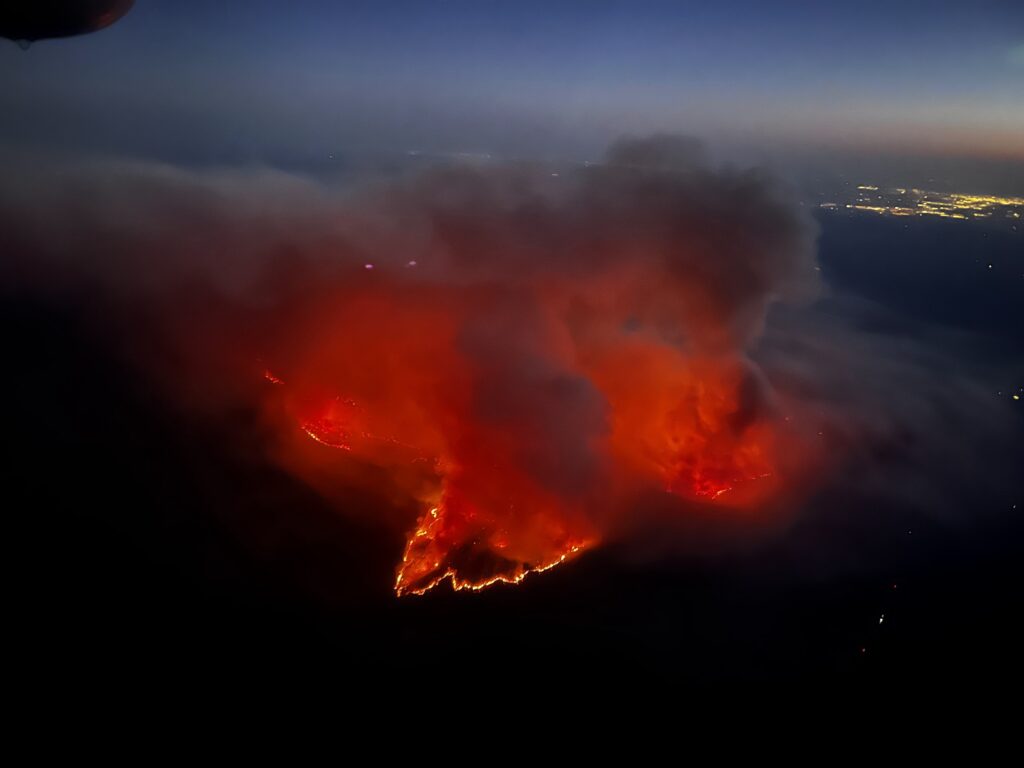
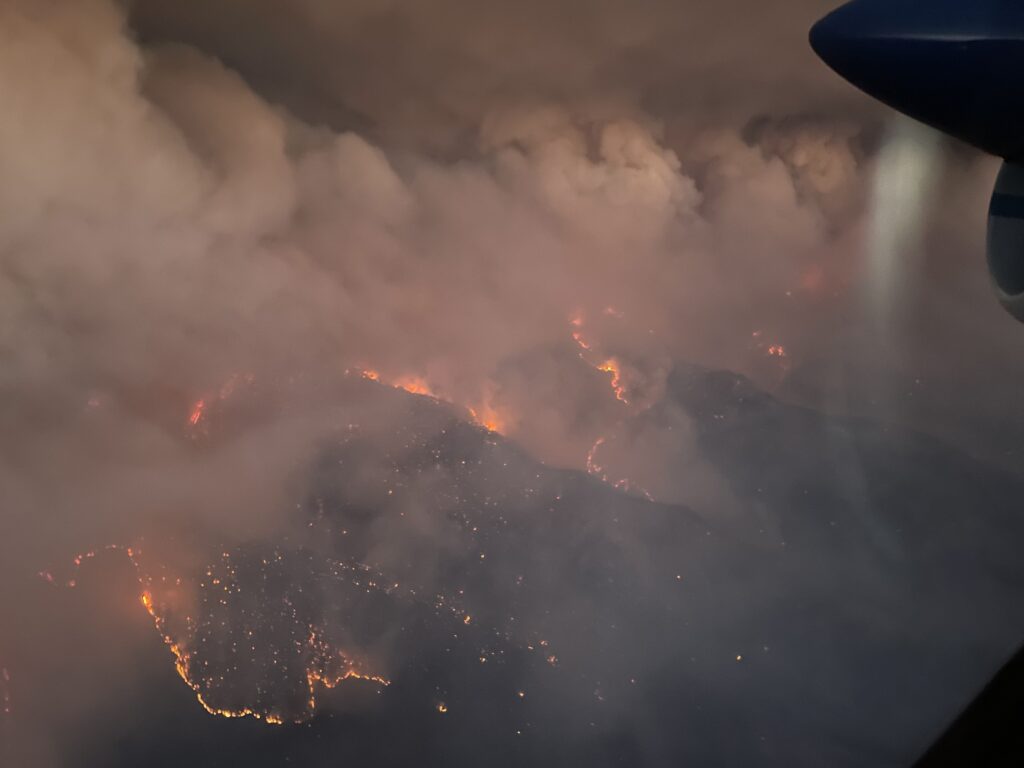
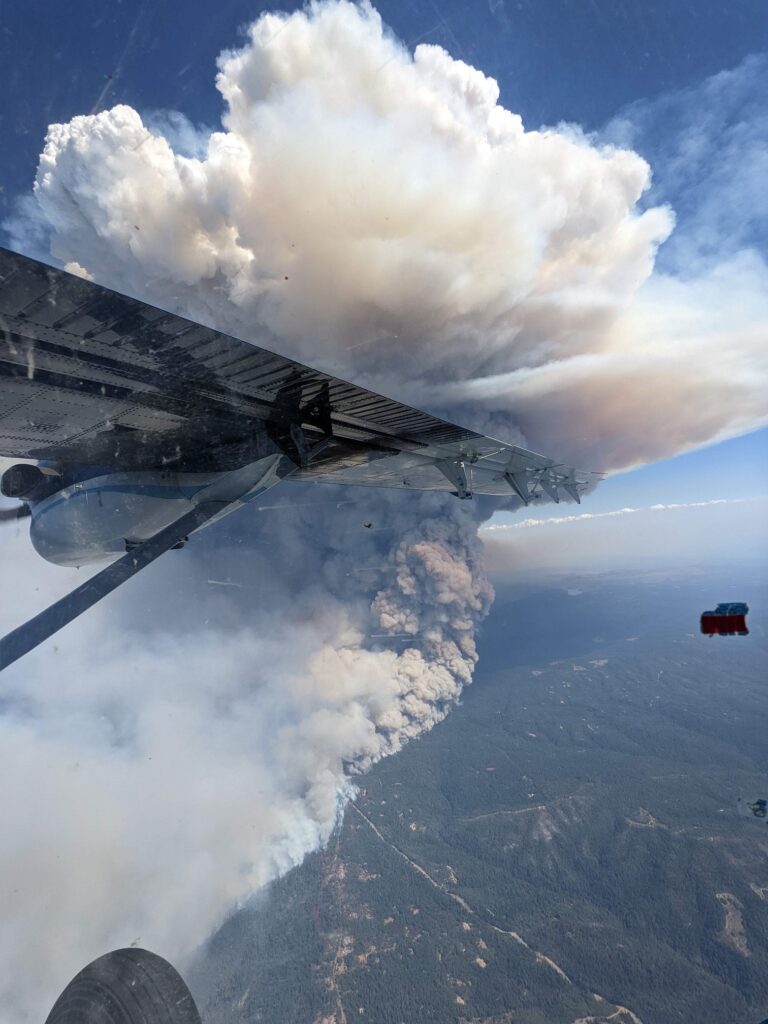
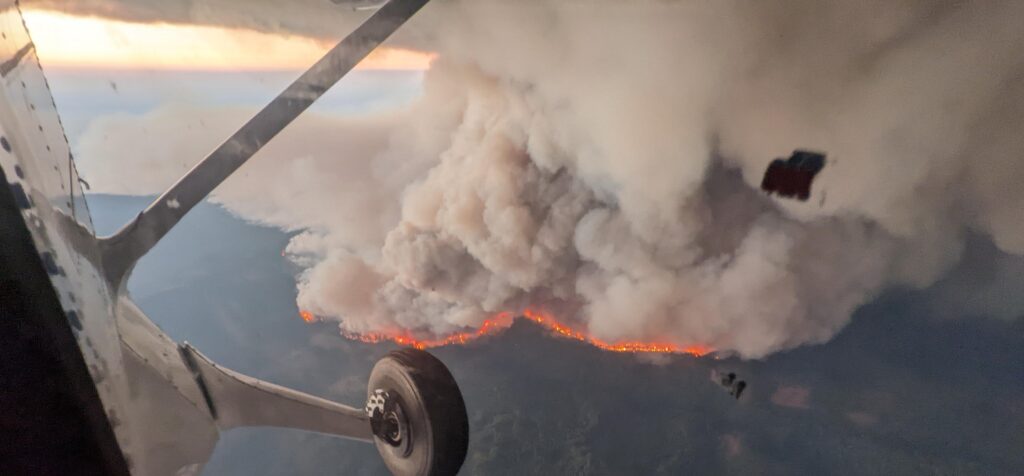
Top image: Mosquito Fire flames and smoke on hillside, seen from the NOAA Twin Otter during CalFiDE on 8 September 2022. Photo credit: LT Nick Pawlenko.

In the Field: Understanding Canyon Fires

A Research Spotlight from the 14th Annual Fire and Forest Meteorology Symposium, 2–4 May, 2023

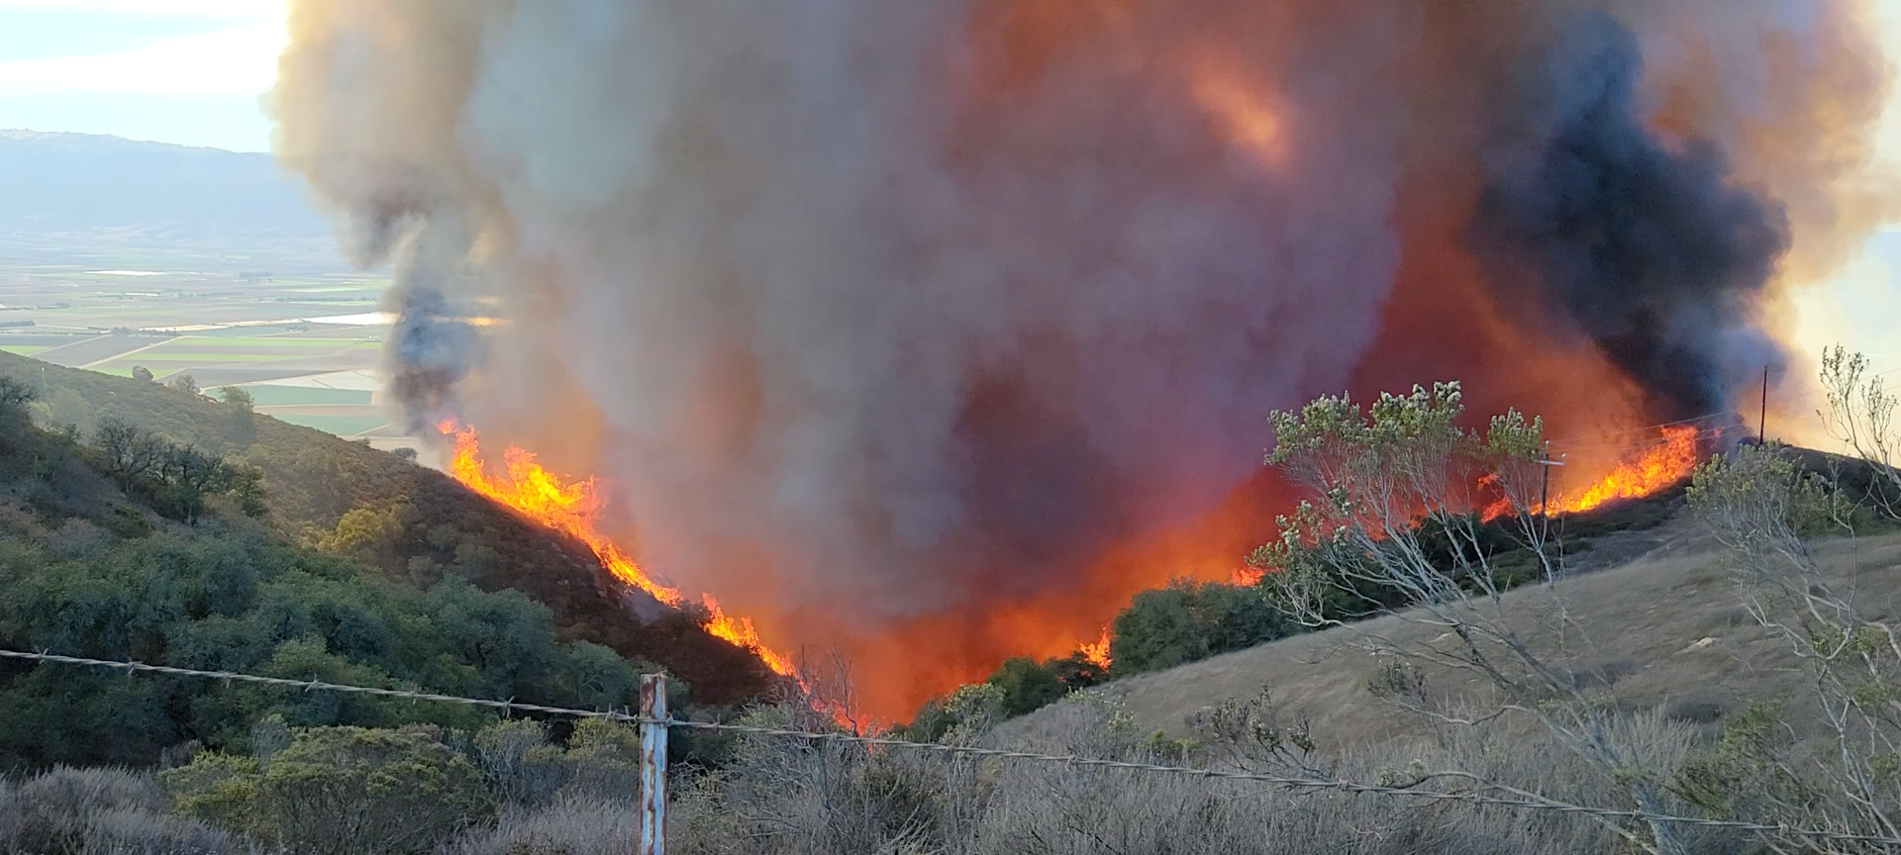
The California Canyon Fire controlled burn moves upslope. Image: San José State University

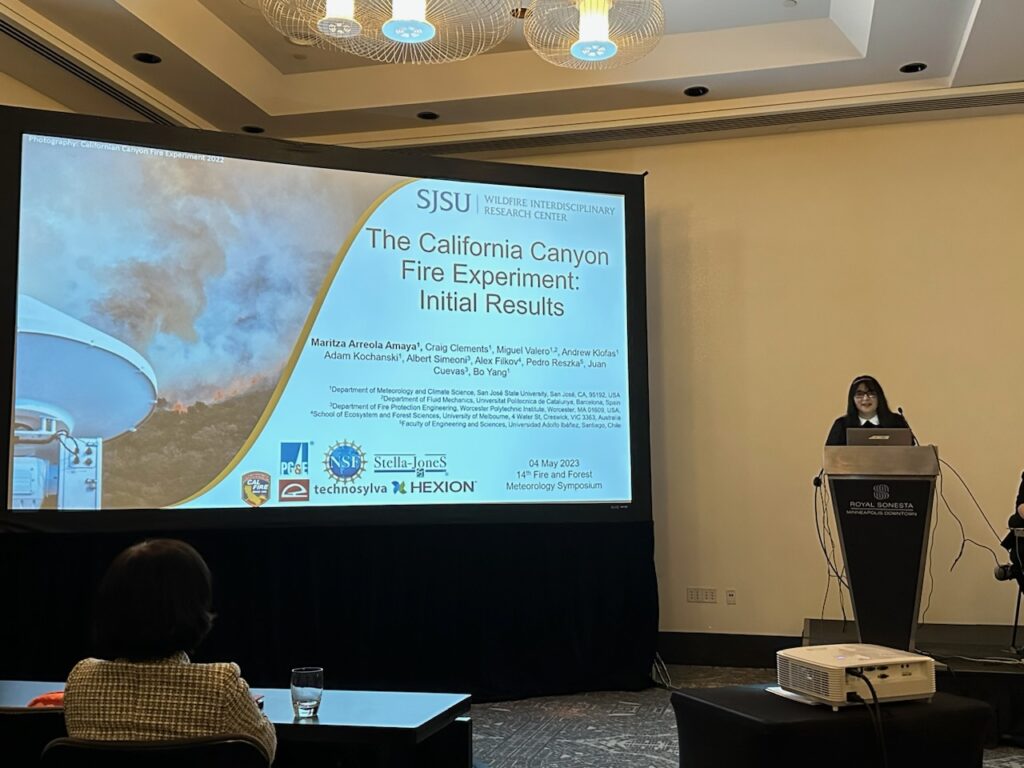
Wildfires in complex terrain like canyons are known to be particularly dangerous. Canyon fires often “blow up” or “erupt,” exploding suddenly with intense heat and spreading rapidly—and too often causing fatalities among firefighters. In the ninth session of the 14th Fire and Forest Meteorology Symposium on 4 May, Maritza Arreola Amaya presented initial results from the California Canyon Fire experiment, a controlled burn that was intensively documented to help better understand the behavior of canyon fires.

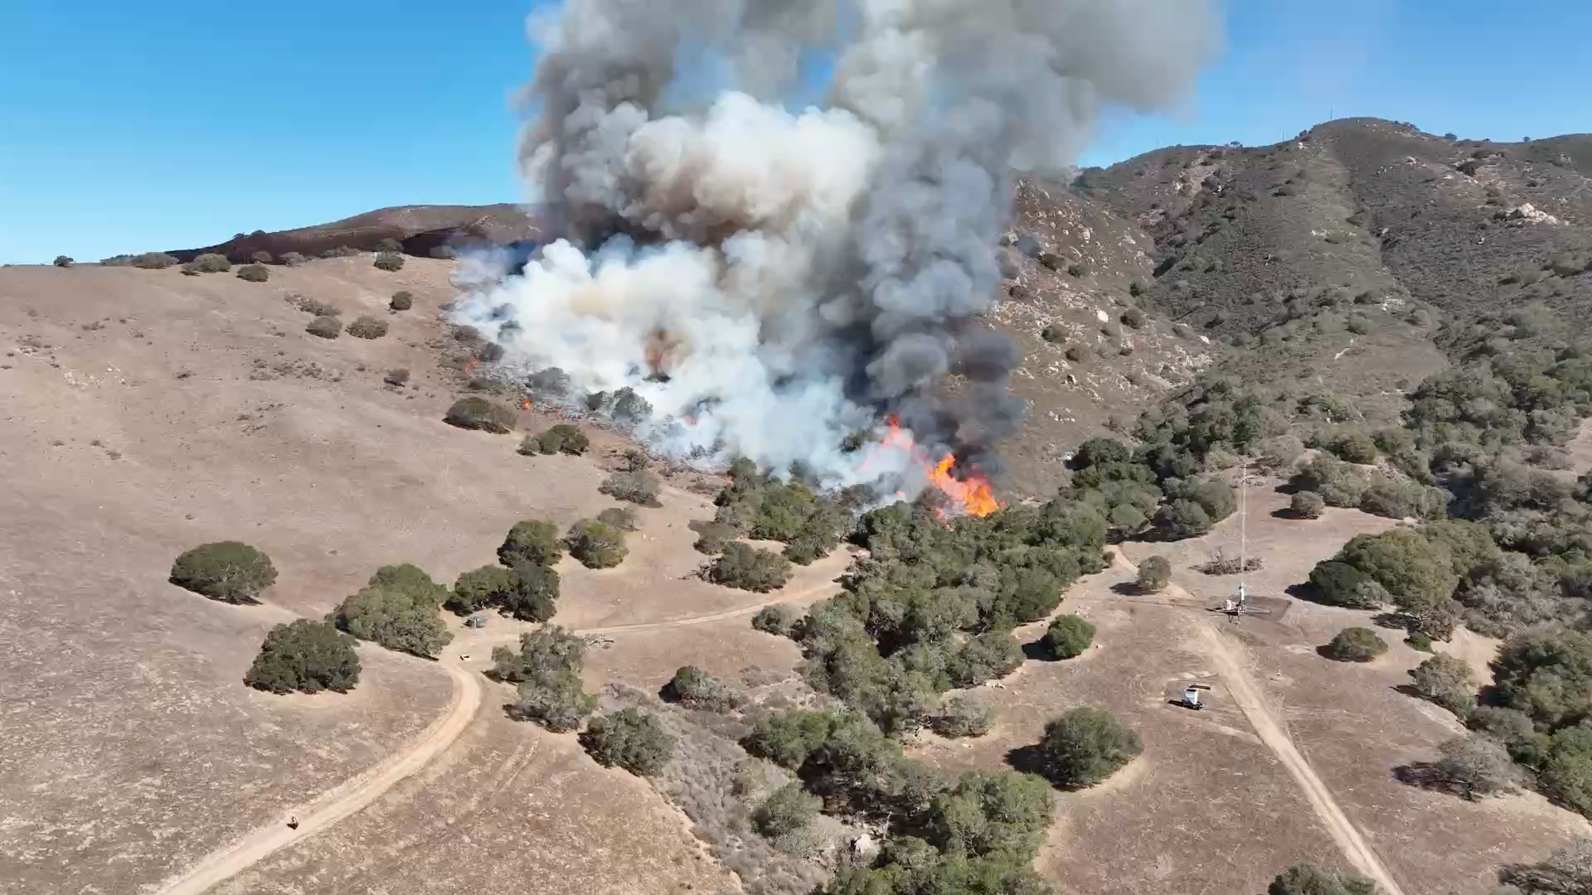
In this experiment, conducted in Central California’s Gabilan Range, a fire was ignited and monitored by a large team who placed sensors around the fire site and monitored the blaze from the ground, from the air with balloons, drones and helicopters; from meteorological towers; and with vehicle-mounted instruments including Radar, LiDAR (“light detection and ranging,” which uses laser light pulses to build three-dimensional images), and SoDAR (“sonic detection and ranging,” which uses sound waves to measure wind speed at different heights). The fire was lit near the bottom of the canyon in steep terrain of chaparral and sparse oak trees. It moved quickly up the canyon, the first time a fire of this size has naturally done so while under intense monitoring.

Flame attachment and v-shaped spread of the California Canyon Fire controlled burn. Image: CAL FIRE

The fire spread up the walls of the canyon in a “v” shape. It clearly exhibited eruptive behavior including flame attachment—in which hot gases rising from the fire downslope heat the unburned fuel further up the slope, leading to an intense, quickly spreading fire front. A highly turbulent, rotating plume of smoke emerged, and air was rapidly entrained into the fire, where temperatures reached nearly 800 degrees Centigrade (1472 Fahrenheit).

While some instruments were destroyed by the flames, researchers at San Jose State, the NSF-UICRC Wildfire Interdisciplinary Research Center, and more are eagerly analyzing the data collected to help improve understanding and modeling of dangerous canyon fires.

“Working on this one-of-a-kind canyon project was one of the coolest things I’ve ever done. Seeing the experiment that took so long to organize and set up finally come to life was amazing. It involved countless hours setting up complicated instrumentation so that ultimately the behavior of a wildfire on canyon terrain could be analyzed for the first time naturally moving up a large canyon. I know that this successful experiment will play a big part in future investigations involving wildfires on complex terrain and the danger they bring to firefighters.”

Maritza Arreola Amaya

Meeting registrants can view the recording of this session here. Recordings become publicly available three months after the meeting.

For a real-life example of a fatal canyon fire and the weather conditions that worsened it, see our post about the Yarnell Hill Fire.


About 14Fire

Meteorology and wildfires are intimately interconnected—and wildfires are becoming increasingly severe and frequent in many parts of the United States. From local residents and firefighters on the ground to planners and insurers, to people hundreds of miles away breathing wind-driven smoke, society relies on our ever-improving ability to understand and forecast the atmospheric conditions relating to wildfire. The American Meteorological Society’s 14th Fire and Forest Meteorology Symposium brought together researchers and fire managers to discuss the latest science.

The Yarnell Hill Fire: Microbursts, Density Currents, and 19 Lost Lives

A Research Spotlight from the 14th Annual Fire and Forest Meteorology Symposium, 2–4 May, 2023

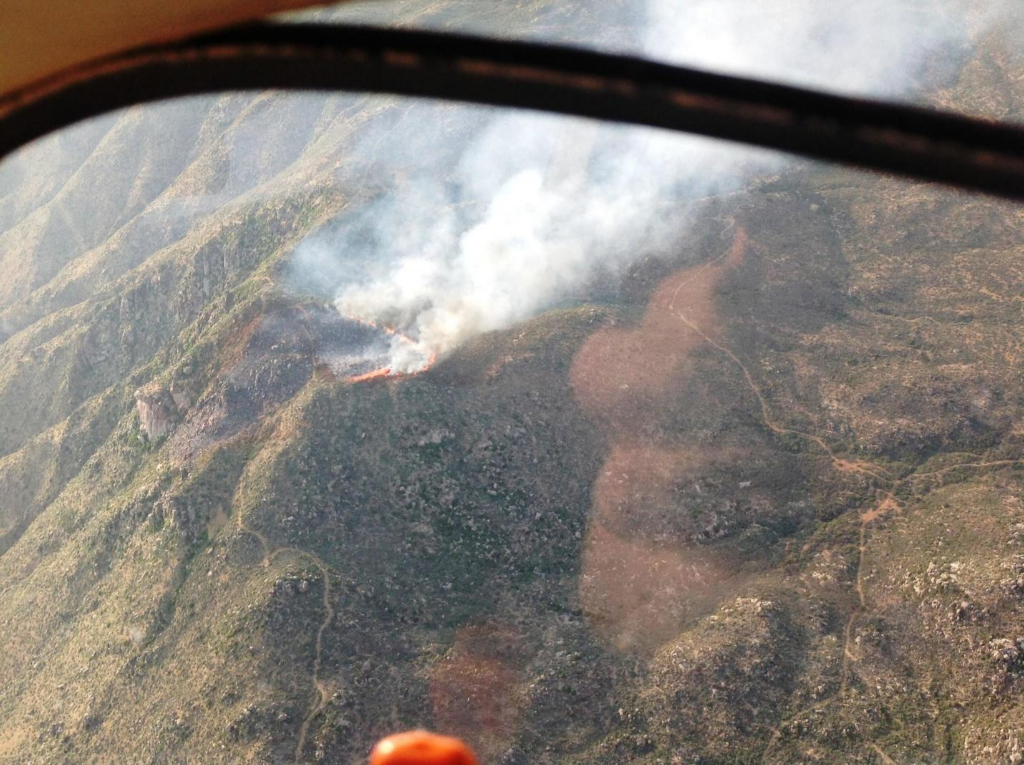
The Yarnell Hill Fire the day it began, June 28, 2013. Image credit: USDA

Arizona’s Yarnell Hill Fire ranks among the U.S. wildfires with the most firefighter fatalities. On June 30, 2013, members of the interagency Granite Mountain Hotshots were entrapped in a canyon by fire due to rapidly shifting wind conditions. Many attempted to take shelter but were overwhelmed. Nineteen firefighters died and the fire, fed by the strong winds, blazed out of control. The tragedy and damage devastated the community of Yarnell, Arizona.

A joint team at Embry-Riddle Aeronautical University and North Carolina A&T State University has been using simulations to help understand exactly what happened. A recent presentation by Michael Kaplan et al. May 2, 2023 in the first session of the 14th Fire and Forest Meteorology Symposium broke down the events at the meso-γ (2–20 km) scale leading up to the tragedy, the latest in a series of analyses starting at large scales and moving towards ever-finer resolution. They found that a density current (a flow of denser air that intrudes underneath less-dense air) and its secondary circulations drove the winds that forced fire into the canyon where the Granite Mountain Hotshots were located.

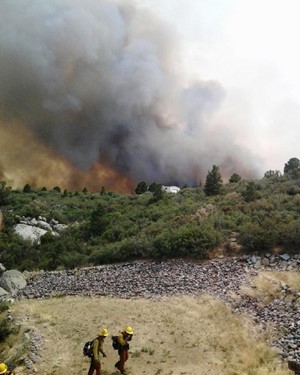
Firefighters near the Yarnell Hill Fire on June 28, 2013. Image credit: USDA

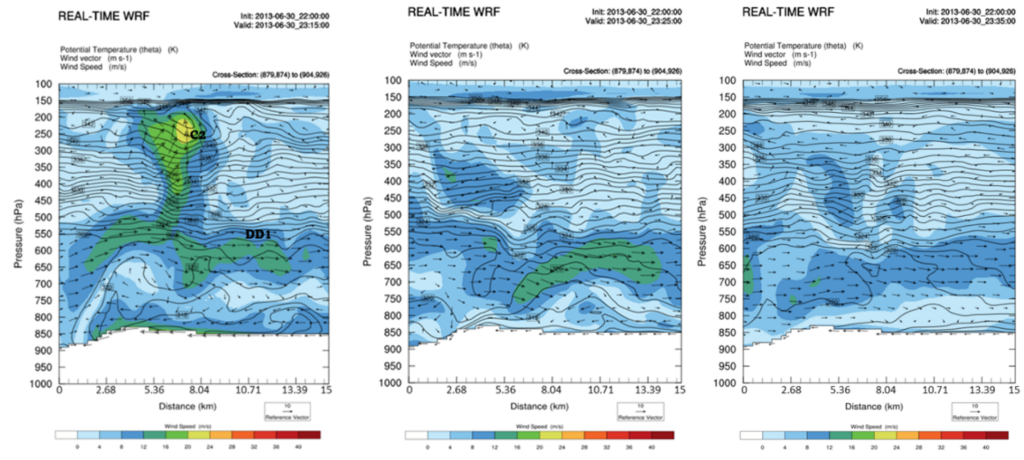
A squall line that developed over the Colorado Plateau on the morning of the 30th moved southwestward rapidly, strengthening over the Black Hills and Bradshaw Mountains on the way, until it died out further to the southwest over the Weaver Mountains near Yarnell. From this dying squall line developed a density current that produced unusual air circulation patterns in combination with the area’s complex terrain. Simulations by the Weather Research and Forecasting (WRF) model suggest that the fading density current created conditions in the Weaver Mountains that were highly conducive to downward air motion. This resulted in a series of strong localized downdrafts similar to microbursts near the fire site.

Earlier in the day, the fire had been moving towards the northeast, driven by southwesterly winds. Within 1–2 hours in the late afternoon, the winds shifted and intensified rapidly, becoming northwesterly, then northeasterly, blowing at 45 miles per hour and driving the fire (now blazing at 2,000 degrees Fahrenheit), in a southwesterly direction. Kaplan called these shifts “dramatic, remarkable changes.”

Wind direction and speed (blue arrows) and direction of Yarnell Hill fire motion (red lines) at 3:30–4:30 p.m. and 4:30–5:30 p.m. local time on June 30, 2013. Image: State of Arizona Serious Accident Investigation Team

In the end, “The entrapment of the Granite Mountain Hotshots was likely the result of very, very intense redirected winds” that continued over a longer than expected period, Kaplan said. “Even after they got the initial surge of northeasterly flow [due to the density current] the Hotshots had to deal with more surges of high momentum” from the series of microbursts. He noted that despite the Granite Mountain Hotshots’ high level of experience, “This is something firefighters may not have really been [expecting] to occur.”

Vertical cross-section of potential temperature and isotachs from 3:15 to 3:35 p.m. Arizona time on June 30, 2013, showing new cells forming behind the density current near Yarnell, associated with microburst downdrafts. Image courtesy of Michael Kaplan

Kaplan’s team will continue to work on their simulations of conditions associated with the Yarnell Hill Fire, with the hope of providing information that can help prevent similar entrapments, and deaths, in the future.

Meeting registrants can view the recording of this session here. Recordings become publicly available three months after the meeting.

__________________________________________________________________________________

About 14Fire
Meteorology and wildfires are intimately interconnected—and wildfires are becoming increasingly severe and frequent in many parts of the United States. From local residents and firefighters on the ground to planners and insurers, to people hundreds of miles away breathing wind-driven smoke, society relies on our ever-improving ability to understand and forecast the atmospheric conditions relating to wildfire. The American Meteorological Society’s 14th Fire and Forest Meteorology Symposium brought together researchers and fire managers to discuss the latest science.