Subtle, but Sultry: A Fog Story

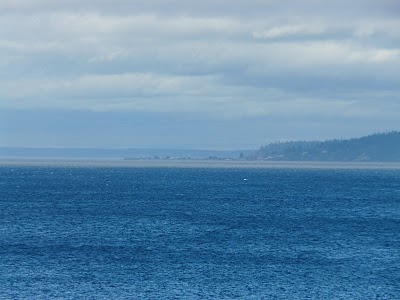
On a day of extremes in the West (with downtown Los Angeles, for example, setting an all-time record high), Cliff Mass posted this fine example of a fog forming as a thin, low-lying layer over Puget Sound.

Fog over Puget Sound, posted on Cliff Mass Weather Blog, from Greg Johnson of www.SkunkBayWeather.com.

Sultry Pacific air was moving in from the southwest. The dewpoints in the Seattle area soared into the high 60s Fahrenheit. Mass explains:

The humidity is so large that there has been some condensation in the form of shallow fog over parts of the Sound…which is cold enough to cause this moisture to condense. Some wind was also helpful, since it mixed the water vapor towards the cold surface.

Walking a Fine Hydrologic Line

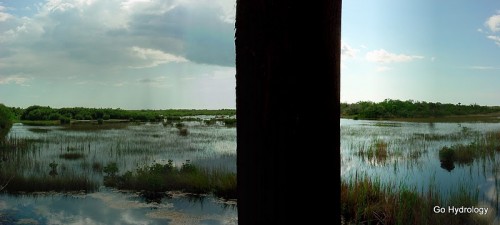
by Robert V. Sobczak, National Park Service, Big Cypress National Preserve.
Reposted from his blog, The South Florida Watershed Journal.

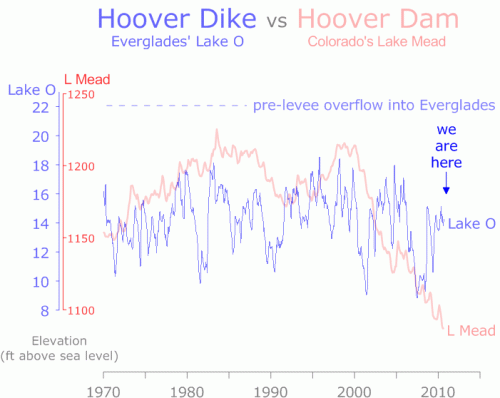
Are Florida’s Lake Okeechobee and Colorado River’s Lake Mead comparable?

After all, a Hoover Dam (or dike) surrounds them both.

Lake O bounces from deep drought to levee-lapping flood stage from one year to the next. We’ve had two deep drops into drought this past decade: the first in 2001 and the second (and longer one) in 2007, plus those couple high years during the hurricane frenzy of 2003-2005.
Keep in mind the difference between extreme drought (9 ft above sea level, 1.7 million acre feet) and extreme flood stage (18 ft above sea level, 5.3 million acre feet) is less than 10 feet.

Compare that to Lake Mead’s decade-long decline:
In 1999 it was flush at over 1200 ft above sea level high and holding 28 million acre feet of water, but has steadily dropped ever since.
Current stage is around 130 feet lower and only 10 million acre feet (and dropping). Here’s a recent article describing how water planners are trying to cope.
Why the difference?
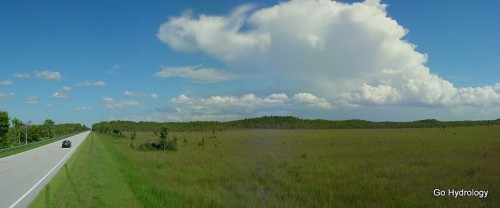
Flat south Florida is rain rich but storage poor, while the arid West has storage galore (with its deep canyons) but not much rain …
And more recently, hardly any snow melt either.

“The drought can’t last forever,” Western water planners seem to think/hope.
Here in Florida, as much as we like seeing those storms veer away “safely out to sea,” the Lake is a couple more near misses and a dry (and warm) La Niña winter ahead from a plummet into spring time drought.
On the other hand, all it takes is one big “rain maker” to send us up into flood stage.
Florida walks a fine line between flood and drought.

A Slow Start, but Gaining Fast

Tropical Storm Lisa became the 12th named storm in the Atlantic Basin this week in what has suddenly become the active 2010 hurricane season that forecasters months ago had predicted. Nine of those twelve storms formed since August 21, with five of them becoming hurricanes. Before that, only one of the first three named storms (Alex) even reached hurricane strength. By contrast, 2005 (9 out of 28) and 2008 (6 out of 16)  both had numerous storms form before August 20. Why the delay this year? According to a story in Newscientist.com, a mass of hot, dry air over the oceans stunted the formation of tropical storms. Scientists traced this dry air to a massive ridge of high pressure that sat for months over Europe and Asia, causing an intense heatwave in Russia and severe monsoon rains in Pakistan this summer that killed thousands of people. But just as mid-August arrived, when the typical height of Atlantic hurricane activity is imminent, things changed. As the Weather Underground’s Jeff Masters wrote in his blog on August 17:

Vertical instability, which was unusually low since late July, has now returned to near normal levels over the tropical Atlantic, though it remains quite low over the rest of the North Atlantic. Instability is measured as the difference in temperature between the surface and the top of the troposphere (the highest altitude that thunderstorm tops can penetrate to). If the surface is very warm and the top of the troposphere is cold, an unstable atmosphere results, which helps to enhance thunderstorm updrafts and promotes hurricane development. Since SSTs in the Atlantic were at record highs and upper tropospheric temperatures were several degrees cooler than average in July, enhancing instability, something else must have been going on to reduce instability. Dry air can act to reduce instability, and it appears that an unusually dry atmosphere, due to large-scale sinking over the Atlantic, was responsible for the lack of instability.

Not until the heat wave broke near the end of August did the tropical storms really begin to form in earnest, with four storms (Danielle, Earl, Fiona, and Gaston) arising just between August 21 and September 1. And spurred by those record-high SSTs mentioned by Masters, the 2010 season has not only produced 12 named storms and 6 hurricanes, but 5 major hurricanes–four of them Category 4–making that slow start seem like a distant memory. To put this season in historical perspective, there have been yearly averages of 14 named storms, 8 hurricanes, and 4 major hurricanes since the current active Atlantic hurricane period began in 1995. This season is just one major hurricane away from moving into a 7-way tie for 3rd-most major hurricanes in a season, topped only by the 7 major hurricanes in 1961 and 2005 and 8 in 1950 (lists of most active seasons in various categories can be found here).

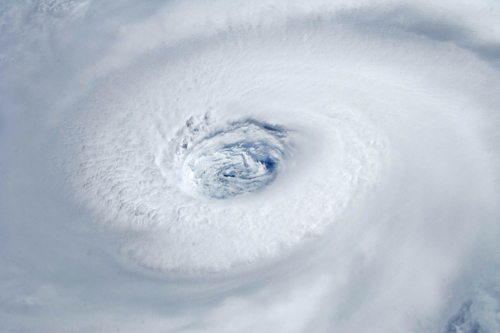
This photo, taken from the International Space Station, shows the eye of Category-4 Hurricane Igor at 10:56 Atlantic Daylight Time on September 14, 2010, as it advanced over the Atlantic Ocean. (Photo credit: NASA Earth Observatory.)

Nowcasts: Forecasting's Achilles Heel

by Cliff Mass, University of Washington
Adapted from a post from this weekend on Cliff Mass Weather Blog.
On Saturday we experienced a noticeable forecast failure and one that in some sense was self-inflicted.
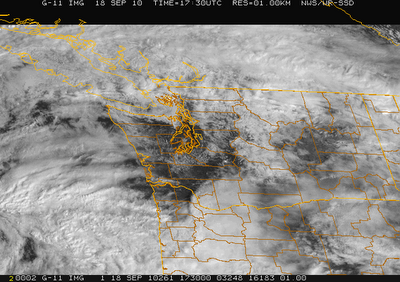
Here in Puget Sound country it was going to be a beautiful day…lots of sun and temps rising into the 70s. You could look outside or view the visible satellite picture.

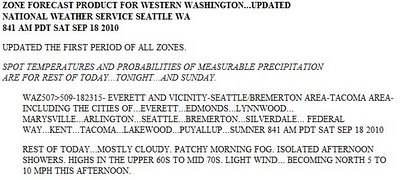
On the other hand the National Weather Service forecast RELEASED THAT MORNING painted a less optimistic picture.
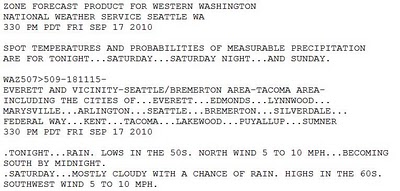
And Friday’s forecast was even more pessimistic.

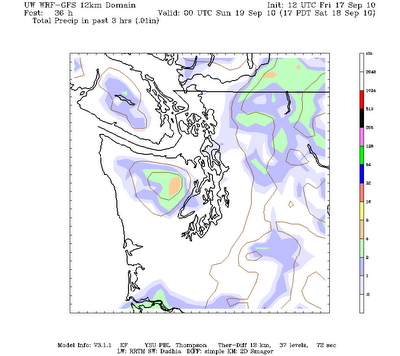
The computer forecasts on Friday showed the break between systems (see example) and certainly on Saturday morning it was clear.

Why didn’t the message about a spectacular break on Saturday get out?
I think there are three main reasons:
1. The National Weather Service forecast cycle is only updated every 6 hr in most cases and there is a lack of emphasis on nowcasting–describing what is happening now and during the next few hours.
2. There is a distinct tendency for the National Weather Service to broadbrush their forecasts–smear out clouds and weather over an extended period and not to put emphasis on breaks in the weather…even when they are pretty obvious.
3. Finally, there is the tendency in the NWS to maintain forecast consistency–staying with the same story–even when new guidance suggests otherwise. This is based on an internal philosophy not to jerk the forecast around as numerical guidance changes.
Personally, I think this all has to change…and in fact this blog is partially a reaction my feelings.
I believe that that providing frequent updates on current and expected weather is a hugely important area for development and that society has much to gain from this direction. For many of us, knowing what is happening and what will happen in the next 6 hrs is hugely important…and has great value for saving property and lives. To be fair, when severe weather is occurring the NWS does do more nowcasting, but I think they need to do so on a more regular basis.
In a day with smartphones, internet-capable cell phones, and computers on the internet everywhere, the ability to deliver real-time weather information exists. New software applications, better computer modeling, and a huge increase in observations will make the information available. We just have to put the package together–and society has much to gain from it.
The nightly weather on the local news is great, but people need weather information all the time…and we have to find a way of delivering it. An idea: every major city could have a nowcasting weather broadcast on the internet, updating the current weather situation every 15 minutes.

Danger Lurks where Weather Statistics Lack

In his new book, Hot Time in the Old Town: The Great Heat Wave of 1896 and the Making of Theodore Roosevelt, Edward P. Kohn tells how New York City’s government generally dithered while casualties mounted. During the heat wave in 1896, an estimated 1,300 people died as 10 straight days of 90-degree-plus heat, high humidity, and no wind baked the crowded working class tenements. Unfortunately, City Hall wasn’t keeping close track of what was happening until too late.
Roosevelt, then president of the city’s Board of Police Commissioners, was an exception. He ordered vendors to supply ice–normally too expensive for ordinary workers–for free.

Roosevelt personally supervised the ice distribution from the police precinct houses, not only “busting” this particular trust, but also having intimate contact with the city’s working poor.  Writing his memoirs years later he would remember the “gasping misery of the little children and of the worn-out mothers.”  Such scenes must have helped shape the man who was about to become the dominant figure of the Progressive era.

Kohn makes a perceptive point that general unawareness compounded the deadliness of the 1896 heat wave and can still exacerbate heat waves today. Even while some of us have begun waking up to the dangers of heat–especially since Chicago in 1995 and the European Summer of 2003– when complete, reliable, and immediate statistics are not available, heat is an underrated, quiet killer, more lethal than most people realize, and usually more lethal than necessary:

Images of forest fires and smoke-choked Moscow filled American televisions, yet the tremendous death toll from the heat wave attracted little attention.  Only in mid-August did the Moscow city government report that the death rate in the city had doubled during the heat wave, resulting in three hundred extra deaths every day.  The Russian heat wave, then, was a historic and catastrophic natural disaster.  But it was underreported and will soon fade from our collective memory.

Now we’re galloping onward with fall, circulation patterns have changed and the summer’s heat has been replaced by other concerns. Reading Kohn’s book is a good way to reflect on the value of keeping good weather impacts statistics.

If Climate Isn't Stable, Are We?

by William Hooke, AMS Policy Program Director
a portion of a series of essays from the AMS Project, Living on the Real World
In a short period of time (say, one or two hundred years), the human race has greatly grown in total numbers; has radically increased its per capita use of resources of every type; and has accelerated the rate of social change and scientific and technological advance.
In a short period of time? In science, a statement like that invites, maybe even demands a comparative. Short compared with what? Now you and I might look at this and say, “Well, a couple of hundred years is short compared with the age of the Earth itself, or with the ten thousand years of human civilization.” But here’s an additional list: Human success has occurred in a time short compared with

  • time scales of (“major”) climate variability;
  • the recurrence interval for natural extremes;
  • the time required for the emergence of unintended consequences;
  • the time required to prove we can “keep it up;”
  • the time required for the implications of our success to sink in.
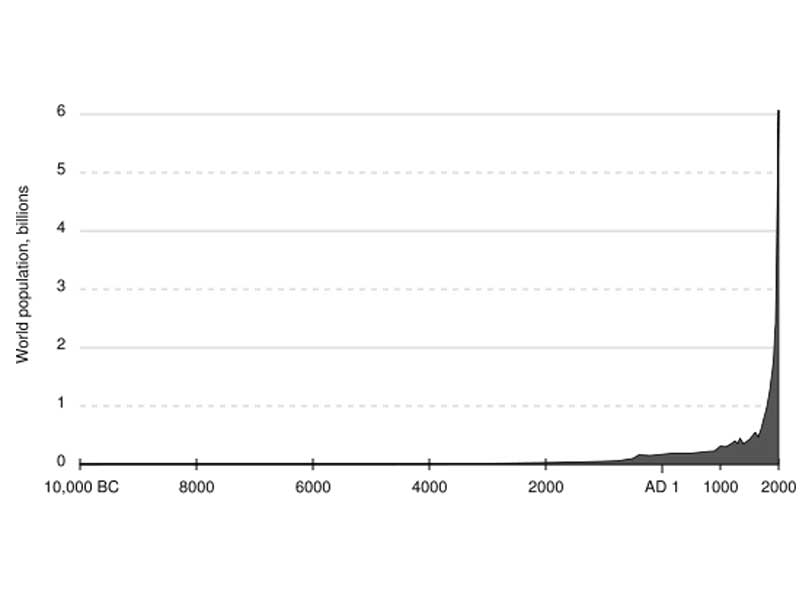
Each of these realities enables us to make a prediction about a different aspect of our future. Let’s look at the first: time scales of (“major”) climate variability
In the climate-change debate, much has been made of this, by both sides. The Earth’s climate has at times over the past few billion years been at times much colder, and at other times much hotter, than it is today. But during the last two hundred years, the time of this extraordinary human success, climate has been fairly stable.
If climate hadn’t been so stable during this period, then we might not even have the word “climate” in our vocabulary. We wouldn’t think the concept was useful! And arguably, we might have been better off! Think a little bit about this. Suppose you’re in a job where you directly see the impact of weather on your labors. Such jobs are in the minority these days, but they matter – a lot. Take farming. To oversimplify: you want to base your decisions throughout the year on the weather – what to plant, when to plant, when to water, when to apply pesticides and fertilizers, when to harvest. But you have to make many of these decisions based on a time horizon much greater than any useful weather forecast.
Then it occurs to you. Although the weather is variable year to year, these variations occur around a set of average conditions: the average last frost of the spring, the average spring rain, the average summer temperature and sunlight, the average first frost of the fall, etc. So you go with that, and it helps. Then, as you start looking into it more closely, you realize that the average you calculate depends upon how many years you include in the calculation: do it for the past ten years, and you get one set of answers. Do it for the past twenty and you get another. Do it for ten years, but for a different ten years, and you get another answer still. Your head starts to spin…
Meanwhile, over this same period of 200 years, while the human race has been on a roll, scientists have made some remarkable discoveries. They started looking hard at glaciers and the landscapes around them and discovered that ice, as much as a mile thick once covered much of the Earth, as recently as 10,000-20,000 years ago. Whoa! And they discovered looking back that at times the entire Earth must have felt tropical – that it was hot and steamy pretty much everywhere. Who knew? So the reality is that the Earth and its atmosphere and its weather are resolutely variable, on all time and space scales. From the standpoint of coping with climate variability and change of whatever cause, we might be better off simply asking questions like: how and in what ways are temperature and rainfall patterns, etc., likely to change over the next few hours? The next few days? The next few centuries? We’d be making no artificial distinctions between weather and climate (certainly nature doesn’t draw any such line of demarcation). Scientists are working hard on all this! The stakes of getting the right answers for the right reasons couldn’t be higher.
In any event, for the past two hundred years, the climate has been remarkably stable. This narrow range of climate variability hasn’t challenged us so greatly. Humanity has been able to take the easy way out. We have tuned our decisions and actions in weather-sensitive sectors like agriculture, water resource management, energy-demand, transportation etc., to a rather narrow range of climatic variables. And we’ve been lucky! It’s worked so far.
But we know from the science that climate is constantly changing, in part just because of the nature of the atmosphere and oceans, but in part because we’re tinkering. We’re taking all that carbon that plant life took out of that tropical atmosphere from millions of years ago and deposited into sediments – and we’re burning it and putting it back into the atmosphere. It’s looking like our winning streak is about to play out.
This leads to a prediction: The future will be characterized by adverse climate shifts. We don’t know exactly how much, and we don’t know when. But we do know this. We won’t like them! We’ll view them as unfavorable. Why? How do we know they won’t be to our liking? Because we have tuned our climate sensitive activities – our human settlement and water use, our agriculture, our energy production and use, and many other aspects of our daily lives – to a narrow range of climate conditions.
Note that this disaffection will be true whichever way the climate changes. When and where it gets wetter, we’re going to wish it were drier (I planted wheat instead of corn. I wish I’d planted corn!). Where it gets hotter, we’re going to wish it were cooler (ski season in Colorado is shorter than it used to be; I invested in my resort hotel at just the wrong time). Where it gets cooler, we’re going to wish it were warmer (Brr! My condominium heat pump here in Georgia isn’t up to this cold snap). When things dry up, we’ll long for the moisture (our hydroelectric power in the Pacific northwest is no longer meeting as much of our energy needs).
Uncertainty: A Mathematician's Perspective

by Sean Crowell, Dept. of Mathematics, Univ. of Oklahoma
One thing we enjoy in mathematics is certainty of our knowledge. This is because the things we know are logically certain (neglecting Gödel), and logic is all there is for mathematicians. In fact, unjustified certainty can be very disturbing to professors attempting to teach you to prove things rigorously in foundation courses. Never mind all of the debate in recent years about the philosophy behind these things. Most of us have some inner threshold beyond which we say “the definitions and axioms are satisfied, and so the theorem is proven!”
For a long time I had heard applied mathematics described as “messy.” Really this meant that the calculations done were unpleasant, or the proofs were complex and tedious and inelegant. But I’ve discovered a far more terrifying aspect about this work, one which nonmathematicians take in stride.
There is no certainty in science. There is merely evidence. Again, we have an inner threshold, only once it’s crossed, we say “I now believe the conjecture supported by the evidence.” How is this different from logical proof? The biggest difference is that we have no perfect measuring stick to go by. All data has errors in it. All models are flawed. And yet, through a mysterious bootstrapping process, data is used to improve models, which is used to improve observational techniques and to tell researchers what they should be observing.
The casual and especially mathematically trained reader will shake their head and say “Errors upon errors! How can we say we know anything?” At this point we can trot out statistics that point to the advance of science. Warning times for severe weather have gotten much better due to this process. New particles have been discovered by this process. Diseases cured and sheep cloned. All using noisy data and imperfect models. It works! For whatever reason, the universe that we can interact with, though mysterious, is far more regular than irregular. If we watch long enough, we can uncover its secrets.
(Editors’ note: This post was first published on Sean’s blog, A Mathematician in a Meteorologist’s World, on Wednesday 15 September. We liked it too much to merely excerpt it. Sean is a doctoral candidate in mathematics studying tornadic flow.)

Recreational Tornado Chasing: the Psychology of Risk

Who seeks the thrill of nature at its most beastly? Researchers at the University of Missouri’s School of Natural Resources surveyed people who sign up for tornado chasing with five different tour companies in Tornado Alley and found that:

  • 62 percent are male
  • 63 percent were single.
  • The mean age was almost 42.
  • More than 25 percent had an advance degree.
  • 33 percent earn more than $100,000 per year
  • More than half are visiting from outside the United States: one-third from Europe, 13 percent from Canada (although one company cooperating in the study chased in Canada), and 11 percent from Australia.

We know that chasing is a hobby that is hard to shake. Not all these tourists are newbies: 53 percent had previous chasing experience and fewer than half of those had done so with a tour company, yet over 30 percent of those with chasing experience had seen a tornado before. 68 percent said they would be willing to spend money on another chase tour.
In a Master’s thesis based on the study, Shuangyu Xu builds psychological profiles of people based on “sensation-seeking” scales of behavior that might identify motivations for chasing tornadoes (asking questions about, for example, predilections for strange foods, comfort with people who are different, and predilection for restlessness). Previous studies had used similar psychological tools to investigate mountaineering, sky diving, white water rafting, and other high risk recreation. The storm chasing tourists scored very moderately on these tests for sensation-seeking behavior.

[H]ang-glider pilots (Wagner & Houlihan, 1994), mountain climbers (Cronin, 1991), skiers, rock climbers, white water kayakers, and stunt flyers (Slanger & Rudestam, 1997) displayed high levels of sensation seeking across all dimensions. These results may suggest that recreational storm chasers are different from other risk recreation activity participants, especially because their personalities seem to be more drawn to new experiences rather than the risks involved.

The tourists professed to sign up to be near nature, to witness natural power and beauty, and to learn about tornadoes. They were not generally doing it to impress people or do something extraordinary, and only moderately interested in the thrill, danger, or risks.
About half of the tourists were able to see a funnel cloud on their trip (and almost 35 percent saw a tornado on the ground). Interestingly, though, while nine companies originally agreed to distribute surveys to customers, four ultimately did not, citing inadequate weather and challenging economic conditions. Maybe the real risk takers here are not the tourists but the tour operators, who put their financial well-being at the mercy of both the business climate and the weather.

Not Seasick…Science Smitten

What if you are asked to be part of a scientific expedition aboard a non-luxurious research vessel, surrounded by complete strangers, forced to face rough seas – and sea sickness, 16 hours’ work shifts, no weekends or recreational activities, no days off, lots of hours under the sun working with scientific equipment, poor internet connectivity and no interaction whatsoever with the outer world? While many people would say: “no thank you”, I was euphoric when I received an email which first line read: “Congratulations, you have been selected as a participant of the Sixth Aerosols and Oceans Science Expedition”.

So begins Mayra Oyola’s engaging story of work aboard the NOAA research vessel Ronald H. Brown for the AEROSE campaign

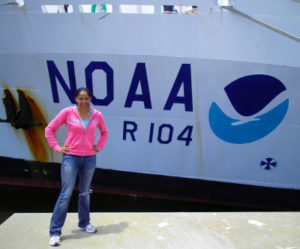
Beside The Ronald H. Brown.

under the auspices of Howard University, NOAA, and other institutions. It was apparently a love affair not just with the science and the sea, but with a lidar, too:

[E]very scientist is …assigned at least one particular instrument and is expected to become the one and only expert on that matter.  In a sense, every scientist establishes a sort of “bond” with his/her assigned instrument that is very similar romantic affair. You can grow such a strong love and hate relationship with it. There are days when you two can get along just fine. But other days you have to fight against temptations (like throwing it overboard or smashing it with a sledge hammer). There are days when your appointed instrument gets seduced by Murphy (in other words, goes haywire) and you have to make him/her understand that s/he is in a monogamous relationship with you.  As some partners, these instruments can be gold diggers (they cost hundreds/thousands of dollars) and are high maintenance as well.

And, this enticing view of the ocean:

When people say I must be crazy to have loved so much sailing on this expedition, I just ask them a couple of questions: Have you seen bioluminescence or done some fishing in the middle of the Atlantic basin? Or have you ever had the chance to catch a movie under the stars in the middle of the Sea? Well, I had.  There are some great perks about sailing on the Brown. There is nothing as beautiful as lying on deck at night for the most spectacular stargazing sessions you will experience in this world.  There are unusual things that you will never see in your everyday life: like watching a double rainbow or the most impressive towering cumulonimbus cloud EVER at the Intertropical Convergence Zone (ITZC). I also loved watching different marine life forms like the flying fishes, dolphins and squids (oh yeah, we saw squids!). Oh and the sunsets… sunsets that will take your breath away!….But the highest reward is this:  we get to do REAL science to solve REAL problems, such as improving the quality of satellite operations,   understanding the effects of aerosols in hurricane formation and intensification and learning how tropospheric ozone can be linked to global warming, among many other things. There is nothing that can top that!

Check out the full story, and picture gallery, here, and kudos to Oyola for such drawing a compelling portrait of science at sea. We talk about the need to communicate science, and we’ll talk more about it as the Annual Meeting approaches, but she’s set a strong example already.

NOAA Names Regional Climate Services Directors

Commerce Secretary Gary Locke announced the selection of six new NOAA regional climate services directors. According to NOAA Administrator Jane Lubchenco:

NOAA’s new regional directors are liaisons to state and regional users and providers of climate science and information; they will also bring information from the regions back into NOAA. They will work with our many partners to identify new and emerging regional climate issues and help NOAA develop products or services to address issues like local climate forecasts, drought plans or flood risk mapping.

The new directors will be stationed at the respective National Weather Service regional headquarters work for the National Climatic Data Center. They are:
Eastern Region: Ellen Mecray
For the last four years, Mecray led strategic planning for NOAA’s Office of Oceanic and Atmospheric Research  and facilitated  inter-and intra-agency dialog and collaboration on climate science in New England. She is the lead for the North Atlantic Regional Collaboration Team’s Climate sub-team which consists of 20 people representing all of NOAA’s line offices and key regional partners. Prior to joining NOAA, Mecray was an

Read more