This past year was a busy one at AMS. Along with the usual activities, there were a slew of events and new projects in the works. While BAMS, the Web site, and The Front Page communicate what is happening within the Society, there is another not-so-obvious resource to find out what’s going on: the AMS Annual Report. For instance, did you know:
The total number of AMS members at the end of the year was 13,963, and the number of full members increased for the fifth year in a row.
The Policy Program developed a disaster risk reduction alliance with the Aerospace Medical Association, the leading professional society of military medical doctors in the U.S. and overseas, on the topics of climate and weather-scale impacts to human health.
5,366 people attended AMS conferences and symposia, compared to 4,235 the previous year, and a total of 4,233 papers were presented.
The conversion to a new Manuscript Tracking System significantly increased production capabilities in the Publications Department.
The fellowship and scholarship program celebrated its 20th year, which, since its inception, has awarded nearly $8.4 million to more than 900 students.
118 broadcast meteorologists earned the CBM Certificate, bringing the total number of active CBMs to 470.
The AMS book Eloquent Science and Weather on the Air received “Highly Recommended” ratings from CHOICE, a journal of current reviews for academic libraries published by the Association of Library and Research Libraries.
The entire 2010 Annual Report is available on the AMS website.
Emergency Response Technology Goes On Demand
When the American Red Cross responded the morning after the 24 May tornado outbreak in central Oklahoma, they had a new tool in their pocket. The Warning Decision Support System—Integrated Information (WDSS-II), developed by NOAA’s National Severe Storm Lab, cut disaster assessment time from 72 hours down to 24, a major improvement that could save many lives when it comes to rescue in the wake of a disaster.
The WDSS-II works by narrowing when and where the severe weather most likely occurred. Using radars, satellites, and other observation systems, the On Demand feature of the tool records tracks of rotation and hail swath images that can be opened in Google Earth. When street maps are overlaid with these images, disaster teams can assess which areas likely need assistance first, as well as the most accessible routes to take.
“They no longer have to put boots on the ground to visually assess the situation before planning how they will deploy response teams,” comments Kurt Hondl, NSSL research meteorologist. “It makes the coordination and planning of the American Red Cross’s response so much more efficient.”
The WDSS-II On Demand software is available to American Red Cross officers and other assessment organizations. More than 250 volunteers in Oklahoma and Texas have been trained so far by the Red Cross to utilize the NSSL On Demand software. Other organizations, like FEMA and the Department of Homeland Security, have begun to take advantage of the technology as well.
Increasing Clouds with a Greater Chance of Hits
If you’ve ever stepped into the batting cage at your local amusement park, you know how difficult it is to hit a baseball. As Ted Williams once said, “Making good contact with a round ball and round bat even if you know what’s coming is hard to do. That seems to be the one major thing that all young players have difficulty with. Why? It’s the hardest thing to do in sports. ” That being the case (and who are we to argue with the man whom many consider to be the greatest hitter who ever lived), baseball players at all levels would be wise to check out the study published in the latest issue of Weather, Climate, and Society that analyzes the influence of weather conditions on the performance of Major Leaguers. 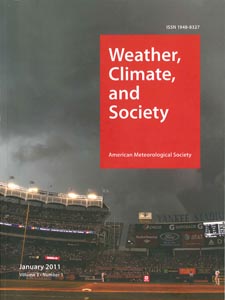
Wes Kent and Scott Sheridan of Kent State University examined statistics from more than 35,000 Major League games played in 21 different stadiums between 1987 and 2002, as well as NCDC cloud-cover data taken from the closest NWS office to the ballparks for all of the day games during the studied period. They found that hitters performed better on cloudy days, while pitchers’ statistics improved when the sun was shining. For hitters, this trend was most noticeable in batting averages, which when comparing clear-sky and cloudy-sky conditions improved from .259 to .266 for home teams and from .251 to .256 for road teams. For pitchers, strikeouts were the most salient statistic, increasing by almost half a strikeout per game on days with clear skies. The study also looked at a number of other statistics, including home runs, earned run average, errors, and winning percentage, with the results showing varying levels of weather influence. Additionally, the research made some interesting findings related to ballparks, with certain stadiums reflecting much more consistent trends than others, perhaps at least partially due to their architectural design.
In examining the batting and pitching stats, it really comes down to that fundamental skill of putting bat to ball that Williams talked about. As the authors write in the article:
One of the most crucial aspects to the pitcher-batter interaction is how well the batter can see the pitch. Changing cloud cover presents different playing conditions, with some playing conditions potentially helping a batter see a pitch, whereas others may make reading a pitch more difficult. For example, brighter conditions may result in increased eye strain for a batter and a higher level of glare in a ballpark. These factors could contribute to less than favorable conditions for a batter trying to focus on a pitch, impacting performance in a number of areas.
In a recent interview, the New York Mets’ David Wright supported this premise, saying, “When it’s overcast, your eyes are a little more relaxed, I think. There’s not as much squinting. Sometimes, when it’s really bright, it’s a little tougher to see as a hitter. I always prefer a little cloud cover.”
After all, according to Williams, you can’t understand hitting without understanding the science: “If there is such a thing as a science in sport, hitting a baseball is it. As with any science, there are fundamentals, certain tenets of hitting every good batter or batting coach could tell you.” If he were still alive and hitting, we bet Williams would use this new research to his advantage at the plate.
Oklahoma Mesonet Station Stands Tall in EF-4 Tornado
by Chris Fiebrich, Oklahoma Climatological Survey
It was bound to happen eventually. The Oklahoma Mesonet has 120 weather stations across the state, about one every 30 km. Since 1994, we’ve had a lot of close calls with severe weather, but the highest wind speed ever recorded had been 113 m.p.h. at our Lahoma station during a thunderstorm in August 1994. That all changed on May 24, 2011 when a strong tornado clipped our El Reno station. The graph below shows that winds gusted to 151 m.p.h. shortly after 4:20 PM. Along with the wind gust, the station recorded a strong pressure drop.
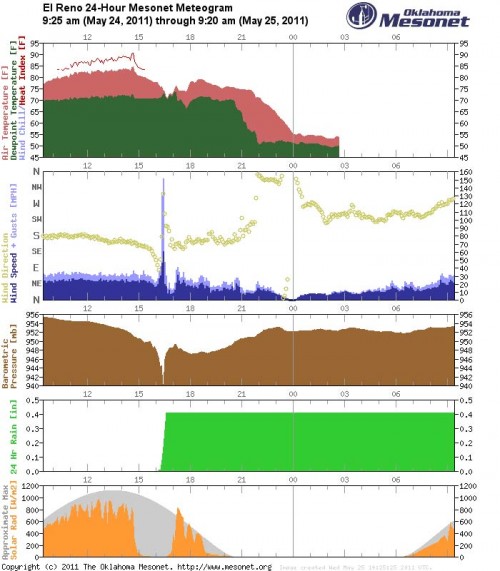
At this time, the tornado has been rated as “at least EF4” (see http://www.srh.noaa.gov/oun/?n=events-20110524-pns1 for the latest on the tornado ratings). The tornado was on the ground for 75 miles. It’s center was likely several hundred yards north of our station as it blew through.
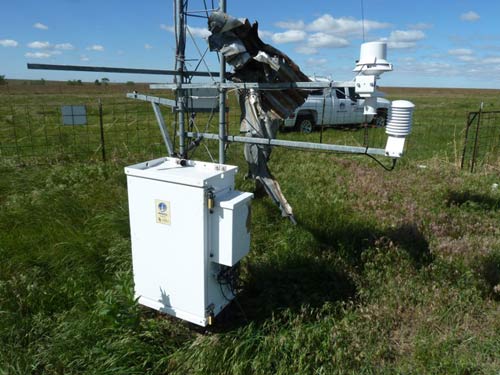
A piece of flying debris sheared off the station’s 2 m anemometer just after it reported a wind gust of 126 mph. The station’s temperature aspirator was also damaged, and one of the tower’s guy wires was snapped. A piece of metal debris was found wrapped around the tower. Despite minor damage, the tower stood tall and the official 10 m anemometer survived in perfect condition with a piece of metal debris wrapped around it. A large nearby tree was found uprooted and thrown across the roadway.
More pictures can be found on the Mesonet Facebook page at http://www.facebook.com/mesonet.
Interactive Slide Shows Joplin Before, After Tornado
By now, most if not all of us know what happened in Joplin, Missouri, on Sunday, May 22, 2011: the deadliest tornado in the modern era slashed across the city, killing at least 125 people. Now, a clever, interactive sleight of hand put together by The Hartford Courant enables readers to view the remarkable destruction in before-and-after satellite images.
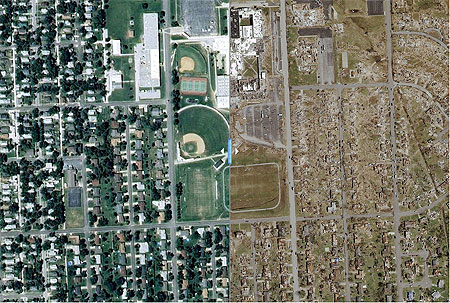
The image above is a screen capture of the before and after photos. A slider that you control, visible in the middle of the photo, separates the two images on the interactive version of the page: slide it right and you can see a full screen image of what southeast Joplin looked like before the violent EF5 tornado hit; slide it left, and the before image disappears, revealing the carnage left behind. Right again, and the greenness of neighborhoods in late spring with trees full of leaves lining tidy streets, the high school standing proud, unfolds across the screen. Left again, and the life many Joplin residents knew peels away, replaced by block after block of brown debris and lifeless destruction, including the decimated high school. It’s like something out of The Wizard of Oz, only in reverse, and makes one wonder how it could be that more people weren’t killed.
Deadliest Tornado in Modern Era Slashes Missouri
It hasn’t even been a month since violent, history making tornadoes made headlines across the United States, and yet here we are with another grim tornado record. The death toll from the violent tornado that shredded as much as a third of Joplin, Missouri, Sunday evening reached 116 Monday afternoon. That makes it the single deadliest tornado to strike the United States since NOAA began keeping reliable records of tornado fatalities in 1950. It took the top spot from the Flint, Michigan, twister of June 8, 1953, which killed 115.
The number of dead in Joplin jumped from 89 earlier in the day as news of recoveries as well as rescues were reported. While the number of dead is fully anticipated to increase, news outlets reported that at least five missing families were found buried alive in the rubble, which stretches block after unrecognizable block across six miles of the southwestern Missouri city of 50,000. More than 500 people in Joplin were injured, and the damage is eerily familiar, looking so much like the utter carnage witnessed in Tuscaloosa on April 27, 2011, when 65 died in that day’s twister.
The tornado event attributed to the single highest loss of life on American soil is the “Tri-State” tornado of March 18, 1925, which rampaged across southeastern Missouri, southern Illinois, and into southwestern Indiana. It killed 695 people on its seemingly unending 219-mile journey. But that was prior to our knowledge of families of tornadoes and the cyclical nature of long-lived supercell thunderstorms to form, mature, dissipate, and reform tornadoes, keeping damage paths seemingly continuous.
Prior to the effort by the U.S. Weather Bureau, precursor to the National Weather Service and NOAA, to maintain detailed accounts of tornadoes—and 64 years before yesterday’s event in Joplin—the last single-deadliest tornado in a long list of killer U.S. tornadoes was the 1947 Woodward, Oklahoma, tornado, which claimed 181 lives.
Yesterday there was also one fatality from a destructive tornado that hit Minneapolis, and that and Joplin’s toll combined with last month’s back-to-back tornado outbreaks, plus a handful of earlier tornado deaths this year, brings 2011’s death toll from tornadoes to 482—more than eight times the average of the past 50 years and second (in the modern era) only to the 519 recorded deaths from twisters in 1953. Two-thirds of this year’s fatalities occurred during April 27’s epic tornado outbreak across the South.
The Weather Channel has been providing continuing coverage of the rescue and recovery efforts in Joplin, with one of its crews arriving on scene moments after the tornado. The level of destruction in the city was too much to bear even for one of its seasoned on-air meteorologists. TWC also is reporting along with NOAA’s Storm Prediction Center on the possibility of yet another tornado outbreak, this time in the central Plains on Tuesday.
Observing Memphis Flooding from Above
The floodwaters of the Mississippi River continue their inexorable flow toward New Orleans and the Gulf of Mexico. Residents in Louisiana’s Atchafalaya Basin–most of them, anyway–continue to pack up their belongings and evacuate their homes after the opening of the Morganza Spillway (video of the opening can be seen here), which is diverting 763,000 gallons of water per second from the bloated Mississippi, but now threatens the homes and properties of as many as 25,000 people in the Atchafalaya River basin.
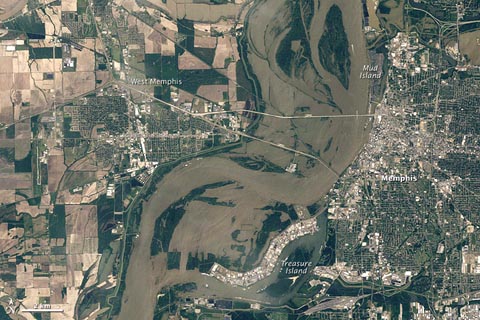
Meanwhile, other communities are already starting the recovery process from the flooding. In Memphis, Tennessee, the river is slowly receding after unofficially cresting at 47.8 feet last Tuesday, the second-highest level ever recorded in the city (it reached 48.7 feet in 1937). The satellite images below were taken by the multispectral imaging sensor called the Thematic Mapper on NASA’s Landsat 5 satellite. The top image shows Memphis in April of 2010, while the bottom image was taken last Tuesday, at the height of the flooding, with the flood waters clearly visible on both sides of the river. About 1,500 people in the Memphis area have applied for FEMA assistance in the wake of the flooding. (Photos courtesy of NASA’s Earth Observatory; more satellite pictures of the flooding can be found here.)

Policy Buzz: Senate Hearing Follows Tornado Outbreak
by Caitlin Buzzas, AMS Policy Program
On May 3, Dr. William Hooke, Director of the AMS Policy Program, testified before Senator John Rockefeller (D-WV) and other members of the U.S. Senate Committee on Commerce, Science and Transportation. He was joined by Bob Ryan, Senior Meteorologist at ABC7/WJLA-TV, Dr. Anne Kiremidjian of Stanford University and Dr. Clint Dawson of the University of Texas, together they discussed “America’s Natural Disaster Preparedness: Are Federal Investments Paying Off?”
As the hearing was convened in part as a response to the earthquake in Japan, Dr. Kiremidjian focused her testimony on earthquake and tsunami issues. Dr. Dawson discussed advances in storm surge modeling.
This hearing (full video here) took place soon after one of the worst weather disasters in the U.S. of the last century with tornadoes killing at least 327 in the South East. According to the National Oceanic and Atmospheric Administration (NOAA) this may have been the largest tornado outbreak in U.S. history. Although this disaster was horrific in terms of the many lives lost and the huge economic toll, the hearing gave our community the needed opportunity to highlight what we do and the importance of accurate weather forecasts and earth observation systems.
Dr. Hooke stated in his testimony that these systems and science play an especially important role in the United States:
Because of its size and location, the United States bears a unique degree of risk from natural hazards. We suffer as many winter storms as Russia or China, and as many hurricanes as China or Japan. Our coasts are exposed not just to storms but to earthquakes and tsunamis. Dust bowls and wildfire have shaped our history. And 70% of the world’s tornadoes, and some 90% of the truly damaging ones, occur on our soil.
Ryan emphasized in his testimony that amidst the many scientific improvements, the whole weather forecast process is a multisector enterprise that depends on the capabilities of, and cooperation with, Federal agencies. The Joint Polar Satellite System (JPSS) is an example of that critical Federal capability. As Congress decides what to cut in the upcoming budget deliberations, programs such as the JPSS will have to get the recognition they deserve to keep functioning. The data and imagery obtained from JPSS will increase the timeliness and accuracy of public warnings and forecasts of climate and weather events, thus reducing the potential loss of life and property. This has a direct effect on the health and stability of our national economy. It is important, even in a time of economic hardship, to keep programs like JPSS fully functional for the long-term health of the country. Both Hooke and Ryan made this point. Said Ryan:
Some may argue that loss of polar orbiting data will not degrade our current weather/climate observing and forecasting skill . . . but, what if they are wrong! Polar and geostationary weather satellites are an integral and critical core element of providing very accurate weather forecasts and life saving planning and decision making for weather and other natural disasters from tornadoes and hurricanes to fires, drought, dangerous air quality and oil spills.
As Dr. Hooke highlighted in his testimony there are several other things that can be done to improve our current disaster preparedness:
- Maintain our essential warnings system
- Bring to bear not just meteorology and engineering, but also social science
- Learn from experience
- Build public-private partnerships
- Explore No-Adverse Impact Policies for flood and other hazards
- Track progress/keep score. (There’s more about this proposal on Dr. Hooke’s blog, Living on the Real World.)
The issues that our community deals with everyday, highlighted through a hearing of this kind, are not just important to the world of science and meteorology, but important to the health and stability of the American economy and public as a whole. I believe that Senator Rockefeller, Senator Nelson, Senator Boxer and others left the hearing with not only a greater understanding of our community and the important role that we play in the health of our country, but with a continued desire to highlight the importance of our work.
Struggling to Categorize an Epic Tornado Outbreak
The numbers practically defy comprehension: 327 people killed in a single day; nearly that many reports of tornadoes that fateful day, April 27, 2011, when nature went on a spectacular rampage across the South; violent tornadoes in Mississippi, Alabama, Tennessee, and Georgia that generated winds of 180 mph, 190 mph, over 200 mph, ripping bark from trees, pavement from roads, even earth from the ground (video from The Weather Channel explains the scouring), and people from their homes and businesses, in cities and towns small and large; tornadoes that chewed up and spat out lives and belongings, mile after mile, for 132 miles straight in one twister. Having watched similarly violent yet lesser events unfold over the years and decades as warning times have steadily increased, in some cases long enough to jump in your car and drive out of harm’s way, it did not seem possible we’d ever again witness such devastation and widespread death from tornado winds, especially in a nation that has the best warning system for severe weather in the world. As has become painfully clear these last two weeks, however, one has to look way back to 1925—more than an average human lifetime ago—when either a single, marathon twister or a family of vicious vortices known as the Tri-State Tornado thundered across 219 consecutive miles of the Midwest and consumed nearly 700 lives—to find similarly overwhelming tragedy from tornadoes in the United States in a single day.
Annual tornado climatology and statistics for our nation make the historic events of April 27, 2011, even more difficult to believe: 60 people on average lose their lives to tornadoes each year–and for the past decade we’ve considered that number to be excessive; it takes 365 days annually to produce the 1,300 tornadoes we usually have, yet almost a quarter of those may now have happened in just a single 24-hour period (there were 292 reports of tornadoes on April 27, and the NWS has confirmed 143 so far); and fewer than 1% of all tornadoes recorded on our soil over decades ever churn with such violence that they are rated in the top tier of the Fujita tornado intensity scale, regardless of its evolving criteria … yet we had at least three of these most destructive tornadoes strike Mississippi and Alabama on this recent deadly April day.
Stunned weather enthusiasts and meteorologists alike have been searching for more than a week for ways to classify this maelstrom of tornadoes. Some have tried to fit this event into the mold created by the most prolific and extraordinary tornado event in U.S. history—the Super Outbreak of April 3-4, 1974, which in just 18 hours delivered 148 tornadoes that tore up more than 2,500 miles of 13 Midwestern, Southern, and Eastern states and included 30 tornadoes rated violent 4s and 5s at the top end of the original Fujita tornado intensity scale.
Bloggers are beginning to offer comparisons between April 27 and that historic day, nearly four decades ago, especially because the Super Outbreak’s toll of 330 killed is comparable. The event two weeks ago is considered a “textbook” tornado outbreak: “I mean, literally what I learned from a textbook more than 30 years ago,” writes Senior Forecaster Stu Ostro of The Weather Channel (TWC) on his blog. “Not only were the (atmospheric) elements perfect for a tornado outbreak, they were present to an extreme degree,” he notes. It was of the caliber defined by the Palm Sunday outbreak of 1965, the blitzkrieg of twisters across the Ohio Valley on May 29-30, 2004, as well as the Super Outbreak, which Greg Forbes, TWC Severe Weather Expert, says has since become the benchmark for all tornado outbreaks. Indeed, just last year Storm Prediction Center (SPC) tornado and severe weather forecaster Steve Corfidi, et al., published the article “Revisiting the 3–4 April 1974 Super Outbreak of Tornadoes,” in which they state: “The Super Outbreak of tornadoes over the central and eastern United States on 3–4 April 1974 remains the most outstanding severe convective weather episode on record in the continental United States.” What happened on April 27, 2011, however, may have rewritten the tornado textbook, and reset that benchmark, states Jon Davies, a meteorologist and noted Great Plains storm chaser who has been studying severe weather forecasting for 25 years. He wrote in a blog post last week that the setup for tornadoes on April 27, 2011 was “rare and quite extraordinary.” The combination of low-level wind shear and atmospheric instability was “optimum,” creating a “tragic and historic tornado outbreak [that] was unprecedented in the past 75 years of U.S. history, topping even the 1974 ‘Super Outbreak.’”
That comparison is the ongoing debate as the severity of the tornadoes defining the outbreak of April 27 comes into better focus. So far, 14 of its tornadoes have been rated 4 or greater on the Enhanced Fujita (EF) Scale. With more than twice that many in the Super Outbreak, which were rated using the earlier Fujita tornado intensity scale (compare the two scales), it would seem this new event falls short. But Forbes cautions that likening the April 27 tornado outbreak to the Super Outbreak simply using number of violent tornadoes has its pitfalls.
“I was part of the team that developed the EF Scale, and it’s a system that more accurately estimates tornado wind speeds. But it troubled me then (and still does) that it might be hard to compare past tornado outbreaks with future ones and determine which was worst. It’s apples and oranges, to some extent, in the rating systems then and now.”
That’s a statement that could be applied to today’s severe weather forecasting, technological observation, and warnings for severe weather, which have improved significantly in the last 37 years. In his blog post, Recipe for calamity, NCAR meteorologist Bob Henson looks beyond the ingredients that caused the April 27 tornado outbreak and seeks to consider why the human toll of this tragedy was so massive. He mentions that some parts of the South had been hit by severe thunderstorms and damaging winds earlier that day, which knocked out power and may have disrupted communications in areas that tornadoes barreled through later in the afternoon and evening. The speed of the twisters as well as the lack of safe places to hide from such extreme winds also likely fed the outcome. Of note, too, is mention that perhaps the density of the population centers hit by such dangerous winds resulted in a far greater toll than otherwise would have been realized. This insight comes from Roger Edwards, a forecaster and tornado researcher with SPC. Edwards has a long track record of trying to better educate a populace about the realities of severe storms and tornadoes. He blogged about the catastrophe on April 27, 2011, offering this matter-of-fact consideration: “When you have violent, huge tornadoes moving through urban areas, they will cause casualties.” Edwards then follows this statement, in a subsequent post on the April 27 tornado outbreak, with a poignant look at where we seem to be in the inevitable collision of an expanding population with bouts of severe weather:
“I can say fairly safely that a major contributor here clearly was population density. Even though 3 April 1974 affected a few decent sized towns (Xenia, Brandenburg) and the suburbs of one big metro (Sayler Park, for Cincinnati), a greater coverage area of heavy developed land seemed to be in the way of this day’s tornadoes. How much? I’d like to see a land-use comparison. Harold Brooks and Chuck Doswell [current and retired tornado scientists with the National Severe Storms Laboratory, respectively] have discussed the phenomenon of sprawl as a factor in future tornado death risk and the possible nadir of fatalities having been reached…and the future seems to have arrived.”
Viewing this spring’s deadly onslaught of severe weather through that lens makes it all too clear we’ve been here before: recall a late-August Monday on the central Gulf Coast nearly six years ago shattered by an almost unimaginable, hurricane-whipped surge of seawater that drowned coastal communities in southeast Louisiana, Mississippi, and Alabama. Ostro prefers to use the perspective that event gave us when sizing up the April 27 tornado event:
“So that makes this the Katrina of tornado outbreaks, in the sense that it’s a vivid and tragic reminder that although high death tolls from tornadoes and hurricanes are much less common than they were in the 19th and first part of the 20th centuries, we are not immune to them, even in this era of modern meteorological and communication technology.”
A focus on the human toll of the April tornado tragedy might be the facet that really sets this outbreak apart. One of the most remarkable reports came from Jeff Masters’ blog entry of May 5, 2011—eight days after the outbreak. Noting the extreme number of deaths from the tornadoes and how the toll had fluctuated because some victims were counted twice, he wrote: “There are still hundreds of people missing from the tornado, and search teams have not yet made it to all of the towns ravaged by the tornadoes.” Hundreds missing. Even if that number is off by a factor or 10, this outbreak will be historic for its toll in human lives. Almost two weeks since the outbreak, Alabama’s Emergency Management Agency continues to post daily situation reports in which it states that the number of casualties in the state is “to be published at a later time.” The reasons are spelled out vividly in this blog post from The Huntsville Times, which details accounts from survivors of perhaps the day’s most violent tornado, an EF5 with winds estimated at 210 mph that destroyed much of Hackleburg, a town of 1,600 people in northwest Alabama. At least 18 people lost their lives there. Twenty-one-year-old resident Tommy Quinn said only one person died on his street, the Times reports. But six days after the tornado obliterated the area, a neighbor still hadn’t been found. “We can’t even find her house,” Quinn said.
As is evident in this blend of writings and perceptions, the devastatingly deadly tornado outbreak of April 27, 2011, was an epic event, rivaling even the most revered such disaster in the modern era. What these experts and others are finding, though, is that while the April 27 outbreak was indeed exceptional in many ways, and history will likely reveal it to be a meteorological event unprecedented in some aspects, it seems the Super Outbreak of 1974 won’t be stripped of its meteorological prominence, at least not fully. Instead, the tornado outbreak that occurred on April 27, which was truly remarkable, will be referred to in its own way, likely earning a signature nom de guerre through its shockingly violent legacy.
Clearing Up Aviation Ice Forecasting
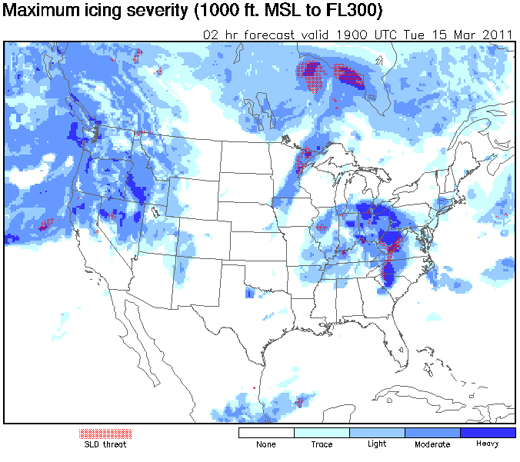
NCAR has developed a new forecasting system for aircraft icing that delivers 12-hour forecasts updated hourly for air space over the continental United States. The Forecast Icing Product with Severity, or FIP-Severity, measures cloud-top temperatures, atmospheric humidity in vertical columns, and other conditions and then utilizes a fuzzy logic algorithm to identify cloud types and the potential for precipitation in the air, ultimately providing a forecast of both the probability and the severity of icing. The system is an update of a previous NCAR forecast product that only was capable of estimating uncalibrated icing “potential.”
The new icing forecasts should be especially valuable for commuter planes and smaller aircraft, which are more susceptible to icing accidents because they fly at lower altitudes than commercial jets and are often not equipped with de-icing instruments. The new FIP-Severity icing forecasts are available on the NWS Aviation Weather Center’s Aviation Digital Data Service website.
According to NCAR, aviation icing incidents cost the industry approximately $20 million per year, and in recent Congressional testimony, the chairman of the National Transportation Safety Board (NTSB) noted that between 1998 and 2007 there were more than 200 deaths resulting from accidents involving ice on airplanes.
