“I think he read on the wrong side of the [thermometer] scale, and so was off by five degrees of Celsius. If you adjust for that, there was no 136-degree Fahrenheit temperature at El Azizia, Libya, in September 1922. Based on some really involved detective work, [a committee of experts] decided that this reading simply is not valid. It’s not the world’s hottest temperature.”
–Randall Cerveny, Arizona State University, one of the co-authors of the BAMS article published on-line today, speaking in this video available on Vimeo.
The Long Hot Road to El Azizia
by Christopher C. Burt
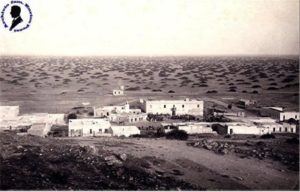
Editor’s note: The article by El Fadi et al. published on-line today by the Bulletin of the American Meteorological Society is literally a record-setting contribution to climatology. Co-author Chris Burt tells the story behind the story.
As any weather aficionado can avow, Earth’s most iconic weather record has long been the legendary all-time hottest temperature of 58°C (136.4°F) measured at El Azizia (many variant spellings), Libya on September 13, 1922. It is a figure that has been for meteorologists as Mt. Everest is for geographers. For the past 90 years, no place on Earth has come close to beating this reading from El Azizia, and for good reason–the record is simply not believable.
In early March 2010 I was included in an e-mail loop concerning questions about this record. The e-mail discussion participants at that time included Maximiliano Herrera, an Italian temperature researcher based in Bangkok; Piotr Djakow a Polish weather researcher; and Khalid Ibrahim El Fadli, director of the climate department at the Libyan National Meteorological Center (LNMC) in Tripoli.
Previous to this discussion I had generally considered the Libyan world record as acceptable although suspicious. The figure had been around for 90 years and two previous studies by Amilcare Fantoli (who was the man responsible for verifying the record in 1922) had more or less substantiated the extreme 58°C figure.
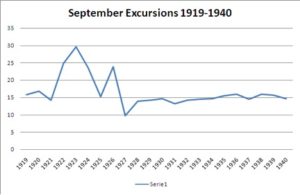
However, Piotr produced a chart of the monthly temperature amplitudes at Azizia for each September from 1921-1940 and this chart raised an alarm so far as the validity of the Aziza record was concerned. This was the first time that I began to really think something was not right about the record.
In September 2010 Internet weather provider Weather Underground, Inc., hired me as their ‘Weather Historian’ proposing that I write a weekly blog on extreme weather events and records.
I decided that one of my first blogs should be about the Azizia record. I was intrigued that El Fadli was skeptical of the Azizia 58°C figure and requested more data. El Fadli’s enthusiastic and gracious response (to provide all and any weather data I might be interested in) was beyond my expectations. Past experience had shown me that many national weather bureaus consider their data proprietary and/or subject to excessive fees for access.
With El Fadli’s data on hand and after researching all other references known (to me at the time) concerning the Azizia event, I posted a blog on wunderground.com reflecting my findings on October 3, 2010. I forwarded a copy of this to Dr. Randy Cerveny, a professor at Arizona State University (ASU) and co-Rapporteur of climate and weather extremes for the World Meteorological Organization (WMO).
At this point, Randy picked up the ball and created an ad-hoc evaluation committee for the World Meteorological Organization to evaluate the record for the WMO Archive of Weather and Climate Extremes (http://wmo.asu.edu/). After this positive response from Randy I asked El Fadli if Libya officially accepted the Azizia figure. He responded that they did not. Since records like this are, to a degree, the provenance of national interest and El Fadli responded that Libya did not officially accept the colonial-era data from Azizia (measured by Italian authorities at that time in Tripolitania) this became the catalyst to launch an official WMO investigation.
This would be an unprecedented investigation for this WMO extreme records evaluation committee. Rehashing old records is not the WMO Archive’s primary objective, which is to verify new potential records. As Dr. Tom Peterson of the US National Climate Data Center, President of the WMO’s Commission on Climatology of which the Archive is a part, put it, “To be honest, I was reluctant to reopen this question because other people had looked at the record in the past and it had been so widely accepted. I was particularly afraid that it would be an uncertain subjective opinion as to whether it was a bit off or not.”
Nevertheless, the investigation was approved and on February 8, 2011, Randy assembled a blue-ribbon international team of climate experts (eventually 13 atmospheric scientists in all). The official investigation began.
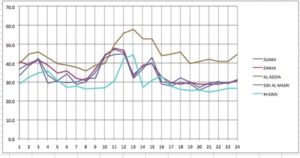
Amazingly, El Fadli had just uncovered a key document: the actual log sheet of the observations made at Azizia in September1922 (see illustration further below). The log sheet clearly illustrated that a change of observers had occurred (as was evidenced by the hand written script) on September 11, 1922, just two days prior to the ostensible record temperature of 58° on September 13th. Furthermore, the new observer had interchanged the Tmin columns with the Tmax columns. Also, beginning on September 11th the Azizia maximum daily temperature records began to exceed those at the four other stations reporting from northwest Libya (Tripolitania) by, on average, 7°C . That trend continued for the rest of the month (with a couple of days of missing data) and into October 1922.
Just as this key discovery (the finding of the original log sheet) was made, the Libyan revolution broke out. On February 15, 2011 we received the last message from El Fadli prior to the revolution. Col. Gaddafi, the leader of Libya, had shut down Libyan international communications.
Of course, without El Fadli’s
critical input we could move no further with the investigation and Randy called for a hiatus to further deliberations.
In early March Gaddafi began airing long nightly rambling tirades on his government TV network. During one of these he made an ominous reference to how NATO forces were using Libyan climate data to plan their assault on the country. My heart sank when I heard this. I immediately thought that our colleague, El Fadli, as director of the LNMC, must have been implicated by Gaddafi as providing weather information to the ‘enemy’.
I must say, at that point, I—and the rest of the committee—thought El Fadli was a dead man.
We didn’t hear again from El Fadli until August 2011 when the revolutionary forces closed in on Tripoli. One of our committee members, WMO chair of the Open Programme Area Group on Monitoring and Analysis of Climate Variability and Change, Dr. Manola Brunet, who knew El Fadli personally had up until then been unable to contact him by phone or email. Then on August 13, 2011 we received our first email from El Fadli.
El Fadli here relates the situation he faced during those long months when we lost communication with him:
During that critical time all communication systems in Libya were shut down by the regime so it was impossible to communicate with anyone, even inside the country. Mobile telephone communications were restricted and even local calls were controlled and monitored. What was amazing however, believe it or not, was that my office satellite internet connection was still up and running. But using such posed serious dangers, if anyone discovered me I would probably lose my life. Hence, I never used that connection. The first 3 months (February-May) I was able to reach my office (my home being about 5 km east of El Azizia and 40 km to my office in Tripoli) but then in May we suffered from short fuel supplies, electricity, and even cooking gas. You can imagine how difficult our lives became! The other serious story involved the security situation. When I borrowed a car belonging to the local United Nations office (since I had no fuel for my own car) I was driving to morning prayers (04:00 am) with my sons and suddenly we came under gunfire from the back and rear of the vehicle. The vehicle was struck as I drove at a crazy speed with our heads ducked low. Our life was spared by the grace of God. This happened in late July.

Then, as we all watched through the technology of television and internet, by September 2011, the dictator Gaddafi was gone … and El Fadli was back!
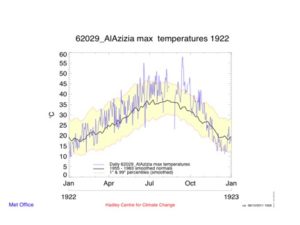
With the investigation back on track, committee members made further progress in October and November. Dr. David Parker of the U.K. Met Office did a reanalysis of surface conditions across the Libyan region for September 1922. The results displayed a significant departure (up to 6 sigmas) from what the temperature observed at Azizia was to what the reanalysis plotted for the area. This was a key discovery, using technology that had never been available in past investigations of the Libyan record.
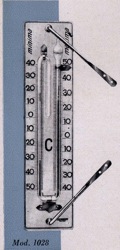
Also, Philip Eden of the Royal Meteorological Society and others uncovered information concerning the unreliability of the Bellani-Six type of thermometer that had apparently been used at Azizia in September 1922. Of particular interest was how the slide within the thermometer casing was of a length equivalent to 7°C. It would be easy for an inexperienced observer to mistakenly read the top of the slide for the daily maximum temperature rather than correctly reading the bottom of such slide, a point that El Fadli made in a message to me early on in the investigation”.
With all the pieces of the puzzle now falling into place a vote was taken in January 2012 resulting in a unanimous decision by the WMO committee members to disallow the Azizia record.
As Tom Peterson put it, “The eventual answer seemed so clear and obvious that we evidently must have done a far more in depth investigation than any earlier one.”
Based on that recommendation, Randy and Jose Luis Stella of Argentina, the WMO’s co-Rapporteurs of climate and weather extremes, have rejected the 58ºC temperature extreme measured at El Azizia in 1922. An important aspect of this long investigation was that it just isn’t climatologists and meteorologists changing their minds. It goes beyond that. This investigation demonstrates that, because of continued improvements in meteorology and climatology, researchers can now reanalyze past weather records in much more detail and with greater precision than ever before. The end result is an even better set of data for analysis of important global and regional questions involving climate change. Additionally, it shows the effectiveness of truly global cooperation and analysis. Consequently, the WMO assessment is that the official highest recorded surface temperature of 56.7°C (134°F) was measured on 10 July 1913 at Greenland Ranch (Death Valley) CA USA.
Broadcasters Bring it to Boston
Last week more than two hundred broadcasters made their way to the 40th Conference on Broadcast Meteorology in Boston. This was an impressive number of attendees given the unusual timing for a broadcast conference. With the approach of the peak of hurricane season, not to mention Hurricane Isaac, it’s typically not an ideal time for broadcasters to be away from their home bases. Yet, the chairs of the conference felt the significance of the 40th anniversary required a city of equal weight and were determined to make Boston work.
Here co-chair Rob Eicher, meteorologist at WOFL in Orlando, explains:
As one of America’s oldest cities, Boston is rich in meteorological history that goes back to 1774 when John Jeffries began taking daily weather observations. Co-chair Maureen McCann, meteorologist at KMGH in Denver, talks about this as well as other touchstones that make the city a meteorological hub:
Broadcasters attended two and half days of presentations covering topics such as regional weather, new technology, and science and communication. KWCH Wichita Meteorologist Ross Janssen, who had his first experience working as a meeting chair, talks about the hard work as well as the benefits of bringing the broadcast community together at an event like this:
A short course “From Climate to Space: Hot Topics for the Station Scientist,” covered both climate change and astronomy, and concluded with a nighttime viewing session at the Clay Center’s observatory in Brookline. Another highlight was a panel discussion on the emergent use of social media in the broadcast community. Afterward attendees made their way to Fenway Park for a night of baseball. If only the Red Sox hadn’t squandered their early lead to the Angels it would have been the perfect way to wrap up the Boston event.
AMS Releases Revised Climate Change Statement
The American Meteorological Society today released an updated Statement on Climate Change (also available here in pdf form), replacing the 2007 version that was in effect. The informational statement is intended to provide a trustworthy, objective, and scientifically up-to-date explanation of scientific issues of concern to the public. The statement provides a brief overview of how and why global climate has changed in recent decades and will continue to change in the future. It is based on the peer-reviewed scientific literature and is consistent with the majority of current scientific understanding as expressed in assessments and reports from the Intergovernmental Panel on Climate Change, the U.S. National Academy of Sciences, and the U.S. Global Change Research Program.
“This statement is the result of hundreds of hours of work by many AMS members over the past year,” comments AMS Executive Director Keith Seitter. “It was a careful and thorough process with many stages of review, and one that included the opportunity for input from any AMS member before the draft was finalized.”
The AMS releases statements on a variety of scientific issues in the atmospheric and related sciences as a service to the public, policy makers, and the scientific community.
A Threat to Antarctic Research
Scientific research in Antarctica is approaching a tipping point of its own, with logistical costs overwhelming the budget, according to a new report written by an independent panel commissioned by the White House. The report recommends fundamental changes to the infrastructure of U.S. scientific facilities in Antarctica; otherwise, according to the report, logistics costs will increase “until they altogether squeeze out funding for science.”
The U.S. Antarctic Program (USAP), which is managed by the National Science Foundation (NSF), supports three year-round stations (McMurdo, Palmer, and Amundsen-Scott South Pole), as well as more than 50 field sites a year that are active during the summer months. The report found numerous infrastructure problems at USAP facilities, including:
a warehouse where some areas are avoided because the forklifts fall through the floor; kitchens with no grease traps; outdoor storage of supplies that can only be found by digging through deep piles of snow; gaps so large under doors that the wind blows snow into the buildings; late 1950s International Geophysical Year-era vehicles; antiquated communications; an almost total absence of modern inventory management systems (including the use of bar codes in many cases); indoor storage inefficiently dispersed in more than 20 buildings at McMurdo Station; some 350,000 pounds (159,000 kilograms) of scrap lumber awaiting return to the U.S. for disposal…
In addition, transportation both to and from Antarctica and on the continent has become increasingly problematic. Despite the recent addition of overland traverse vehicles, delivery of supplies to USAP camps remains costly and inefficient. Meanwhile, the U.S. icebreaker fleet currently consists of just one functioning vessel (and that one doesn’t have the capability to break through thick ice). As a result, the United States has been forced to lease icebreakers from other nations–an expensive and unreliable solution.
“We are convinced that if we don’t do something fairly soon, the science will just disappear,” notes Norm Augustine, former chairman and CEO of Lockheed Martin, who led the review panel. “Everything will be hauling people down and back, and doing nothing.”
Almost 90% of the USAP budget is currently spent on transportation, support personnel, and other logistical matters, leaving few resources for actual scientific research. To rectify that situation, the report recommends decreasing the NSF’s budget for Antarctic research by 6% a year for four years and increasing spending on improving the USAP’s infrastructure and logistics by the same amount over the same period. The short-term result will be a hit to the research currently being conducted in Antarctica, but over the long term the proposal should allow such research to continue to take place there. The report also notes additional savings could be achieved by delivering more supplies to the landlocked Amundsen-Scott base at the South Pole by overland traverse instead of cargo flights, and by reducing support personnel at the three USAP bases by 20%. The report also endorses President Obama’s 2013 budget request for the U.S. Coast Guard to begin designing a new icebreaker.
Ultimately, the review panel’s suggestions are about more than just specific numbers and initiatives. They are about a basic change in the way scientific research is conducted in Antarctica. As the report states:
Overcoming these barriers requires a fundamental shift in the manner in which capital projects and major maintenance are planned, budgeted, and funded. Simply working harder doing the same things that have been done in the past will not produce efficiencies of the magnitude needed in the future; not only must change be introduced into how things are done, but what is being done must also be reexamined.
The full report can be found here.
2012 Rossby Medal Goes to Turbulence Researcher
John Wyngaard, professor emeritus of meteorology at Penn State, is the 2012 recipient of The Carl-Gustaf Rossby Research Medal. He earned this distinction—meteorology’s highest honor—for outstanding contributions to measuring, simulating, and understanding atmospheric turbulence.
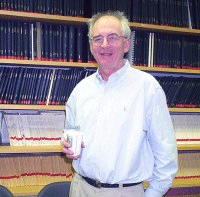
Wyngaard received the medallion at the AMS Annual Meeting in New Orleans.
The Front Page corresponded with him via email to learn more about his research interests, his academic career, and the experiences that brought him to this pinnacle of a life-long career in meteorology. The following is our Q and A session:
Tell us a little about your research accomplishments and how they relate to ongoing challenges with atmospheric turbulence.
Since the advent of numerical modeling in meteorology a principal challenge has been representing the effects of turbulence in the models. My colleagues and I have often presented and interpreted our turbulence studies in that context. I have also worked in what I call “measurement physics,” the analytical study of the design and performance of turbulence sensors. It has been somewhat of an under-appreciated and neglected area.
What events or experiences sparked your interest in meteorology? How about atmospheric turbulence?
My interest in meteorology developed relatively late, when I was well into in my 20s and enrolled in a PhD program in mechanical engineering. I think that is not unusual; as I look around our meteorology department here at Penn State I see that a good fraction of the faculty do not have an undergraduate degree in meteorology. Thus I’ll relate my story in some detail because it touches on an important point that might not be well known—the great career opportunities that exist in meteorological research for people whose backgrounds are not particularly strong in meteorology.
As I grew up Madison, Wisconsin, an idyllic town in the 1950s, I came to know that I would study engineering at the University of Wisconsin. I loved my years at UW—I worked half-time in the student bookstore, pursued my car-building hobby, had a few girlfriends, and probably drank too much beer—but I made sure to do well in my classes. When I received my BS in mechanical engineering in 1961 I did not even consider getting a job; I loved my student life too much, so I entered the MS program in mechanical engineering.
This was during John Kennedy’s presidency, when the funding for National Science Foundation (NSF) graduate fellowships was increased because of the perceived threat from the Soviet Union. In early 1962 I spent a cold winter Saturday in Science Hall taking the NSF graduate fellowship exam. I was awarded a three-year NSF fellowship. My father was incredulous: “They’ll pay you to go to school?”
I was then finishing my MS under a professor who was about to leave UW for a position at Penn State. In June of 1962 I followed him there. That fall I enrolled in a course in turbulence taught by John Lumley, a young professor of Aerospace Engineering. Turbulence was then seen as a murky and difficult field; it was not yet possible to calculate it through numerical simulation. But I was intrigued and asked Lumley if he would be my graduate adviser. He agreed, and my academic course changed.
Under Lumley’s guidance I did experimental work—measurements in a laboratory turbulent flow—which suited me well, but I also developed some confidence with the theoretical side. My introduction to atmospheric turbulence was Lumley’s course that gave rise to his 1964 monograph, “The Structure of Atmospheric Turbulence” with Penn State Meteorology professor Hans Panofsky.
Lumley was on sabbatical in France when I finished my PhD, so I asked Panofsky, whom I knew only by reputation—I took no classes of his—for job leads. Panofsky graciously gave me four names. I made four interview trips and soon had four job offers, which was not unusual then.
The most enticing offer was from Duane Haugen’s group at the Air Force Cambridge Research Laboratories in Bedford, Massachusetts. They were setting out to do the most complete micrometeorological experiment up to that time, in the surface layer over a Kansas wheat field. I had studied the surface layer and I saw this as a great opportunity. I took the job (which I later learned had been open, without applicants, for several years) and participated in the 1968 Kansas experiment. It was an overwhelming success; the resulting analyses and technical papers represented a significant advance in micrometeorology. I was hooked.
In 1975 our group was put at risk by a scheduled downsizing of the lab, and I joined the NOAA Wave Propagation Lab in Boulder; in 1979 I moved across the street to Doug Lilly’s group at NCAR. Much of my NCAR research was collaborative with Chin-Hoh Moeng and focused on the then-new field of large-eddy simulation—numerical calculations of turbulent flows such as the atmospheric boundary layer.
In short, the key experience that sparked my interest in meteorology was my involvement in the 1968 Kansas experiment and the subsequent data analyses and journal publications.
What then brought you to, or drove you to pursue, the current facet of your career?
After many years of research I joined the Department of Meteorology at Penn State in 1991, when the opportunity for teaching was attractive to me. I developed and taught an atmospheric turbulence course, did research with students and post-docs, and did my best to express my long experience with turbulence and micrometeorology in the textbook, “Turbulence in the Atmosphere” (Cambridge, 2010). I retired in 2010.
You stated, “Turbulence was then seen as a murky and difficult field;” was it the challenge of working to understand the so-far undefined field of turbulence that you found so intriguing?
Richard Feynman, the famous American physicist, called turbulence “the last great unsolved problem of classical physics.” That underlies my comment “a murky and difficult field.”
Also, you mentioned that you did experimental work under Professor Lumley on laboratory turbulent flow, and stated that this “suited me well.” How so, or why—was this the connection back to your mechanical engineering experience you had been seeking (knowingly or unknowingly)?
Before we had computers the main approach to turbulence was observations— i.e., measurements.
My mechanical skills allowed me to build and use turbulence sensors to make the measurements I needed. I was good at that—in part, I think, because I had all that car-building experience, which I now realize does translate to doing turbulence measurements. (One doesn’t often think about these kinds of things, but when I was a child—4 or 5—I began building “shacks” [little clubhouses] in our back yard, using crates from grocery and furniture stores. My mother fostered that, God bless her.)
With an interest in NEW observational approaches to remotely sense turbulence, what has you most excited?
There is a long history of theoretical studies of the effects of turbulence on the propagation of electromagnetic and acoustic waves, and this underlies the field of remote sensing. Detecting turbulence remotely is relatively straightforward; obtaining reliable quantitative measurements of turbulence structure in this way is much more difficult. It remains an important challenge.
What would you say to colleagues as well as to recent graduates in the atmospheric and related sciences asking about the importance of such achievement?
It demonstrates a life lesson: If you find a job that you can immerse yourself in, you’ll draw on energy and skills that you might not know you have and you’ll succeed beyond your dreams.
In Case You Didn't Notice, July Was REALLY Hot
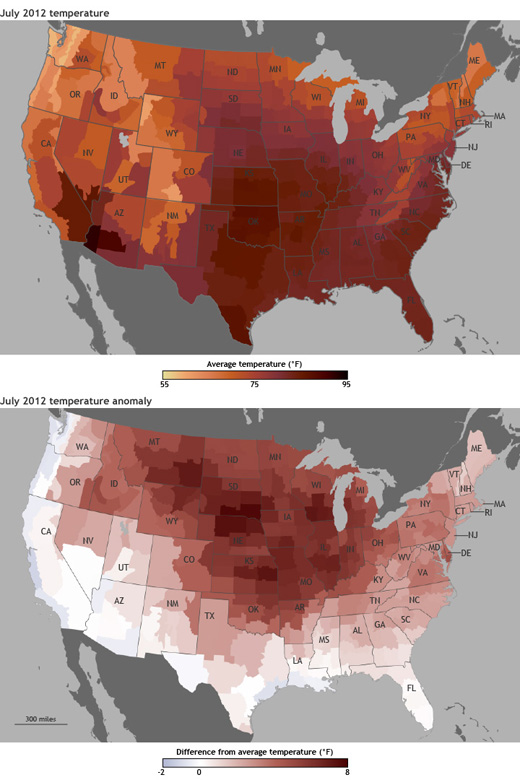
This past July was the hottest month on record in U.S. history, according to NOAA’s National Climatic Data Center. The average temperature throughout the contiguous 48 states was 77.6°F, surpassing the previous mark of 77.4°F set in 1936. The first seven months of 2012 were also the hottest on record in the United States, as was the 12-month period of August 2011-July 2012. (Records go back to 1895.)
Interestingly, only one state–Virginia–experienced its hottest July on record, which goes to show how widespread the heat wave was across the country. Thirty-two states had one of their top-10 hottest Julys of all time this year, with seven states recording their second-hottest ever. July temperatures were 3.3°F warmer than the U.S. twentieth-century average for the month, with particularly intense heat in the Plains, the Midwest, and along the Eastern Seaboard.
The five hottest individual months in U.S. history have all been Julys: 2012, 1936, 2006, 2011, and 1934.
In addition to the historic heat, the U.S. Climate Extremes Index, which NOAA uses to calculate temperature anomalies, severe drought, downpours, tropical storms, and hurricanes, was a record-high 37% in July; the previous maximum occurred last July. And the index for the first seven months of the year was 46%, breaking a 78-year-old record. The average index is 20%.
.”]
NOAA's "Weather Central" Settles into Its New Home

and kick off a move-in process that will continue through September as operations shift from the 40-year-old World Weather Building in Camp Springs, Maryland, NCEP Director (and current AMS President) Louis Uccellini decided to make a gesture to his predecessors who brought NOAA’s forecasting hub to this juncture. Here’s the commemorative email he sent, which was shared throughout NCEP:
Subject: Last email from the desk of the Director of NCEP at the World Weather BuildingDate: Wed, 01 Aug 2012 14:33:35 -0400From: Dr. Louis UccelliniTo: Ron McPherson, Bill Bonner, Jim Howcroft, Norm Phillip
Ron/Bill/Jim/Norm: Tradition has it that when the NCEP Director leaves his position and shuts the lights out for the last time in Room 100 at the World Weather Building (WWB), he/she leaves a hand written letter taped inside the top drawer of their desk for the next Director. But we have a unique situation as today marks the last day the Director of NCEP resides at the WWB as I will be moving to the new NOAA Center for Weather and Climate Prediction (NCWCP) tomorrow.
So I have decided to write this email to you, the former NCEP Directors (Bill Bonner, Ron McPherson), the Deputy Director (Jim Howcroft) and Norm Phillips, as the last correspondence, the very last email sent from this office.I have been reflecting on the history made in the WWB from 1974 to the present and understand that much of this would not have happened without you, the previous Directors (George Cressman and Fred Shuman), and the great people that you assembled to develop and implement real-time models that would ultimately access the global observing system and provide numerical predictions that would become the basis, the rock solid foundation, for how weather and climate forecasts are made.
David Laskin wrote about the WWB and NMC/NCEP in his 1996 book, “Braving the Elements: The Stormy History of American Weather” and stated:”… a nondescript building in the town of Camp Springs, Maryland, just a stones throw off the Capital Beltway. From the outside the place looks like one of those suburban “professional complexes” where dentists and insurance salespeople set up shop. The one clue that something special happens here is an inconspicuous sign over the entrance: World Weather Building. No marble columns. No uniformed guards. No eagle clutching lightning bolts, No model of the globe. And yet, despite the absence of visible symbols, this building is as critical to our nation’s weather as the Pentagon is to our defense. For this is the headquarters of the National Meteorological Center- the innermost nerve bundle of the central nervous system of the National Weather Service…..The National Meteorologic Center is where national weather comes into focus. All the maps you see in newspapers….all those long range outlooks they flash up on the Weather Channel: they all originate here. This is where the global networks converge; this is where the megacomputers are run; this is where the nation’s weather happens: the NMC is Weather Central.”
Quite a tribute to you during your time here and a recognition of the historic importance of the WWB. Yes, history was made at the WWB! Today we run a wide spectrum of climate and weather models: 1) from short-range climate to mesoscale severe weather events, 2) from space weather forecasts to Ocean and an increasing number of Bay Models (led by NOS), 3) from individual event driven hurricane, fire weather and dispersion models (led by OAR) to an increasing number of multi model ensemble systems; all involving a coupling of many components of the Earth System and fed by over 35 satellite systems (helped along by the Joint Center for Satellite Data Assimilation) and many synoptic and asynoptic insitu data systems. We now have all the Service Centers working off the same NAWIPS workstation environment and producing products collaboratively and interactively with other Centers and Weather Forecast offices around the country with a focus on extreme events that includes severe weather, fire weather, hurricanes, and winter storms. And the people in the WWB and throughout the rest of NCEP all played their critical roles to make this happen…..
This week starts the move of the operational and administrative units to the NOAA Center for Weather and Climate Prediction. NCO has been in the NCWCP since February and has done a masterful job in wiring the place up to meet our mission needs and is presently coordinating the move. So far it is all going as smoothly as we expected and our goal remains to move all the operational units without missing one product (Another mission impossible). I want to thank all of you … for helping make this building project a reality and sticking with us as we navigated our way through and around the unexpected challenges we had to confront to bring it to a successful conclusion. I especially want to recognize David Caldwell who was with me at the very first briefing on this project, worked every step through the planning and construction start up, and is still involved as we go through the check list.
So we are ready to move. I can tell you that the smiles on the faces of the employees leaving here and moving over to the NCWCP this week says it all. They are ready! And I also have to note that the people I met on a recent visit to the ECMWF (who looked at the pictures of the NCWCP) stated they were jealous as they looked around their older building. Nevertheless, we still have some work to do to catch up, which we will, as we settle into this modern stunning facility that we all can be proud of. Thanks to you all for your support during this 13 year saga. Some pictures are attached. From this point forward, you can find me at the NCWCP, Suite 4600.
Louis
The Rainbow Goes Green
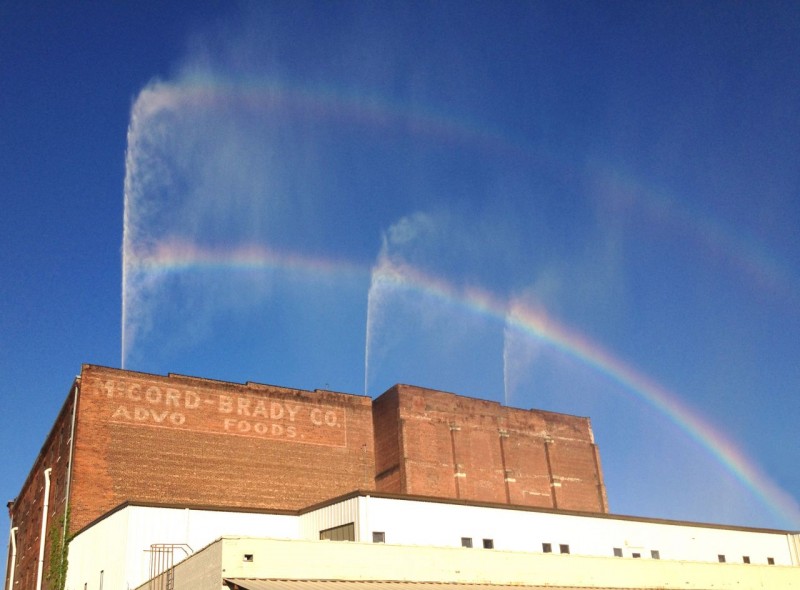
Downtown Omaha, Nebraska, may not be a place you’d expect to see many rainbows, since the state is under an official drought emergency this summer. But art has a way of trumping nature at the Bemis Center for Contemporary Arts. The Rainbow: Certain Principles of Light and Shapes between Forms, an exhibit created by artist Michael Jones McKean, gives residents a glimpse of welcome sights from wetter times. McKean worked with irrigation and rainwater harvesting experts and atmospheric scientists to create the display, in which a dense wall of water shoots up to 100 feet into the air to create a rainbow above the building.
“There are a number of novel aspects of this project,” explains Joseph A. Zehnder, professor and chair of the Department of Atmospheric Sciences at Creighton University, who also served as a technical advisor on rain and wind climatology and on atmospherics optics for the project. “One is that the display is created using harvested rainwater. Local agricultural irrigation and rainwater harvesting companies contributed time and expertise to the project, with the hope of providing a public demonstration of currently available technologies.”
Prior to the opening, a self-contained water harvesting and storage system was built in the Bemis Center. The collected and recaptured storm water is filtered and stored in six above-ground 10,500-gallon water tanks while within the gallery a 60-horsepower pump supplies pressurized water to nine nozzles mounted to the roof. Based on atmospheric conditions, vantage point, available sunlight and the changing angle of the sun in the sky, each rainbow has a singular character and quality.
Zehnder notes that although the basics of rainbows are well understood, there are some complications that arise with providing them on demand. “There are variations in the hue and intensity of the rainbow that are related to the water drop size and density,” he explains. “The drop sizes need to be sufficiently large in order for the internal reflection and refraction of sunlight to occur. Scattering from smaller drops is the wavelength independent Mie scattering so the color separation doesn’t occur.”
McKean began experimenting with manmade rainbows in 2002 and in 2008 started researching the logistics of creating a rainbow over the Bemis Center. In 2010 he started a partial test of the rainbow in Omaha, with the full test last October. “The rainbow is a reminder of a constant universal—something forever, simultaneously contemporary and ancient,” comments McKean. “In the face of our earthbound landscape of shapes and forms, of geologic, evolutionary, archeological timescales, the rainbow is a kind of perfection, our oldest image.”
Even if artists can make their own rainbows, weather still has its say. Because of the dry summer, the Bemis Center is only showing the exhibit on select occasions, with scheduling twenty-four hours in advance. To find out when the rainbow will be on, check here or the Bemis Facebook page. There is also a free mobile app that can be downloaded to Apple and Android phones, which will notify users when the next rainbow will take place and also includes information about the artist and the project.
Climate and Weather Extremes: Asking the Right Questions
The still-developing field of attribution science examines specific weather events and short-term atmospheric patterns in a broader, longer-term climate context. In such research, communication is key; it’s vital to understand exactly what questions are being asked. A case in point is an article in the July issue of BAMS. “Explaining Extreme Events of 2011 from a Climate Perspective” gives long-term context to some of the significant weather events of 2011 featured in the new State of the Climate, which is also part of the July BAMS.
The authors write:
One important aspect we hope to help promote …is a focus on the questions being asked in attribution studies. Often there is a perception that some scientists have concluded that a particular weather or climate event was due to climate change whereas other scientists disagree. This can, at times, be due to confusion over exactly what is being attributed. For example, whereas Dole et al. (2011) reported that the 2010 Russian heatwave was largely natural in origin, Rahmstorf and Coumou (2011) concluded it was largely anthropogenic. In fact, the different conclusions largely reflect the different questions being asked, the focus on the magnitude of the heatwave by Dole et al. (2011) and on its probability by Rahmstorf and Coumou (2011), as has been demonstrated by Otto et al. (2012). This can be particularly confusing when communicated to the public.
So the new attribution paper in BAMS strives to answer a very specific questions–a series of them, as it turns out, since the paper is actually a collection of a number of studies by different teams, representing several of the cutting-edge approaches to researching attribution in rapid response to the extreme weather. Most of the authors, but not all, seek to answer questions about how global climate change changes odds that extreme events might occur.
Last week, NOAA held a briefing to discuss both the State of the Climate and the new BAMS article. Two coauthors of the article, Tom Peterson of NOAA’s National Climatic Data Center and Peter Stott of the Met Office Hadley Centre, discussed the answers they found. They noted that in some cases, such as the rainfall that caused flooding in Thailand, there was no connection between human activities and the extreme weather. But other events exhibited a clear human influence that increased the possibility of that event occurring. One example is the prolonged heat wave in Mexico and the southwestern United States, which was the region’s hottest and driest growing season on record by a significant margin. The steamy temperatures were connected to the La Niña that was prominent last year, and the study found that such a heat wave is 20 times more likely in La Niña years today than it was in 1960. As the coauthors noted in the briefing, the answer might be completely different in years without a La Niña , pointing out the importance of context–and understanding the questions being asked–in this study.
The State of the Climate itself documents the weather extremes of the recent past and give them context in the historical record. The 282-page peer-reviewed report, compiled by 378 scientists from 48 countries around the world, also provides a detailed update on global climate indicators and other data collected by environmental monitoring stations and instruments on land and ice, at sea, and in the sky. It used 43 climate indicators to track and identify changes and overall trends to the global climate system. These indicators include greenhouse gas concentrations, temperature of the lower and upper atmosphere, cloud cover, sea surface temperature, sea level rise, ocean salinity, sea ice extent, and snow cover. Each indicator includes thousands of measurements from multiple independent datasets.
Among the highlights of this year’s SOC:
- Warm temperature trends continue: Four independent datasets show 2011 among the 15 warmest since records began in the late nineteenth century, with annually-averaged temperatures above the 1981–2010 average, but coolest on record since 2008. The Arctic continued to warm at about twice the rate compared with lower latitudes. On the opposite end of the planet, the South Pole recorded its all-time highest temperature of 9.9°F on December 25, breaking the previous record by more than 2 degrees.
- Greenhouse gases climb: Major greenhouse gas concentrations, including carbon dioxide, methane, and nitrous oxide, continued to rise. Carbon dioxide steadily increased in 2011 and the yearly global average exceeded 390 parts per million (ppm) for the first time since instrumental records began. This represents an increase of 2.10 ppm compared with the previous year. There is no evidence that natural emissions of methane in the Arctic have increased significantly during the last decade.
- Arctic sea ice extent decreases: Arctic sea ice extent was below average for all of 2011 and has been since June 2001, a span of 127 consecutive months through December 2011. Both the maximum ice extent (5.65 million square miles on March 7, 2011) and minimum extent (1.67 million square miles, September 9, 2011) were the second smallest of the satellite era.
- Ozone levels in Arctic drop: In the upper atmosphere, temperatures in the tropical stratosphere were higher than average while temperatures in the polar stratosphere were lower than average during the early 2011 winter months. This led to the lowest ozone concentrations in the lower Arctic stratosphere since records began in 1979 with more than 80 percent of the ozone between 11 and 12 miles altitude destroyed by late March, increasing UV radiation levels at the surface.
- Sea surface temperature and ocean heat content rise: Even with La Niña conditions occurring during most of the year, the 2011 global sea surface temperature was among the 12 highest years on record. Ocean heat content, measured from the surface to 2,300 feet deep, continued to rise since records began in 1993 and was record high.
- Ocean salinity trends continue: Continuing a trend that began in 2004, and similar to 2010, oceans were saltier than average in areas of high evaporation, including the western and central tropical Pacific, and fresher than average in areas of high precipitation, including the eastern tropical South Pacific, suggesting that precipitation is increasing in already rainy areas and evaporation is intensifying in drier locations.
The report also provides details on a number of extreme events experienced all over the globe, including the worst flooding in Thailand in almost 70 years, drought and deadly tornado outbreaks in the United States, devastating flooding in Brazil and the worst summer heat wave in central and southern Europe since 2003.