by Keith Seitter, AMS Executive Director
In carrying out its mission, AMS provides a broad range of support for the science and services making up the atmospheric and related sciences. As a part of this support, AMS has a long history of being a voice on behalf of science and the scientific method—as do most other scientific societies such as AAAS, AGU, Sigma Xi, and many, many others. This past year has been especially challenging for all of us as pressures and outright attacks on science have become far more prevalent. AMS has always been careful to be nonpartisan, to avoid being policy prescriptive, and to really focus on science. We have not, however, shied away from taking strong positions on behalf of the integrity of science.
The hope is that the community and society will view AMS journals, statements, and other material as reliable sources of information on the scientific disciplines AMS covers. AMS statements, in particular, are developed with the goal of being broadly accessible to those seeking credible summaries of current scientific knowledge and understanding on various topics. Beyond being a resource, however, it is vital that AMS proactively stand up for the integrity of science and the scientific process—especially when it is mischaracterized in ways that might impact policy decisions or mislead the public.
There is an extraordinary amount of misinformation being disseminated through many outlets on a variety of topics (but perhaps most notably those associated with climate change)—far more than one can effectively monitor or hope to address. With so many incorrect or misleading statements out there, it can be hard to know when to jump into the discussion. Recognizing that we cannot address all instances of misinformation, AMS has focused instead on taking a more public stance when policy makers in leadership positions make statements that mischaracterize the science. Thus, this past year for example, AMS has sent letters to the EPA administrator and the Secretary of Energy (see the “AMS Position Letters” for an archive of all letters that have been sent by AMS).
Protecting the academic freedom of researchers, and the freedom to present their scientific results broadly and without censorship, intimidation, or political interference, has also been important to AMS for many years. These fundamental precepts upon which scientific advancements depend have come under attack before, and AMS has maintained a strong “Statement on the Freedom of Scientific Expression” for a number of years to make the Society’s position clear.
Scientific advance requires that all data and methodologies leading to research results be openly and freely available to others wishing to replicate or assess that research. That said, AMS has spoken out to protect the confidentiality of discussions among researchers as they develop ideas and critically assess the work of others. These candid discussions are essential and must be able to happen without fear among those involved that comments might be taken out of context to attack the research or the researchers.
AMS membership is diverse and not all members have been supportive of these efforts. I can appreciate the concerns some may feel, and know there is a danger of acting out of bias, despite our putting a lot of time and energy into avoiding biases. I know, as well, how easily inherent biases can color the way one might read these statements or letters. I also know, however, that to remain silent in the face of clear mischaracterization of science or to fail to defend the scientific process is wholly inconsistent with the AMS mission of “advancing the atmospheric and related sciences, technologies, applications, and services for the benefit of society.” I’m proud to be part of an organization that has such a strong history of standing up for the integrity of science.
(Note: This letter also appears in the September 2017 issue of BAMS.)
Building AMS Community, Maximizing Value of Our Information
by Douglas Hilderbrand, Chair, AMS Board on Enterprise Communication
Early August seems forever ago. Hurricanes Maria, Irma, and Harvey were only faint ripples in the atmosphere. The nation was getting increasingly excited for the solar eclipse of 2017; the biggest weather question was where clear skies were expected later in the month.
During this brief period of calm in an otherwise highly impactful weather year, leaders and future leaders from the Weather, Water, and Climate Enterprise gathered together at the AMS Summer Community Meeting in Madison, Wisconsin, to better understand how “The Enterprise” could work in more meaningful, collaborative ways to best serve communities across the country and the world. Consisting of government, industry, and the academic sector, the Enterprise plays a vital role in protecting lives, minimizing impacts from extreme events, and enhancing the American economy.
The AMS Summer Community Meeting is a unique time when the three sectors learn more about each other, about physical and social science advances, and discuss collaboration opportunities. Strengthening relationships across the Enterprise results in collaborations on joint efforts, coordination in ways that improve communication and consistency in message, and discussion of issues on which those in the room may not always see eye-to-eye. Every summer, one theme always rises to the top — the three sectors that make up the Weather, Water, and Climate Enterprise are stronger when working together vs. “everyone for themselves.”
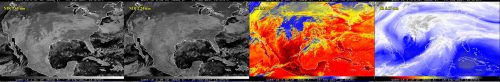
This “true-ism” becomes most evident during extreme events, such as the trifecta of devastating hurricanes to impact communities from Texas to Florida to Puerto Rico and the U.S. Virgin Islands. The AMS Summer Community Meeting (full program and recorded presentations now available) featured experts on weather satellites, radar-based observations, applications that bring together various datasets, communications, and even the science behind decision making. As Hurricanes Harvey, Irma, and Maria formed, strengthened, and tracked toward land, relevant topics discussed at the Summer Community Meeting were applied under the most urgent of circumstances. GOES-16 images, though currently “preliminary and non-operational,” delivered jaw-dropping imagery and critical information to forecasters. As Harvey’s predicted rainfall totals created a dire flooding threat, the entire Enterprise rallied together to set the expectation that the flooding in eastern Texas and southwestern Louisiana would be “catastrophic and life threatening.” This consistency and forceful messaging likely saved countless lives — partially due to the Enterprise coming together a month before Harvey to stress the importance of consistency in messaging during extreme events.
If you are unfamiliar with the AMS Summer Community Meeting, and are interested in participating in the summer of 2018, take some time and click on the recorded presentations over the past few years (2017, 2016, 2015). In 2016, the Enterprise met in Tuscaloosa, Alabama, home of NOAA’s National Water Center, and discussed recent advances in water forecasting and the launch of the National Water Model. A year earlier, in Raleigh, NC, future advances across the entire end-to-end warning paradigm were discussed.
We don’t know when or what the next big challenge will be for the Weather, Water, and Climate Enterprise, but a few things are certain… The state of our science — both physical and social — will be tested. Communities will be counting on us to help keep them safe. And to maximize the value chain across the Weather, Water, and Climate Enterprise, we will need government, industry, and academia continuing to work together and rely on each other. These certainties aren’t going away and provide the impetus for you to consider participating in future AMS Summer Community Meetings.
Peer Review Week 2017: 4. Shifting Demands of Integrity
For Journal of Hydrometeorology Chief Editor Christa Peters-Lidard, peer review upholds essential standards for a journal. “Maintaining that integrity is very important to me,” she said during an interview at the AMS Publications Commission meeting in Boston, in May. Historically, the burden of integrity has fallen on editors as much as authors and reviewers.
The peer review process we follow at the AMS is an anonymous process. Authors do not know who their reviewers are. So it’s really up to us, as the editors and chief editors, to ensure that the authors have a fair opportunity to not only get reviews that are constructive and not attacking them personally, but also by people that are recognized experts in the field.
Even when reviewers are not experts, “they know enough about it to ask the right questions, and that leads the author to write the arguments and discussion in a way that, in the end, can have more impact because more people can understand it.”
Anonymity has its advantages for upholding integrity, especially in relatively small field, like hydrometeorology. Peters-Lidard pointed anonymity helps reviewers state viewpoints honestly and helps authors receive those comments as constructive, rather than personal.
“In my experience there have been almost uniformly constructive reviews,” Peters-Lidard says, and that means papers improve during peer review. “Knowing who the authors are, we know what their focus has been, where their blind spots might be, and how we can lead them to recognize the full scope of the processes that might be involved in whatever they’re studying. Ultimately that context helps the reviewer in making the right types of suggestions.
But the need for integrity is subtly shifting its burden onto authors more and more heavily. Peters-Lidard spoke about the trend in science towards an end-to-end transparency in how conclusions were reached. She sees this movement in climate assessment work, for example, where the policy implications are clear. Other peer reviewed research developing this way.
We’re moving the direction where ultimately you have a repository of code that you deliver with the article….Part of that also relates to a data issue. In the geosciences we speak of ‘provenance,’ where we know not only the source of the data—you know, the satellite or the sensor—but we know which version of the processing was applied, when it was downloaded, and how it was averaged or processed. It’s back to that reproducibility idea a little bit but also there are questions about the statistical methods….We’re moving in this direction but we’re not there yet.
Hear the full interview:
Peer Review Week 2017: 3. Transparency Is Reproducibility
David Kristovich, chief editor of the Journal of Applied Meteorology and Climatology, explains how AMS peer review process, as a somewhat private process, ultimately produces the necessary transparency.
Peer review is an unpublished exchange between authors, editors and reviewers. It is meant to assure quality in a journal. At the same time, Kristovich noted that peer review is not just something readers are trusting, blindly. Rather, the peer review process is meant to lead to a more fundamental transparency—namely, it leads to papers that reveal enough to be reproducible.
“Transparency focuses on the way we tend to approach our science,” Kristovich said during an interview at the AMS Publications Commission meeting in Boston in May. “If someone can repeat all of the steps you took in conducting a study, they should come up with the same answer.”
“The most important part of a paper is to clearly define how you did all the important steps. Why did I choose this method? Why didn’t I do this, instead?”
Transparency also is enhanced by revealing information about potential biases, assumptions, and possible errors. This raises fundamental questions about the limits of information one can include in a paper, to cover every aspect of a research project.
“Studies often take years to complete,” Kristovich pointed out. “Realistically, can you put in every step, everything you were thinking about, every day of the study? The answer is, no you can’t. So a big part of the decision process is, ‘What is relevant to the conclusions I ended up with?’”
The transparency of scientific publishing then depends on peer review to uphold this standard, while recognizing that the process of science itself is inherently opaque to the researchers themselves, while they’re doing their work.
“The difference between scientific research and development of a product, or doing a homework assignment—thinking about my kids—is that you don’t know what the real answer is,” Kristovich said. Science “changes your thinking as you move along, so at each step you’re learning what steps you should be taking.”
You can hear the entire interview here.
Peer Review Week 2017: 2. What Makes a Good Review?
At the AMS Annual Meeting panel on Peer Review last January, journal editors Tony Broccoli, Carolyn Reynolds, Walt Robinson, and Jeff Rosenfeld spoke about how authors and reviewers together make good reviews happen:
Robinson: If you want good reviews, and by good I mean insightful and constructive and that are going to help you make your paper better, the way to do that is to write a really good paper. Make sure your ducks are in a row before you send it in. You should have read over that and edited it multiple times. I’m going to, at some point in my life, write a self-help book in which the single word title is, “Edit!” because it applies to many parts of life. Have your colleagues—not even the co-authors—look at it. Buy the person in the office next door a beer to look over the paper and get their comment. There may be problems with the science–and none of our science is ever perfect–but if it’s a really well constructed, well formulated, well written paper, that will elicit really good reviews.
The flip side of that is, if the paper is indecipherable, you’ll get a review back saying, “I’m trying to figure this out” with a lot of questions, and often it’s major revisions. (We don’t reject that many things out of the box.)
The problem is, the author goes back and finally makes the paper at a standard he or she should have sent in the first time. It goes back to the reviewer, and then the reviewer understands the paper and comes back and starts criticizing the science. Then the author gets angry…”You didn’t bring that up the first time!” Well, that’s because the reviewer couldn’t understand the science the first time. So, if you want good, constructive reviews, write good papers!
Reynolds: You want to make things as easy as possible for the reviewers. Make the English clear, make the figures clear. Allow them to focus on the really important aspects.
Broccoli: I would add, affirming what Walt said, that the best reviews constructively give the authors ideas for making their papers better. Some reviewers are comfortable taking the role as the gatekeeper and trying to say whether this is good enough to pass muster. But then maybe they aren’t as strong as need be at explaining what needs to be done to make the paper good enough. The best reviews are ones that apply high standards but also try to be constructive. They’re the reviewers I want to go back to.
Rosenfeld: I like Walt’s word, “Edit.” Thinking like an editor when you are a reviewer has a lot to do with empathy. In journals, generally, the group of authors is identical or nearly the same as the group of readers, so empathy is relatively easy. It’s less true in BAMS, but it still applies. You have to think like an editor would, “What is the author trying to do here? What is the author trying to say? Why are they not succeeding? What is it that they need to show me?” If you can put yourself in the shoes of the author—or in the case of BAMS, in the shoes of the reader—then you’re going to be able to write an effective review that we can use to initiate a constructive conversation with the author.
Broccoli: That reminds me: Occasionally we see a reviewer trying to coax the author into writing the paper the reviewer would have written, and that’s not the most effective form of review. It’s good to have diverse approaches to science. I would rather the reviewer try to make the author’s approach to the problem communicated better and more sound than trying to say, “This is the way you should have done it.”
Peer Review Week 2017: 1. Looking for Reviewers
It’s natural that AMS–an organization deeply involved in peer review–participates in Peer Review Week 2017. This annual reflection on peer review was kicked off today by the International Congress of Peer Review and Scientific Publication in Chicago. If you want to follow the presentations there, check out the videos and live streams.
Since peer review is near and dear to AMS, we’ll be posting this week about peer review, in particular the official international theme, “Transparency in Review.”
To help bring some transparency to peer review, AMS Publications Department presented a panel discussion on the process in January at the 2017 AMS Annual Meeting in Seattle. Tony Broccoli, longtime chief editor of the Journal of Climate, was the moderator; other editors on the panel were Carolyn Reynolds and Yvette Richardson of Monthly Weather Review, Walt Robinson of the Journal of Atmospheric Sciences, and Jeff Rosenfeld of the Bulletin of the American Meteorological Society.
You can hear the whole thing online, but we’ll cover parts of the discussion here over the course of the week.
For starters, a lot of authors and readers wonder where editors get peer reviewers for AMS journal papers. The panel offered these answers (slightly edited here because, you know, that’s what editors do):
Richardson: We try to evaluate what different types of expertise are needed to evaluate a paper. That’s probably the first thing. For example, if there’s any kind of data assimilation, then I need a data assimilation expert. If the data assimilation is geared toward severe storms, then I probably need a severe storms expert too. First I try to figure that out.
Sometimes the work is really related to something someone else did, and that person might be a good person to ask. Sometimes looking through what papers they are citing can be a good place to look for reviewers.
And then I try to keep reaching out to different people and keep going after others when they turn me down…. Actually, people are generally very good about agreeing to do reviews and we really have to thank them. It would all be impossible without that.
Reynolds: If you suggest reviewers when you submit to us, I’ll certainly consider them. I usually won’t pick just from the reviewers suggested by the authors. I try to go outside that group as well.
Broccoli: I would add, sometimes if there’s a paper on a topic where there are different points of view, or the topic is yet to be resolved, it can be useful to identify as at least one of the reviewers someone who you know may have a different perspective on that topic. That doesn’t mean you’re going to believe the opinion of that reviewer above the opinion of others but it can be a good way of getting a perspective on a topic.
Rosenfeld: Multidisciplinary papers can present problems for finding the right reviewers. For these papers, I do a lot of literature searching and hunt for that key person who happens to somehow intersect, or be in between disciplines or perspectives; or someone who is a generalist in some way, whose opinion I trust. It’s a tricky process and it’s a double whammy for people who do that kind of research because it’s hard to get a good evaluation.
• • •
If you’re interested in becoming a reviewer, the first step is to let AMS know. For more information read the web page here, or submit this form to AMS editors.
Disaster Do-Overs
Ready to do it all over again? Fresh on the heels of a $100+ billion hurricane, we very well may be headed for another soon.
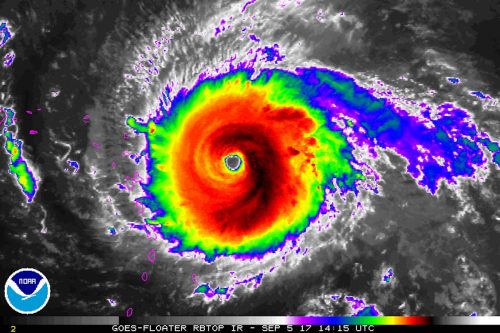
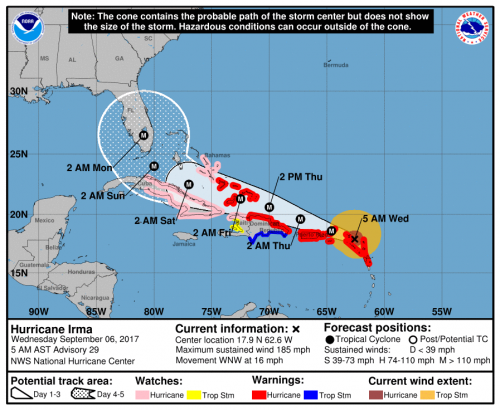
As Houston and the Gulf Coast begin a long recovery from Hurricane Harvey, Hurricane Irma is now rampaging through the Atlantic. With 185 m.p.h. sustained winds on Tuesday, Irma became the strongest hurricane in Atlantic history outside of the Caribbean and Gulf. The hurricane made its first landfall early Wednesday in Barbuda and still threatens the Virgin Islands, Puerto Rico, Cuba, and the United States.
If Irma continues along the general path of 1960’s Hurricane Donna, it could easily tally $50 billion in damage. This estimate, from a study by Karen Clark and Co. (discussed recently on Category 6 Blog), is already four years old (i.e., too low). Increased building costs—which the report notes rise “much faster” than inflation–and continued development could drive recovery costs even higher.
In short, as bad as Houston is suffering, there are do-overs on the horizon—a magnitude of repeated damage costs unthinkable not long ago, before Katrina ($160 million) and Sandy ($70 million).
Repeated megadisasters yield lessons, some of them specific to locale and circumstances. In Miami after Hurricane Andrew, the focus was on building codes as well as the variability of the winds within the storms. After Hurricane Rita, the focus was on improving policies on evacuation. After Hurricane Katrina, while the emergency management community reevaluated its response, the weather community took stock of the whole warnings process. It was frustrating to see that, even with good forecasts, more than a thousand people lost their lives. How could observations and models improve? How could the message be clarified?
Ten years after Katrina, the 2016 AMS Annual Meeting in New Orleans convened a symposium on the lessons of that storm and of the more recent Hurricane Sandy (2012). A number of experts weighed in on progress since 2005. It was clear that challenges remained. Shuyi Chen of the University of Miami, for example, highlighted the need for forecasts of the impacts of weather, not just of the weather itself. She urged the community to base those impacts forecasts on model-produced quantitative uncertainty estimates. She also noted the need for observations to initialize and check models that predict storm surge, which in turn feeds applications for coastal and emergency managers and planners. She noted that such efforts must expand beyond typical meteorological time horizons, incorporating sea level rise and other changes due to climate change.
These life-saving measures are part accomplished and part underway—the sign of a vigorous science enterprise. Weather forecasters continue to hone their craft with so many do-overs. Some mistakes recur. As NOAA social scientist Vankita Brown told the AMS audience about warnings messages at the 2016 Katrina symposium, “Consistency was a problem; not everyone was on the same page.” Katrina presented a classic problem where the intensity of the storm, as measured in the oft-communicated Saffir-Simpson rating, was not the key to catastrophe in New Orleans. Mentioning categories can actually create confusion. And again, in Hurricane Harvey this was part of the problem with conveying the threat of the rainfall, not just the wind or storm surge. Communications expert Gina Eosco noted that talk about Harvey being “downgraded” after landfall drowned out the critical message about floods.
Hurricane Harvey poses lessons that are more fundamental than the warnings process itself and are eerily reminiscent of the Hurricane Katrina experience: There’s the state of coastal wetlands, of infrastructure; of community resilience before emergency help can arrive. Houston, like New Orleans before it, will be considering development practices, concentrations of vulnerable populations, and more. There are no quick fixes.
In short, as AMS Associate Executive Director William Hooke observes, both storms challenge us to meet the same basic requirement:
The lessons of Houston are no different from the lessons of New Orleans. As a nation, we have to give priority to putting Houston and Houstonians, and others, extending from Corpus Christi to Beaumont and Port Arthur, back on their feet. We can’t afford to rebuild just as before. We have to rebuild better.
All of these challenges, simple or complex, stem from an underlying issue that the Weather Channel’s Bryan Norcross emphatically delineated when evaluating the Katrina experience back in 2007 at an AMS Annual Meeting in San Antonio:
This is the bottom line, and I think all of us in this business should think about this: The distance between the National Hurricane Center’s understanding of what’s going to happen in a given community and the general public’s is bigger than ever. What happens every time we have a hurricane—every time–is most people are surprised by what happens. Anybody who’s been through this knows that. People in New Orleans were surprised [by Katrina], people in Miami were surprised by Wilma, people [in Texas] were surprised by Rita, and every one of these storms; but the National Hurricane Center is very rarely surprised. They envision what will happen and indeed something very close to that happens. But when that message gets from their minds to the people’s brains at home, there is a disconnect and that disconnect is increasing. It’s not getting less.
Solve that, and facing the next hurricane, and the next, will get a little easier. The challenge is the same every time, and it is, to a great extent, ours. As Norcross pointed out, “If the public is confused, it’s not their fault.”
Hurricanes Harvey and Katrina caused catastrophic floods for different reasons. Ten years from now we may gather as a weather community and enumerate unique lessons of Harvey’s incredible deluge of rain. But the bottom line will be a common challenge: In Hurricane Harvey, like Katrina, a city’s–indeed, a nation’s–entire way of dealing with the inevitable was exposed. Both New Orleans and Houston were disasters waiting to happen, and neither predicament was a secret.
Meteorologists are constantly getting do-overs, like Irma. Sooner or later, Houston will get one, too.
The Trouble with Harvey: Hurricane Intensification Dilemmas
Hurricanes like rapidly-changing Harvey are still full of surprises for forecasters.
The remnants of Caribbean Tropical Storm Harvey made a startling burst Thursday from a tropical depression with 35 mph winds to an 85 mph hurricane in a little more than 12 hours. It has been moving steadily toward a collision with the middle Texas coast and landfall is later Friday. If intensification continues at the same rate, Harvey is likely to be a major hurricane by then, according to a Thursday afternoon advisory from the National Hurricane Center, with sustained winds of 120-125 mph and even higher gusts.
That’s a big “if.”
The drop in central pressure, which had been precipitous all day—a sign of rapid strengthening—had largely slowed by Thursday afternoon. Harvey’s wind speed jumped 50 mph in fits during the same time, but leveled off by late afternoon at about 85 mph. Harvey was a strong Category 1 hurricane on the Saffir-Simpson Hurricane Wind Scale by dinner time.
The intensifying process then slowed. But it turns out this was temporary.
Many signs pointed to continued rapid intensification: a favorable, low-shear environment; expanding upper-air outflow; and warm sea surface temperatures. Overnight and Friday morning, Harvey continued to traverse an eddy of water with high oceanic heat content that has detached from the warm Gulf of Mexico loop current and drifted westward toward the Texas coast. Its impact is apparent as the pressure resumed its plunge and winds have responded, blowing Friday morning at a steady 110 mph with higher gusts.
Further intensification is possible.
In fact, the SHIPS (Statistical Hurricane Intensity Prediction Scheme) Rapid Intensification indices “are incredibly high,” Hurricane Specialist Robbie Berg wrote in the Thursday morning forecast discussion. Guidance from the model then showed a 70 percent chance of another 50 mph jump in wind speed prior to landfall. The afternoon guidance lowered those odds a bit, but still showed a a 64 percent probability.of a 35 mph increase.
It wouldn’t the first time a hurricane has intensified rapidly so close to the Texas coast. In 1999 Hurricane Bret did it, ramping up to Category 4 intensity with 140 mph winds before crashing into sparsely populated Kennedy County and the extreme northern part of Padre Island.
Hurricane Alicia exploded into a major hurricane just prior to lashing Houston in 1983. And 2007’s Hurricane Humberto crashed ashore losing its warm water energy source and capping its intensity at 90 mph just 19 hours after being designated a tropical depression that morning off the northern Texas Coast, a similar boost in intensity as Hurricane Harvey.
Rapid intensification so close to landfall is a hurricane forecasting nightmare. An abundance of peer-reviewed papers reveal that there’s a lot more we need to learn about tropical cyclone intensity, with more than 20 papers published in AMS journals this year alone. Ongoing research into rapidly intensifying storms like Harvey, is helping solve the scientific puzzle, including recent cases such as Typhoon Megi and Hurricane Patricia. Nonetheless, despite strides in predicting storm motion in past decades, intensification forecasting remains largely an educated guessing game.
Improving Tropical Cyclone Forecasts
Tropical cyclones are usually associated with bad news, but a long-term study about these storms now posted online for publication in BAMS has some good news–about the forecasts, at least. The authors, a Japanese group lead by Munehiko Yamaguchi, studied operational global numerical model forecasts of tropical cyclones since 1991.
Their finding: the model forecasts of storm positions have improved in the last 25 years. In the Western North Pacific, for example, lead time is two-and-a-half days better. Across the globe, errors in 1 – 5 day forecasts dipped by 6 to 14.5 km, depending on the basin.
Here are the improvements for the globe as a whole. Each line is a different modeling center:
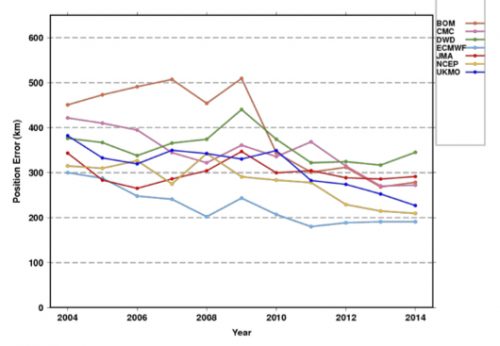
While position forecasts with a single model are getting better (not so much with intensity forecasts), it seems natural that the use of a consensus of the best models could improve results even more. But Yamaguchi et al. say that’s not true in every ocean basin. The result is not enhanced in the Southern Indian Ocean, for example. The authors explain:
This would be due to the fact that the difference of the position errors of the best three NWP centers is large rather than comparable with each other and thus limits the impact of a consensus approach.
The authors point towards ways to improve tropical cyclone track forecasts, because not all storms behave the same:
while the mean error is decreasing, there still exist many cases in which the errors are extremely large. In other words, there is still a potential to further reduce the annual average TC position errors by reducing the number of such large-error cases.
For example, take 5-day track forecasts for Hurricane Joaquin in 2015. Hard to find a useful consensus here (the black line is the eventual track):
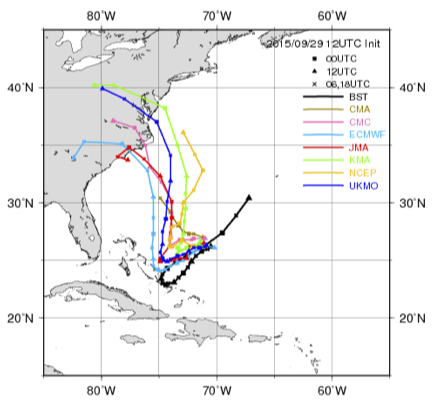
Yamaguchi et al. note that these are types of situations that warrant more study, and might yield the next leaps in improvement. They note that the range of forecast possibilities now mapped as a “cone of uncertainty” could be improved by adapting to specific situations:
For straight tracks, 90% of the cyclonic disturbances would lie within the cone, but only 39% of the recurving or looping tracks would be within the cone. Thus a situation-dependent track forecast confidence display would be clearly more appropriate.
Check out the article for more of Yamaguchi et al.’s global perspective on how tropical cyclone forecasts have improved, and could continue to improve.
Whose Flood Is It, Anyway?
When water-laden air lifts up the eastern slope of the Rockies, enormous thunderstorms and catastrophic flooding can develop. Americans may remember well the sudden, deadly inundation of Boulder, Colorado, in September 2013. For Canadians, however, the big flood that year was in Alberta.
Four years ago this week, 19-23 June 2013, a channel of moist air jetted westward up the Rockies and dumped a foot of rain on parts of Alberta, Canada. The rains eventually spread from thunderstorms along the slopes to a broader stratiform shield. Five people died and 100,000 fled their homes, many in Calgary. At more than $5 billion damage, it was the costliest natural disaster in Canadian history until last year’s Fort McMurray fire.
While we might call it a Canadian disaster, the flood had equally American origins. A new paper in early on-line release for the Journal of Hydrometeorology shows why.
The authors—Yangping Li of the University of Saskatchewan and a team of others from Canadian institutions—focused mostly on how well such mountain storms can be simulated in forecast modeling. But they also traced the origins of the rain water. Local snowmelt and evaporation played a “minor role,” they found. “Overall, the recycling of evaporated water from the U.S. Great Plains and Midwest was the primary source of moisture.”
Here is what the distribution of sources looked like. The colors show net moisture uptake from 6 hours to 7 days before the storm:
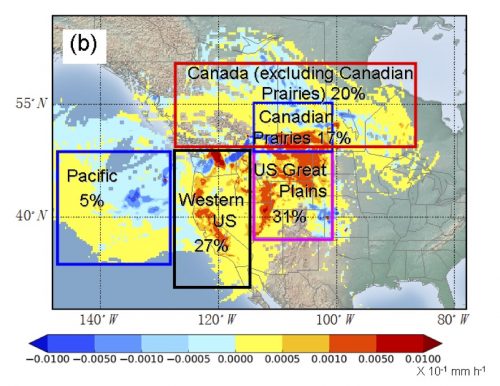
Some of the water came from as far east as the Great Lakes, and more than half from the United States. While storms along the eastern slopes of the Rockies often get Gulf of Mexico moisture, in this case, Gulf air had already dumped its moisture on the U.S. Plains. In other words, the soaked Plains merely recycled Gulf moisture back into the air to be carried into Canada.
American floods, Canadian floods, and any combination thereof—Li et al. remind us of the cross-border interdependence of weather, water, and climate … a relationship not just for this week but for the future:
The conditions of surface water availability (e.g. droughts) or agricultural activities over the US Great Plains could exert indirect but potentially significant effects on the development of flood-producing rainfall events over southern Alberta. Future land use changes over the US Great Plains together with climate change could potentially influence these extreme events over the Canadian Prairies.
For more perspectives on this noteworthy flood, take a look at another new paper in early online release–Milrad et al. in Monthly Weather Review–or at the companion papers to the Journal of Hydrometeorology paper: Kochtubajda et al. (2016) and Liu et al. (2016) in Hydrological Processes.