At its meeting this morning in Phoenix, the AMS Council has released the following statement on the Federal government’s ongoing shutdown:
Those of us who study and predict the atmosphere are familiar with the impacts of uncertainty. Americans rely on weather forecasts, and they trust them to be reliable. Lives and livelihoods are saved or lost based on the timeliness and accuracy of a single weather warning.
Unfortunately, the current U.S. government shutdown—and the associated uncertainty—is now beginning to seriously set back efforts to better understand and forecast our environment and protect the nation’s health and prosperity. National Weather Service forecasters who work without pay during a shutdown, like their peers in other essential government services, experience mounting financial and emotional stress. Years of research are jeopardized when federal scientists cannot collect uninterrupted data. When government researchers no longer maintain collaborations with their peers in academia and industry, our nation, and each and every citizen, loses out.
The uncertain length of a shutdown adds to its costly and corrosive effects. Like a chain reaction, the impacts of a government shutdown ripple far beyond those who are furloughed and can impede development of new scientific technologies that are vital to our nation. Many non-government contract employees are already on forced time off without pay, and experiencing severe financial and personal hardship; we may lose the benefit of their knowledge and capabilities as a result.
Within days, the current shutdown may become the nation’s longest on record. Virtually all other nations have mechanisms to keep partisan disagreements from closing major segments of their governments for days or weeks. Without such a backstop, every shutdown means that the U.S. loses more ground to overseas competitors, as other nations take the lead in scientific leadership.
Our nation cannot afford to undermine its scientific enterprise for the sake of policy disagreement. The AMS urges our elected officials to come together and restore normal federal government operations as soon as possible, and we strongly suggest that partisan differences of opinion be given the time and attention they deserve without the unintended consequences of holding scientific research and related activities hostage.
The AMS Annual Meeting: Always a Need to Hear the Unheard
You’ve been here before. Those previous AMS Annual Meetings, for example, right here in Phoenix. You probably have some good memories of those. But this is not the sense of déjà vu we’re talking about.
Meteorologists, and indeed scientists of many disciplines, bridge the road from societal impacts to societal progress. As a result, you’ve been in this place before: “place” in the sense of what you study, what you say, and what you accomplish. It is all predicated on the premise that the most important people in the room are the people who are not, actually, in the room. The people who flee hurricanes and tsunamis, who dig out from snow and put out wildfires, whose coral reefs are blanching—they are notably absent from conference rooms and auditoriums as well as from laboratories, classrooms, and forecast offices. Yet in the places the work of these atmospheric and related sciences goes on, these unheard voices are the pleas that are being answered.
Science is a process of voices participating in discussions across many divides. Published papers in AMS journals spread ideas from many corners of the globe, just as our Annual Meeting brings together people and their findings from across borders.
As with international borders, so too with generational borders. Discussions in Phoenix this year originate from people who were once among us, but whose voices are now silenced. You can be sure that, as much as it hurts to lose a pioneering scientist such as, say, Doug Lilly, who died this past year, his voice is still very much in the room here due to all his students and all the people influenced by his work. In fact, anyone who takes advantage of opportunities to mentor other scientists is ensuring her voice will be in many rooms she’s never entered. This is the power of a collective enterprise such as AMS.
While answering the unheard is a specialty for this community, now we are about to get even better at it. First, we greatly miss our colleagues and friends from the Federal government who unfortunately must miss this AMS Annual Meeting. The opportunities of the week are reserved for the vast majority who made it to Phoenix as planned. But remember that we are used to speaking as best we can for voices of the missing. The voice we raise, and the waves we make, will undoubtedly be all the stronger if those who aren’t here are not forgotten.
But second, and ultimately more significantly, we will get better at including the voice of the unheard–by including them in the room. One of the great strengths of AMS president Roger Wakimoto’s theme this week is directly related to this chronic condition of sciences so intimately tied to societal need: “Understanding and Building Resilience to Extreme Events by Being Interdisciplinary, International, and Inclusive.”
That last of three “I’s” is telling. Inclusiveness promotes many voices by giving people a seat at the table. No longer can AMS represent every voice by assuming that the few can speak for the many. Inclusiveness is a theme of this meeting, of this year in AMS initiatives, and a pillar of AMS Centennial activities moving forward. For example, this year’s Inez Fung Symposium includes a panel on Tuesday on “Fostering Diverse Perspectives in Climate Science.”
This year’s meeting will be a success, all the more because you’re accustomed to acting like a typical meteorologist, listening to the people who can’t be, or haven’t typically been, in the room.
Raise Your Voice for Science
by Sarah Benish and Rafael Loureiro
Academic institutions are often highly regarded in terms of ground-breaking research, but less commonly for their science-related political engagement. As two scientists in academia, we feel that it is not only our duty to be engaged in scientific political matters but also feel compelled to share our enthusiasm about science policy with our students and peers. We should all have a common goal to communicate science to policymakers, allowing better, science-informed decisions.
Through the Voices for Science program at AGU, we gathered at a two-day workshop in April 2018 with ~25 other scientists to focus on a common goal—how to be influencers in our fields about better communication of science to the general public and policy makers. We were given the opportunity to learn about the latest science policy initiatives and build on our own communication skills, such as practicing requesting that our representatives do something specific, like supporting or opposing a bill or joining a certain caucus (also known as “the ask”). The next day, we actively put these skills in use by meeting with congressional representatives on the Hill.
Since so many of us in the sciences are gathered this week at the AGU conference in Washington, D.C., we hope, by sharing our individual experiences in participating in this year-long program, you may be inspired to engage science policy in your own way, at your own institutions.
Sarah:
I am a fourth-year Ph.D. student in atmospheric and oceanic science at the University of Maryland. I study air pollution production and transport in the North China Plain and have interests in science policy, communication, and research. Originally from Oshkosh, Wisconsin, the home of the Experimental Aircraft Association, I became interested in becoming a scientist after earning my private pilot’s license.
Before Voices for Science, I had never interacted with my elected representatives before. My first experience was when I met with six legislators on the Hill with AGU. I enjoyed telling my story, explaining my research, and discussing the importance of consistent science funding in the congressional budget. Meeting with decision makers as a group was particularly useful at the beginning, especially when bringing up the “ask,” but by the end of the day, I felt confident enough to help lead the conversation to issues that were important to me.
Since meeting with my representatives, I have been regularly communicating with them. For example, when a new study linking air quality and diabetes was released in July, I forwarded the article to my representative who expressed concern about air quality legislation hurting the economy. Additionally, I sent my blog posts about my life as an #actuallivingscientist to my legislators to tell my story in how I became interested in science. I thanked my senator for supporting the Hidden Figures Congressional Gold Medal Act and asked my other senator to co-sponsor the act. However, one of my favorite interactions so far was when my senator’s office called to thank me for sending an op-ed I published in my local newspaper about air quality and health.
AGU and the Voices for Science program has provided me with support throughout this remarkable experience. I realized that many students, like me, had never contacted their congresspeople before and wanted to fill that need. So in September, I hosted a congressional letter writing breakfast at the student union at the University of Maryland. Over free breakfast, students wrote letters about science funding in FY19 to their elected representatives and were given resources and letter writing templates. In total, 40 letters to 8 different states were written including Texas, Wisconsin, Pennsylvania, and Maryland.
I was really excited to see University of Maryland undergraduate and graduate students participate in this event since many had never written their representative before. Students wrote about how basic science impacts their daily lives as well as about important data sources influential in their research. Since the event, participants have told me their representatives contacted them to further discuss science funding. That these letters have started such a conversation is a success to me.
Rafael:
I am a space botanist and currently hold two positions, one as a scientist at Blue Marble Space Institute of Science and an assistant professor at Winston-Salem State University. Quite honestly, I never knew what I wanted to do with my life but I knew that I wanted to make a difference and liked dinosaurs, so biology was the most obvious route. I never knew that dinosaurs would become a distant hobby and that the “making a difference” part would be such a pivotal part of my daily activities.
Through my teaching and research I am able to not only touch lives but also mold minds: minds avidly in search for new, exciting information about life here on Earth and possibly elsewhere in the universe. Minds that are constantly seeking to share knowledge with anyone willing to listen (and let me tell you – they are out there by the buckets full).
Voices for Science allowed me to get better at communicating my science, to tailor my speech to different audiences, from K-12 students to politicians. I have learned that they all want to listen, but it is up to you to take the first step.
Many of my initiatives involved students and my departmental peers. The greatest challenge was to show them that sharing your science with any audience willing listen to you involves adaptation and dialog. Adaptation means tailoring our speech and not try to bury people with data, charts, and super cool statistics that are completely irrelevant to them. Instead, we tell them how our science impacts they daily or future lives. Dialog means learning how to listen to what they have to say, to what it is important to them, and how can we make it important to us.
Policymakers are no different. They want to hear from you, even when your point of view, your research, or that particular budget point that you are asking for him or her to vote for goes against their agenda. The receptiveness so far has been uncanny, especially when students are involved. Students can be a great outlet for many of your professors in academia to use to communicate your science or the importance of science to your representative, your students. Young, passionate minds are among the best tools I have seen for engaging people in science policy initiatives.
Why not serve as a mentor in a Science Policy club? Organize debates between students on matters of budgeting for science. Invite local representatives to tour your institution and have students show them their passion for the science that they are developing (and most of their work is funded by agencies jeopardized by budget cuts). This is one of those opportunities for a handshake and a picture with students and your representative near that cool, very expensive NSF funded microscope—a picture you can resend when an important vote is about to come up.
With all that being said, the most important lesson I have learned from Voices for Science is that anyone can do science policy engagement. Against facts there is little room for debate, but in order to make those facts available we (scientist/students) need to be out there, sharing our science and asking everybody – how can we change this situation together?
If you are passionate about science and thinking about contacting your representatives about it, we encourage you to go for it! Here are a few suggestions:
- Have a goal. Before starting, know what you want to communicate to your elected officials. Have a clear message and a well-defined “ask.” For more information, visit AGU and AMS websites.
- Know your limits. Stay within your area of expertise or knowledge. Do not be afraid to say, “I don’t know.” If you know someone who does know, offer to connect your representative with that person.
- Encourage students. Part of our job as educators and researchers is to challenge each other’s ideas and open the door to new opportunities. Students who are already interested in science policy will partake in opportunities, but others need encouragement (sometimes, just free food) to commit to participating.
- Seek support from professional societies, like AMS. Did you know that AMS hosts a summer policy colloquium? How about the involvement AMS has briefing Capitol Hill? There are also events during the 99th Annual AMS meeting, including town halls with Marcia McNutt, the president of the National Academy of Science, Jim Bridenstine, administrator of NASA, and Bob Riddaway, president of the European Meteorological Society.
- They want to hear from you. Share your science with your local representative, either by sending him/her your latest research paper with a short commentary in layman language or inviting them to come see your lab. Your representatives need to be aware of the cool science you are doing.
Eight Decades: Mapping New England Catastrophe
Eighty years ago today (September 21st), the Great New England Hurricane of 1938 ripped across New York’s Long Island and slammed into the Northeast, killing more than 600 people and clawing its way across New England and the record books. Every hurricane to strike the region since is compared to this behemoth, and none has come close to its devastating intensity.
Ferocious winds gusting beyond category 5 intensity and an enormous storm surge that wiped out coastal Long Island and flooded into Rhode Island and Connecticut were its hallmarks. Copious rains also brought by the hurricane fell on soils swamped by heavy rain just days before the storm, leading to widespread flooding and thousands of landslides. Eight decades. And its imprint is still being realized.
Recently, new precipitation data on the storm and a precursor heavy rain event—now understood to be ubiquitous before New England hurricanes—were found. This precipitation map (right) newly appears in the 2nd edition of Taken by Storm 1938: a comprehensive social and meteorological history of the Great New England Hurricane, by Lourdes B. Avilés, professor of meteorology at Plymouth State University.
(U.S. Geological Survey)
The map was created by a grad student Avilés was advising—Lauren Carter—who painstakingly digitized thousands of observations from more than 700 daily weather stations Avilés had unearthed, spanning the 6-day event. This unique updated rainfall map is just one of many new and interesting finds detailed in the new edition of her book, which is now available in the AMS Bookstore. The book’s website houses supplemental information, including more color rainfall maps, detailed reports, and photos.
How Hurricane Florence Could Turn Weird and Deadly
Hurricane Florence is forecast to slow to a crawl as it nears landfall in the next 24 hours. As a result, some unusual and unimaginable things could happen. People in the Carolinas need to take this hurricane seriously. Even veterans of past landfalls there may be in for a surprise.
For starters, slow-moving hurricanes often deliver flood disasters. Think last year’s Hurricane Harvey with its 50- to 60-inch rains. The National Weather Service is predicting widespread rainfall in parts of the Carolinas of 10-20 inches. And some areas could be inundated with 30-50 inches as rainbands spiral ashore and hit spots repeatedly, as they did for days in Texas during Harvey.
Then there’s the storm surge. It may be unprecedented. Sure the Carolinas have endured the likes of Hurricanes Hugo in 1989, Fran in 1996, and Hazel in 1954. All brought storm surges topping 15 feet. But all were also moving quickly. A slowing hurricane like Florence could pile up a lot of water.
If it stalls offshore, says storm surge expert Dr. Hal Needham in a Wednesday blog post, “this will serve to dramatically increase the storm surge magnitude and geographic extent of coastal flooding.”
Already the National Hurricane Center expects some portions of the North Carolina coast to realize surge levels of 9-13 feet. A stalling storm piling even more water onto even more of the coast?
Needham points out an “unthinkable,” seeing that forecast models show “Florence making landfall on Thursday evening…and Florence still making landfall on Friday evening. A slow-moving hurricane tracking near a coastline is bad news indeed, as it enables the storm to inflict destructive storm surge along an extended area.”
What’s worse is that the collapsing steering currents may not just delay landfall but also could lead to the hurricane drifting southwest with its core paralleling the South Carolina coast. Initial offshore winds that are increasing as the center moves closer to any point on the coast would drive water ashore in ways unseen in other landfalling hurricanes. Intracoastal waterways could flood barrier islands on their landward sides, and previous precautions for flooding may not be sufficient.
A recent example is 2017’s Hurricane Irma flooding coastal Jacksonville, Florida. When landfalling storms approach Jacksonville from the Atlantic Ocean, winds initially blow from north-to-south. But Irma’s huge wind field instead whipped up a coastal surge from the south, swamping places unaccustomed to surge.
But Florence’s surges may be more than a directional oddity. The hurricane’s offshore winds will initially push tremendous amounts of water away from the coast, much like offshore winds emptied Tampa Bay, Florida as Irma approached. As Florence’s center then passes, Needham explains, “powerful winds in the hurricane’s eyewall, the most intense part of the storm, would immediately shift from offshore to onshore, producing a destructive storm surge in the matter of minutes.” Such sudden, extreme changes are likely to catch residents off guard.
It happened recently in The Philippines. Supertyphoon Hainan’s surge came ashore like a tsunami, Needham says, as the wind shifted direction. He notes that 2013’s Hainan was one of the most intense tropical cyclones to make landfall in recorded history, and he doesn’t expect the surge from Hurricane Florence to move as rapidly.
Still, such a sudden reversal of high winds from a hurricane moving unusually from north to south off the South Carolina coast would push storm surge quickly ashore, devastating the shoreline.
Expect the unexpected with Hurricane Florence. If local authorities tell you to leave, get out.
1871 Hawaii Hurricane Strike Shows Lane's Imminent Danger Isn't Unprecedented
Powerful Hurricane Lane is forecast to skirt if not directly hit Hawaii as a slowly weakening major hurricane today and Friday. Its track is unusual: most Central Pacific hurricanes either steer well south of the tropical paradise or fall apart upon approaching the islands. But a recent paper in the Bulletin of the AMS reveals that such intense tropical cyclones menace Hawaii more frequently than previously thought.
Hurricane Lane as of Thursday morning local time was packing sustained winds of 130 mph with gusts topping 160. Its expected track (below) is northward toward the middle islands today and early tomorrow, followed by a sharp left turn later Friday. When that left hook occurs will determine the severity of the impacts on Maui as well as Oahu, home to Hawaii’s capital and largest city, Honolulu. Although Lane is expected to slowly weaken due to increasing wind shear aloft, it appears that the Big Island of Hawaii, Maui, Molokai, and Oahu will be raked at a minimum by tropical storm winds gusting 55-70 mph, pounding surf, and heavy, potentially flooding rain. Hurricane conditions on these islands also are possible.
The last major hurricane to affect the islands with more than swells and heavy surf was Hurricane Iniki in 1992. It was passing well south of the islands when an approaching upper-air trough brought in steering flow out of the south, and Iniki made a right turn toward the western islands while intensifying into a strong Category 4 hurricane. It slammed directly into the garden island of Kauai with average winds of 145 mph and extreme gusts that damaged or destroyed more than 90 percent of the homes and buildings on the island. Iniki obliterated Kauai’s lush landscape, seen in its full splendor in such movies as Jurassic Park, which was filming there as the storm bore down.
The only other known direct hit on Hawaii was by 1959’s Hurricane Dot, which was a minimal Category 1 storm–the winds barely reaching threshold hurricane intensity of 74 mph when its center crossed Kauai. Without any prior record of major hurricane landfall, Iniki was not just rare, it was considered unprecedented.
Until now.
More than a century before Iniki, a major hurricane crashed into the Big Island, its intense right-front quadrant passing directly over neighboring Maui, causing widespread devastation on both islands. Its discovery is outlined in Hurricane with a History: Hawaiian Newspapers Illuminate an 1871 Storm, which details the narrative thanks to an explosion of literacy on the islands in the mid 19th century, which led to hundreds of local language newspapers that published eyewitness accounts of the storm.
The new historical research, published in the January 2018 BAMS, found unequivocal evidence of an intense hurricane that struck August 9, 1871, causing widespread destruction from Hilo on the eastern side of the Big Island to Lahaina on Maui’s west side. A Hawaiian-language newspaper archive of more than 125,000 pages digitized and now made publicly available along with translated articles contained account after account of incredible damage that led the paper’s authors to surmise that at least a Category 3 if not a Category 4 hurricane hit that day.
The paper’s analysis is put forth as “the first to rely on the written record from an indigenous people” of storms, droughts, volcanic eruptions, and other extreme natural events. Accounts published in Hawaiian newspapers create a living history of the 1871 hurricane’s devastation, as recounted in the paper:
“On the island of Hawaii, the hurricane first struck the Hāmākua coast and Waipi‘o valley. The following is from a reader’s letter from Waipi‘o dated 16 August 1871:”
At about 7 or 8 AM it commenced to blow and it lasted for about an hour and a half, blowing right up the valley. There were 28 houses blown clean away and many more partially destroyed. There is hardly a tree or bush of any kind standing in the valley (Pacific Commercial Advertiser on 19 August 1871).
“An eyewitness from Kohala on Hawaii Island wrote the following:”
The greatest fury was say from 9 to 9:30 or 9:45, torrents of rain came with it. The district is swept as with the besom of destruction. About 150 houses were blown down. A mango tree was snapped as a pipe stem, just above the surface of the ground. Old solid Kukui trees, which had stood the storms of a score of years were torn up and pitched about like chaff. Dr. Wright’s mill and sugarhouse, the trash and manager’s residence, were all strewn over the ground (Ke Au Okoa on 24 August 1871).
“On Maui, newspaper reports document that Hāna, Wailuku, and Lahaina were particularly hard-hit. A writer in Hāna described the storm:”
Then the strong, fierce presence of the wind and rain finally came, and the simple Hawaiian houses and the wooden houses of the residents here in Hāna were knocked down. They were overturned and moved by the strength of that which hears not when spoken to (Ka Nupepa Kuokoa on 26 August 1871).
“In Wailuku the bridge was destroyed:”
… the bridge turned like a ship overturned by the carpenters, and it was like a mast-less ship on an unlucky sail.” (Ka Nupepa Kuokoa on 19 August 1871).
“From Lahaina came the following report:”
It commenced lightly on Tuesday night, with a gentle breeze, up to daylight on Wednesday, when the rain began to pour in proportion, from the westward, veering round to all points, becoming a perfect hurricane, thrashing and crashing among the trees and shrubbery, while the streams and fishponds overflowed and the land was flooded (Pacific Commercial Advertiser on 19 August 1871).
The BAMS paper concludes that the 1871 hurricane was “a compact storm, similar to Iniki.” Honolulu escaped damaging winds or rain despite such a close encounter.
Because such historical records have been unnoticed for so long, the paper notes “a number of myths have arisen such as ‘the volcanoes protect us,’ ‘only Kauai gets hit,’ or ‘there is no Hawaiian word for hurricane.’”
Today’s powerful Hurricane Lane and the newfound historical records go a long way to dispelling these misconceptions about the threat of hurricanes in the Hawaiian Islands.
If You Can Make Climate Resilience Here, You Can Make It Anywhere!
The 10th International Conference on Urban Climate and 14th Symposium on the Urban Environment, co-hosted by AMS at City College of New York, kicked off Monday with a number of comments not only about recent extreme weather events but also the appropriateness of meeting in the Big Apple. From the opening sessions, here are remarks from Daniel Zarrilli, the city’s senior director of climate policy and programs and chief resiliency officer. You can find them at about one hour and four minutes into the archived live web stream:
On behalf of Mayor Bill de Blasio I just want to welcome everyone to New York City. A number of speakers have already indicated how perfect a location this is for this conference and I just want to echo that….There is no better place. New York City: we are an embodiment of those global trends that you’ve already heard a little about. Our population continues to grow, our economy continues to evolve, and of course climate change is putting stress on this city like no other and continues to exacerbate those other challenges as well.
We also saw, first hand, the impacts of climate change here in New York City when Hurricane Sandy roared ashore in October 2012: 44 lives lost, 19 billion dollars in damage and lost economic activities. The future had arrived and had arrived with force. It was the worst natural disaster we had ever faced.
But of course it’s not just in New York City that we’re seeing these threats. All across the globe it’s been a horror show watching the news lately with last year’s hurricane season, the wildfires across the West and in Greece, the rains in Japan. This is a global phenomenon; it’s not always necessarily called out that way in the media, but we know what’s happening. It is a global phenomenon and we need to do all that we can to make sure we’re highlighting what was the underlying cause of many of these events.
So, what are we doing here in New York City about it?….After Hurricane Sandy it became readily apparent to us that we could not simply do what maybe was in human nature or what we had done in the past of responding to the last thing that just happened and making sure that Sandy doesn’t happen again. That wasn’t going to be enough for us. It was important to open our eyes and take a step back and think about what the growing risks of climate change were going to do to a city like New York with 520 miles of coastline, with 8.6 million residents—the largest city in the U.S.
Working with our colleagues and friends on the New York City Panel on Climate Change…everything that we needed to do started with the science, started with understanding what’s coming, what is the science telling us, what are the assessments, so that we can begin to develop the appropriate plans to look toward the future. And because of that work we were able to lay out a plan that not only dealt with coastal storms of the type that we saw with Hurricane Sandy but to really understand what sea level rise will do to a city like New York with such a vast coastline. We know we have risks on the coasts, but also that heat kills more New Yorkers than any other natural hazard. We’re doing work to deal with urban heat island effect—planting more trees and that work—as well as the increased risks of rain and sea level rise in the city.
So we laid out a plan, $20 billion was really the first kick-off of that., doing some of that with federal dollars and some of that with city dollars, to do a number of things: To upgrade our coastline with better flood protection, better land use policies, better building codes, to be better prepared for the types of flood events that are becoming more frequent, more intense across the five boroughs. But we’re also doing things to look deeply at land use decisions, and zoning codes to make sure we’re making smart decisions about the future. We’re working with the federal government …to make sure we’re incorporating climate change into our flood maps going forward.
And we’re continuing to invest in civic infrastructure—all the public housing, the public hospitals, precincts, fire departments—all of those things, all those vital services to make sure in the event of future disasters they can continue to serve New Yorkers when they need to …and they’re being better prepared and they’re thinking long term about the new types of impacts that we’re going to see.
That’s really phase 1 of what we’re doing on the adaptation end. We’re spending $20 billion yes, but more importantly we’re working to institutionalize the thinking of resilience and climate adaptation to everything we do as a city. We’ve recently released climate design guidelines to deal with climate resilience issues to really bake in the thinking, the thought process, into the engineering codes when we’re dealing with uncertainty in the projections, into how you get to arrive at a number in order to build a new facility, in order to design a drainage system, for instance. So institutionalizing this becomes incredibly important to scale up our action in order to get greater impact for the dollars that we spend and not necessarily rely on the federal government or others….
All of this [is] based on the best available science that we know continues to evolve. We’re already working with Cynthia Rosenzweig (of NASA/GISS at Columbia University) and her team on continuing updates to the New York City Panel on Climate Change projections looking out to 2100. All of that informs what we’re doing. So I think it’s incredibly important that we’re here having these conversations this week, that New York City can really be a model for how science is informing the practice of climate adaptation. I would encourage all of you, as you’re thinking through this week about what can be done to further action on climate change, to find ways to communicate what you’re doing to local practitioners. Find ways to develop partnerships so that your science can integrate with what’s happening locally. It’s been incredibly effective and important to what’s happening here in New York City and I would encourage all of you to bring that home across the globe.
Oh Say Can You Breathe? The Impact of Fireworks on Air Quality in the United States
![[Photo by Mike Enerio on Unsplash]](https://blog.ametsoc.org/wp-content/uploads/2018/07/Fireworks1.gif)
by Perry Samson, Climate and Space Science and Engineering, University of Michigan
On July 4th last year, in an attempt to entertain my two grandchildren, I set off what I felt was a modest display of fireworks in our front yard. A monitor that measures the concentration of particles (PM2.5) in the air was mounted there and my colleague, Jeff Masters of Weather Underground, noticed that the concentrations being recorded were remarkably high that evening. This led us to review hourly concentrations of PM2.5 that night across the United States, collected both by state agencies and an independent network available from PurpleAir.org. Results showed widespread increases in particulate concentrations that evening, with increases varying across the country.
Nationally, about 80% of all sites saw a doubling of particulate matter during the evening of July 4, 2017 with several sites producing exceedances of the National Ambient Air Quality Standard of 150 µg/m3 3-hour standard. These results were presented at the AMS Annual Meeting in January in a talk entitled “Oh Say Can You Breathe.”
Moreover, the increase in PM2.5 seen in 2017 is consistent with other years. The increase in PM2.5 from background levels was compiled for the eight-year period 2010-2017. Over that time over 25% of measurement sites in the United States reported a rise of at least 35 µg/m3 with about 5% reporting a rise of greater than 100 µg/m3.
These results are compelling as they point out how, for at least one evening a year, we are willing to subject ourselves (and even our grandchildren) to high concentrations of particulate matter. According to the EPA, concentrations above 150 µg/m3 are considered “Unhealthy” and can cause widespread coughing and other increased respiratory effects.
While it is unlikely that there will be much political will to legislate against fireworks displays in the United States, these results should be of interest to people suffering from asthma who may want to protect themselves from outdoor air during this year’s July 4th celebrations.
As for me, and despite evidence of risk, I’m doubling down on the fireworks this year to REALLY impress the kids.
I just moved the PM2.5 monitor away from my home.
![[Photo by Sang Huynh on Unsplash]](https://blog.ametsoc.org/wp-content/uploads/2018/07/Fireworks2.gif)
Kids in Hot Cars: Tragic Misconceptions
Two tragedies last week were reminders of a continuing and underrated weather hazard: people continue to leave children in their parked automobiles, where the heat is ever escalating. The victims in the separate incidents in Oregon and California on June 20 and 21 were both under two years of age.
An average of 37 children each year die from hyperthermia while left alone in automobiles, largely due to persisting misconceptions about the heat dangers of the interior of a car.
For many years now, Jan Null, an AMS Certified Consulting Meteorologist in northern California, has been fighting these misconceptions about the heat danger of leaving children in cars. In addition to his studies, presented at AMS conferences (e.g., watch one here), Null operates a web site of statistics on child hyperthermia in cars.
Perhaps the first big misconception Null refuted is that conditions outside need to be blisteringly hot. Ordinary warm days are dangerous, too. The outdoor temperatures in last week’s deaths were 80°F and 81°F.
This point has been thoroughly documented in studies by Null as well as others, and was reviewed and refined in a paper in the Bulletin of the American Meteorological Society, by Andrew Grundstein, John Down, and Vernon Meentemeyer.
These studies show that temperatures climb surprisingly fast in the car’s interior. Here’s a table from Grundstein et al.:
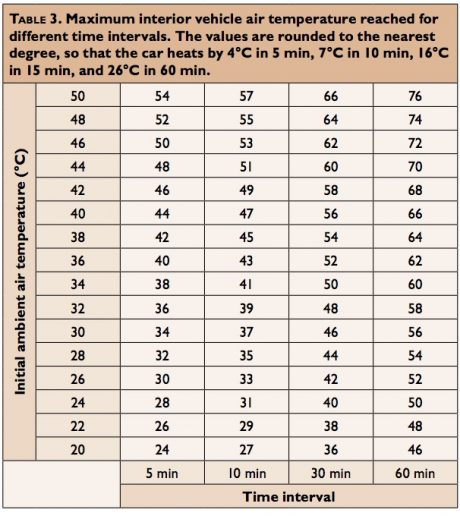
It’s also a misconception to think that adults are a good judge of what conditions are tolerable. Null reminds people that children are physically much more responsive to conditions—they heat up two or three times faster than adults.
Because leaving children unattended in cars is illegal in some states, one might think these deaths are a case of bad parents making bad decisions. Yet less than one in five of these hyperthermia deaths is because a parent intentionally left the child in the car to, say, run errands. Null’s statistics show that about 400 (54%) of the 760+ heat stroke deaths since 1998 occur when caregivers forget a child is in the car. Almost 30% of the deaths occur when children climb unattended into the cars by themselves and get locked in.
But perhaps the most insidious misconception is that unfit—or forgetful or distracted or hurried or overworked—parents are the most susceptible to being forgetful about such an important matter.
In an AMS presentation, the University of Georgia’s Castle Williams revealed the perceptions that lead to such mental mistakes. Many parents and caregivers don’t believe that they are capable of leaving a child in a car by mistake. As a result, these parents considered it very unlikely that their child might suffer hyperthermia in a car, even as they recognized that the consequences would be severe. They believed that certain demographics–poor, single, working parents–would be more prone to such mistakes. This mismatch in perception of risk and awareness of consequences creates a communication challenge.
“All parents are at risk for this issue. It can happen to anyone,” Williams noted. (The results from his interviews with parents were later published in the the journal, Injury Prevention). “None of the demographic variables show any kind of relationship of having an increased risk of this occurring.”
How to combat the deadly misconceptions about kids in hot cars? According to Williams, “New messaging should focus on increasing perceived susceptibility to emphasize that every parent and caregiver is equally susceptible to forgetting their child in a hot car.”
Organizations such as Safe Kids Worldwide have begun stepping up efforts to inform people of the risks. And Williams’s study shows parents are paying attention to news reports of incidents on TV and in social media. Perhaps the misconceptions can be dispelled soon.
Small Numbers, Big Impacts
Thanks to Markeya Thomas of Climate Signals and Climate Nexus for posting about her video on Twitter for Juneteenth yesterday.
Her interview is with two of “Weather’s Hidden Figures,” the still disturbingly small number of African-American meteorologists—barely 2% of the AMS membership. Professors Greg Jenkins of Penn State University and Deanna Hence of the University of Illinois speak eloquently on what it means to strive to make a big impact while being part of a small minority.
Both Jenkins and Hence talk about how they have been interested in weather since they were kids—sounds familiar!—as well as how opportunities to follow specific interests in human well-being triggered their passion for weather and climate-related research. For Jenkins it was realizing the potential of his climate science in helping solve agricultural security and other urgent needs in Africa.
Hence, on the other hand, had harbored interests in medicine, and found a way to keep a health impacts slant a part of her severe weather expertise:
One thing that really deeply impacted me was actually with Hurricane Katrina. I was on the research flights into that storm back in 2005, and so that particular juxtaposition of scientifically having this amazing dataset we’re collecting—[a] perfectly timed and executed field campaign—and then having to watch thousands of people die as a result. That juxtaposition…I think that’s what really cemented [the impact focus] for me.
But it takes more than interest to make it in a not-always welcoming scientific world. Says Jenkins:
I’ve been in this field for more than two decades, and being stubborn and following what you feel is important when there aren’t necessarily a lot of examples. But having that mentorship has really been important for developing strategies and tactics when you’re facing resistance. I think that’s something we have to teach younger people, that yeah, you might run into resistance, but what’s your strategy for dealing with that? Keep your cool. Press forward. Keep your goals in mind.
Hence underscored the difficulty of establishing her personal voice and commitments as an early career scientist:
I’ve…been trying to both promote, and live by example, that you can pursue social engagement, social justice, community engagement, and your science at the same time. It’s not been an easy path, and I’ve definitely had many people dissuade me from it. We’ll see how it works out for my career! So far, for me, it’s what keeps me happy and wanting to do science.
Watch the video or read Markeya’s own write-up on Medium.