With most of us focusing so much on the weather in our hometown, it can be easy to forget that a local weather event can exert global influence. But given recent events in New York City and Panama, it appears that Mother Nature has been trying to reinforce that point.
The post-Christmas snowstorm that hammered much of the eastern United States produced chaos for travelers in a number of states, but it was the 20 inches that fell in New York City that had the farthest reaching impact. The closure of all three NYC metro airports caused a ripple effect that spread across the country and throughout other parts of the world. Not only were throngs of holiday travelers stranded at terminals in New York, but more than 5,000 domestic flights–as well as many in other countries–were canceled and countless more were backed up for days while waiting for LaGuardia, JFK, and Newark airports to get up and running. So, for example, more than 200 flights were canceled at Chicago’s O’Hare and Midway airports solely because of the East Coast snow, disrupting the plans of thousands of travelers even though the blizzard was hundreds of miles to the east.
(Aside 1: What could be a better use of your time when stuck in a snowstorm than this cool time-lapse video shot during the blizzard in the New Jersey shore town of Belmar…)
(Aside 2: There’s that old meteorologists’ adage, “Nobody lives at the Airport”, which happens to be the title of Larry Heitkemper’s presentation at our Seattle meeting, Wednesday 26 January. Heitkemper discusses how to transform official airport observations into data relevant to energy demand where people actually live; apparently, however, when blizzards strike far too many people really do live at the airport.)
Meanwhile, heavy rains last month in Panama forced the Panama Canal to close for just the third time in its 96-year history. Torrential rainfall inundated parts of Central and South America throughout November and early December. Two artificial lakes (Gatun and Alhajuela) in Panama that flow into the canal rose to record-high levels, forcing the canal to close for 17 hours so that one of the lakes could be drained. While the closing was short-lived, the global effects were still significant. About 5% of all international trade utilizes the canal, with approximately 40 ships winding through its 48 miles each day. While sections of the canal have been blocked at times, it was the first time the entire canal was closed since the United States invaded Panama in 1989. The only other closures were caused by landslides in 1915 and 1916, not long after it first opened.
Uncategorized
Say It Ain't Snow, Santa
Is it possible that dreaming of a white Christmas can backfire? Parts of the United Kingdom may find out over the next week if bitter cold temperatures and heavy snowfall continues. The conditions–which also have included gale-force winds at times–are getting so severe that officials are warning that many packages may not be delivered in time for them to be opened on Christmas morning, creating the possibility that Santa may not be arriving (on time) this year. Heavy snow predicted for the weekend has already started in many locations, and severe weather warnings have been given for a number of areas. (The UK Met Office has been tracking the snowfall on an interactive map on their website.)
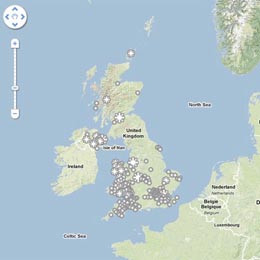
Temperatures consistently below 0°C have been chilling the region for weeks, with The Weather Outlook forecaster Brian Gaze calling the cold spell “a once-in-a-lifetime event.” Snow and ice on roads, runways, and rails have created travel headaches, with the next week likely to be even worse. But no one’s travel is as important as St. Nick’s, and at this point the forecasts are not favorable.
“This year in Scotland and the northeast [England] it is likely that Father Christmas won’t be coming,” said Simon Veale, director of the delivery company Global Freight Solutions, in a statement certain to shock children throughout the United Kingdom.
The current scene is evoking comparisons to perhaps the U.K.’s most famous holiday weather event, the 1927 Christmas Blizzard that left 20-foot snowdrifts in some locations.
It’s in the Bag
Grocery shoppers usually are prepared to answer just one question at the check out line: “paper or plastic?” In Iowa, though, if they choose paper, they can also answer questions like, “What do you do if you see a tornado?” because they’re likely looking right at the answer….on the sides of the bags filled with their purchases.
The severe weather tips printed on grocery bags are the work of the AMS Iowa State University chapter. It is one of the effective initiatives that recently earned them the AMS Student Chapter of the Year–they’ll be honored along with other 2011 AMS award winners at the upcoming AMS Annual Meeting in Seattle.
The students first provided tips advising what to do in the event of lightning, tornadoes, or flooding, in the Ames and Ankeny HyVee stores in April of last year. Chapter members came up with the idea two years ago as an easy way to increase community weather awareness. They teamed up with the Central Iowa Chapter of the NWA to create the bags and expanded the distribution through much of central Iowa, including the Des Moines metropolitan area.
The chapter plans to expand further this year, aiming to distribute these safety tips to all 220 plus HyVee stores throughout the Midwest, including in Illinois, Iowa, Kansas, Minnesota, Missouri, Nebraska, South Dakota, and Wisconsin.
A Good Climate for Looking at Clouds
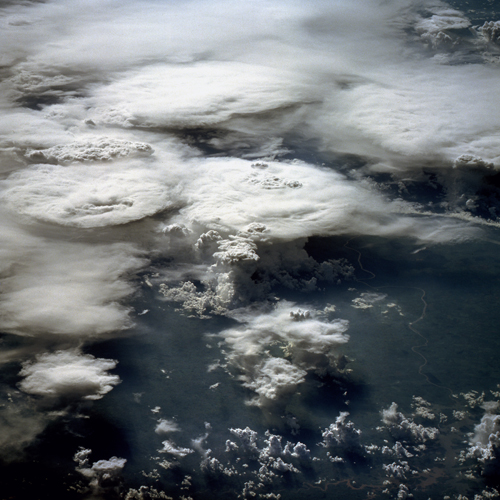
How much do we know about clouds and the effects they have on climate change? It’s a lingering source of uncertainty, with as many questions as answers. No wonder the National Science Foundation calls them “The Wild Card of Climate Change” on its new website about the effect of clouds in climate.
The site is good place to start thinking about this complicated issue. The NSF page features videos of cloud experts like David Randall of Colorado State University and AMS President Peggy LeMone of NCAR, as well as a slide show, animations, articles, and other educational material that address some of most salient cloud/climate questions, such as: Will clouds help speed or slow climate change? Why is cloud behavior so difficult to predict? And how are scientists learning to project the behavior of clouds?
The impression one gets from the website about the progress of the science in this area may vary depending on your point of view, but Randall, for one, sounds about as optimistic as you can get. In his video, he admits that optimism is a job requirement for climate modelers, but in his assessment, “We’re not in the infant stages of understanding [clouds] any more; we’re in first or second grade, and on the way to adolescence.” His hope for solving their role in climate and representing cloud effects in climate modeling rests in part on better computers and in part on the numerous bright people entering the field now, ready to overshadow the work of their mentors.
The AMS Annual Meeting in Seattle will be a good occasion to dig deeper at the roots of Randall’s optimism and sample some of the emerging solutions to the cloud/climate relationship. For example, Andrei Sokolov and Erwan Monier of MIT will discuss the influence that adjusting cloud feedback has on climate sensitivity (Wednesday, 26 January, 11:30 a.m. in Climate Variability and Change). Basically, they’re using small adjustments to the cloud cover used to calculate surface radiation in a model to create a suite of results–an ensemble. The range of results better reflects the sensitivity of climate observed in the 20th century better than some other methods of creating ensembles, such as adjusting the model physics.
Randall says in his video that early predictions about climate change are already coming to pass and this leads to optimism that more predictions will verify well in the coming years as we scrutinize climate more and more closely. This of course presupposes sustained efforts to observe and verify. Laying the groundwork for this task–and for thus better climate models–are Stuart Evans (University of Washington) and colleagues in a study they are presenting in Seattle. According to their abstract, “Improving cloud parameterizations in large scale models hinges on understanding the statistical connection between large scale dynamics and the cloud fields they produce.” Their study focuses on the relationship between synoptic-scale dynamic patterns and cloud properties (Monday, 24 January, 11 a.m. in Climate Variability and Change). Evans et al. dig through 13 years of cloud vertical radar profiles from the US Southern Plains site of the DOE ARM program and relate it to atmospheric “states”, thus providing a metric for evaluating how well climate models relate cloudiness to radiation and other surface properties.
While Evans and colleagues use upward looking remote sensing, Joao Teixeira (JPL/Cal Tech) and coauthors look down at boundary layer cloudiness from above–using satellites. They expect to show how new methodologies with satellite data can improve the way low level clouds are parameterized in climate models (Thursday, 27 January, 9:30 a.m., in Climate Variability and Change). A recent workshop at Cal Tech on space-based studies of this problem stated:
Clouds in the boundary layer, the lowermost region of the atmosphere adjacent to the Earth’s surface, are known to play the key role in climate feedbacks that lead to these large uncertainties. Yet current climate models remain far from realistically representing the cloudy boundary layer, as they are limited by the inability to adequately represent the small-scale physical processes associated with turbulence, convection and clouds.
The lack of realism of the models at this low level is compounded by the lack of global observing of what goes on underneath the critical low-level cloud cover–hence the effort of Teixeira et al. (and others) to “leverage” satellite observing, with its global reach, to improve understanding of low level thermodynamics in the name of improving climate simulations.
Kermit Would Approve
It’s not easy being green, as Kermit the Frog famously lamented on the TV show, “Sesame Street,” but it might be getting easier thanks in part to the Tungara frog—a native of Central and South America. David Wendell of the University of Cincinnati recently led a study that developed a new type of foam that can absorb CO2 and convert it to sugar before it escapes into the atmosphere (a process that occurs naturally in plants during photosynthesis). A key ingredient in the foam, which could be placed into the exhaust systems of power plants, is a protein that is naturally created by the Tungara frog to form a foam nest that protects their eggs. (Here’s a brief video showing a frog weaving the nest.) 
“I read about a protein that the frog uses that allows bubbles to form in the nest, but doesn’t destroy the lipid membranes of the eggs that the females lay in the foam, and realized that it was perfect for our own foam,” says Wendell. The CO2-absorbing foam is an amalgam of numerous enzymes harvested from plants, fungi, bacteria, and frogs, and it converts all of the solar energy it captures into sugars, making it as much as five times more efficient than plants, and, according to Wendell, “the first technology that actually consumes more carbon than it generates.” The invention recently won the $50,000 grand prize at the 2010 Earth Awards, which were founded in 2007 to encourage innovative designs “to improve our quality of life and build a new economy.”
Successful Launch for Rocket City Weather Fest
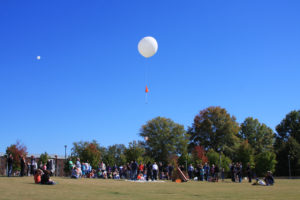 In October, the University of Alabama in Huntsville student chapter of AMS (UAHuntsville AMS) hosted its first Rocket City Weather Fest (RCWF), a free weather festival for the North Alabama community. For its debut year, the fest had close to 300 in attendance, as well as more than 50 exhibitors and presenters.
“Due to the variety of weather extremes experienced in the Tennessee Valley, one of the priorities of the UAHuntsville AMS is to educate the community about severe weather safety,” comments Sandy LaCorte, RCWF event coordinator and UAHuntsville AMS education outreach committee chair. “The event gave children and adults the opportunity to explore the atmospheric sciences through hands-on activities, demonstrations, and informative seminars, emphasizing safety and preparedness.”
At the Wacky World of Weather, kids learned about hurricanes, tornadoes, hail, and floods. Other activities included weather-themed movies in Sci-Quest’s Roaming Dome, a planetarium style inflatable theater, plus a weather miniature golf and beanbag toss. Attendees were also given the opportunity to see a weather balloon launched by the UAHuntsville atmospheric chemistry research group.
RCWF is the chapter’s newest endeavor in community outreach. Members, who are undergraduate and graduate students in pursuing careers in atmospheric and earth sciences, also speak at local schools, judge regional and state science fairs, administer tests for the Science Olympiad, and program weather radios at various events.
Getting Remote Data to Remote Regions
While Internet connections in more remote regions of the world have improved over the years, connectivity challenges still inhibit delivery of scientific data to people who need it. This past month the situation has gotten a little better, thanks to some international collaborations involving satellite data.
Often remote places are in developing countries that lack funding for the state-of-the-art connectivity necessary for scientific information. Back in 2003, in a BAMS essay, “The ‘Information Divide’ in the Climate Sciences,” Andrew Gettelman addressed the struggles of scientists in developing countries to keep up with the rest of the world in increasingly technology driven times. In visits to a number of countries around the world, Gettelman found slow or nonexistent internet access, outdated operating systems, and other hurdles limited the ability of these scientists to keep up with the literature and access data, among other problems.
The information divide is not unique to the atmospheric and related sciences. However, because of the unique role that timely information plays in forecasting, and the need for data for climate studies, the divide may be especially critical in these disciplines. Our science is global, affects people globally, and requires global information.
Five years later Michel Verstraete of the European Commission Joint Research Centre Institute for Environment and Sustainability (JRC-IES) still found limited internet access when participating in a field campaign in 2008 to study the environment around Kruger National Park in South Africa. JRC-IES and South Africa’s Council for Scientific and Industrial Research (CSIR) joined forces to address the problem of accessing large satellite data files crucial in research related to sustainable development and other environmental studies. NASA became involved the following year, when the problem of electronic access became obvious during a workshop in South Africa on use of Multi-angle Imaging SpectroRadiometer (MISR) data.
The solution: NASA recently shipped 30 TerraBytes of MISR data directly to a distribution center in Africa. CSIR will manage the center and offer free access to researchers in the region. Verstraete, along with members of the other agencies, plans to upgrade connectivity and encourage participants to share data. Verstraete says he hopes this collaboration will strengthen academic and research institutions in southern Africa.
Adds Bob Scholes, CSIR research group leader for ecosystem processes and dynamics at NASA,
The data transfer can be seen as a birthday present from NASA to the newly formed South African Space Agency. It will kick start a new generation of high-quality land surface products, with applications in climate chance and avoiding desertification.
Last month NASA also joined up with the U.S. Agency for International Development a new node for accessing satellite and other environmental information through the web-based SERVIR system. This time the local collaboration is with the International Centre for Integrated Mountain Development. ICIMOD analyzes geophysical monitoring and predictive information and also can disseminate the information through its relationships with the region’s decision makers. Remote sensing is critical in monitoring sparsely populated, difficult-to-access mountainous areas of the Hindu-Kush-Himalaya region—which includes Afghanistan, Bangladesh, Bhutan, China, India, Nepal, Myanmar, and Pakistan. SERVIR addresses issues of land cover change, air quality, glacial melt, and adaptation to climate change and other crucial issues in the mountainous region.
As Gettelman concluded in his article:
Perhaps the most important recommendation is that, as we restructure the model of scientific communication in the information age, we ensure that it benefits the maximum number of people. The greatest gains in terms of lives saved and mitigation of the impacts of weather extremes and changes in the climate can most likely come from not just improving the state of knowledge but improving the access to existing knowledge and information by scientists, forecasters, and policy makers around the world.
Up, Up, and Away!
When seven-year-old Max Geissbühler wanted to make a homemade spacecraft, his father, Luke, was skeptical that it could be done. But with further investigation (and further lobbying from Max), they realized that a simple weather balloon combined with some modern technology would allow them to not only create a workable “spacecraft,” but make a video of its flight, as well, tracking its movement as it ascended 19 miles into the upper stratosphere.
The father-and-son team created a small capsule out of a fast-food container that they sprayed with insulation. They put a camera and an iPhone into the container and protected them from cold temperatures they would encounter with chemical hand-warming packets. Then they filled the balloon with helium, attached it to the capsule, and launched it from the town of Newburgh, New York. Its rapid ascent at 25 feet per second brought it through 100-mph winds to a maximum height of about 100,000 feet before the balloon burst, approximately 70 minutes after it was launched. A parachute attached to the capsule brought it back to ground only about 30 miles from its launch site; they found it thanks to a GPS application on the iPhone. Both the phone and camera were intact, and the camera recorded all but the last couple minutes of the flight.
Homemade Spacecraft from Luke Geissbuhler on Vimeo.
The remarkable video that resulted has been a hit at video-sharing sites like Vimeo, where it has been viewed more than 3.7 million times in just one month. A website about the balloon project and possible future endeavors can be found here.
Framing the Framers: Updating Science Communication
Some of you may remember a lively panel on the Science of Communication at the 2008 AMS Annual Meeting. It featured a presentation by author Chris Mooney (audiovisual version here) from the trenches of the now full-blown communications quagmire of climate change politics.
Since communication is the overarching theme of the upcoming Annual Meeting in Seattle, it is interesting that a number of climate scientists are trying to shed central tenets of that session, which seemed so cutting-edge two years ago. As a result, judging from some of the scheduled papers, the shape of discussion on communications philosophy in Seattle is going to be quite different than it was three years earlier.
Recall that one of Mooney’s main take-home messages was based on the research of his friend, American University communications professor Matthew Nisbet, on “frames” in communication.
Basically the idea is that information succeeds in becoming memorable, perhaps changing an audience’s thinking, if it is conveyed within an effective “frame.’ Framing can be a story, a useful reference, symbol, or metaphor, a style of delivery (folksy, serious, humorous, self-deprecating, authoritative). Is the science a story of underdogs prevailing? Of frontiers opening? Of prosperity ensuing? Is it scary? Exciting? Weird? Does the science resonate with preexisting perceptions and priorities? Success all depends on knowing your audience and the moment.
In a recent interview, Nisbet says bluntly that the typical frames employed to argue for action on climate mitigation have been ineffective or counterproductive, losing out to competing frames.
If refining frames sounds like it’s more about politics than science to you, then you’re not alone. A number of scientists seem to be growing wary of this focus on framing. The Symposium on Policy and Socio-Economic Research at the upcoming AMS Annual Meeting in Seattle will delve into these frustrations with framing. Speaking directly to the problem of fear-mongering that Nisbet mentions in the interview linked above, Renee Lertzman of Portland State University (4:45 p.m., Tuesday) will discuss how the psychology of anxiety “can evoke complicated, often contradictory emotional and cognitive responses that may hinder or support efforts for effective communications” about the uncertain future. That goes for climate prediction as well as weather forecasting.
The response to poor framing of climate change science has lately turned away from “better” framing. Some climate researchers
Follow the Water
As the world’s population grows, so does water usage. As a result, the rate we pump water out of the ground to satisfy our thirst and, more frequently, the thirst of the plants we grow, has been exceeding the rate that precipitation can replenish that water. From the news page of the International Groundwater Resources Assessment Centre about a study in Geophysical Research Letters:
The results show that the areas of greatest groundwater depletion are in India, Pakistan, the United States and China. Therefore, these are areas where food production and water use are unsustainable and eventually serious problems are expected. The hydrologists estimate that from 1960 to 2000 global groundwater abstraction has increased from 312 to 734 km3 per year and groundwater depletion from 126 to 283 km3 per year.
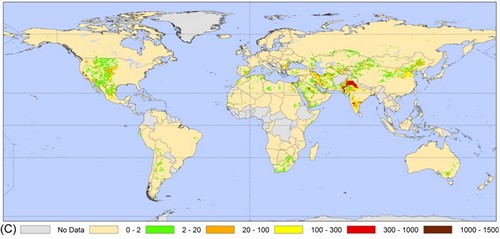
Not only does the depletion threaten food supplies in the long run, but it also adds to global level rise. The GRL article quantified this effect, showing that a quarter of the sea level rise since 2000 is due to aquifer depletion. Water that would have stayed underground 50 years ago is now used by people and their plants, then evaporated; eventually most of it finds its way back to the oceans.
As Roger Pielke points out in a recent post, there is much to be learned about the effect of this water on climate. Not all water under the surface of the Earth is a renewable resource. While some aquifers indeed are readily replenished by recent precipitation, others have been (or were) locked away from ground sources for many years, due to geology. These isolated reserves, called “fossil water,” were formed long before humanity and have yet to be adequately inventoried. Some of them, like the Ogallala aquifer, have been tapped for agriculture. Thus fossil water is being returned to the water cycle (hence, climate) after a long absence.
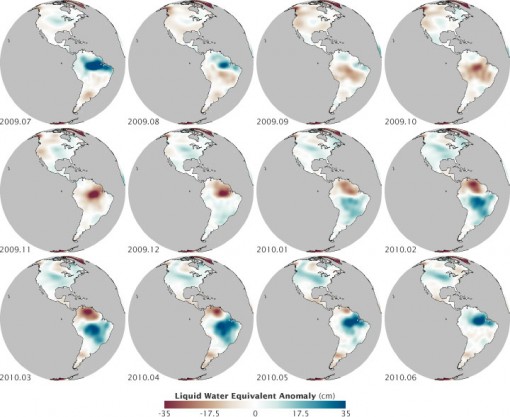
All of this fuss over emptying ground water is a good introduction to the “image of the day” from NASA’s Earth Observatory. Not surprisingly, heavy liquid shifting to and from land has a significant local effect on the gravitational pull of the planet. (Fluctuations of the water table are also hypothesized by some geologists to trigger mid-continental plate earthquakes, but that’s an obscure intersection of geology and meteorology, reviewed in this month’s Bulletin of the Seismological Society of America, to explore in your spare time.) The gravitational effect of water is the basis of water distribution observations from the GRACE (Gravity Recovery and Climate Experiment) mission:
the satellites measured how Earth’s gravity field changed as water piled up or was depleted from different regions at different times of year.
Below is GRACE data from 2009-10 mapped by NASA’s Robert Simmons, showing how the water year giveth (blue) and taketh away (red). (There will be more on watching water resources carefully from space in presentations at the AMS Annual Meeting, including NASA’s David Toll on the NASA Water Resources Program on Tuesday 25 January.)
