Thanks to Markeya Thomas of Climate Signals and Climate Nexus for posting about her video on Twitter for Juneteenth yesterday.
Her interview is with two of “Weather’s Hidden Figures,” the still disturbingly small number of African-American meteorologists—barely 2% of the AMS membership. Professors Greg Jenkins of Penn State University and Deanna Hence of the University of Illinois speak eloquently on what it means to strive to make a big impact while being part of a small minority.
Both Jenkins and Hence talk about how they have been interested in weather since they were kids—sounds familiar!—as well as how opportunities to follow specific interests in human well-being triggered their passion for weather and climate-related research. For Jenkins it was realizing the potential of his climate science in helping solve agricultural security and other urgent needs in Africa.
Hence, on the other hand, had harbored interests in medicine, and found a way to keep a health impacts slant a part of her severe weather expertise:
One thing that really deeply impacted me was actually with Hurricane Katrina. I was on the research flights into that storm back in 2005, and so that particular juxtaposition of scientifically having this amazing dataset we’re collecting—[a] perfectly timed and executed field campaign—and then having to watch thousands of people die as a result. That juxtaposition…I think that’s what really cemented [the impact focus] for me.
But it takes more than interest to make it in a not-always welcoming scientific world. Says Jenkins:
I’ve been in this field for more than two decades, and being stubborn and following what you feel is important when there aren’t necessarily a lot of examples. But having that mentorship has really been important for developing strategies and tactics when you’re facing resistance. I think that’s something we have to teach younger people, that yeah, you might run into resistance, but what’s your strategy for dealing with that? Keep your cool. Press forward. Keep your goals in mind.
Hence underscored the difficulty of establishing her personal voice and commitments as an early career scientist:
I’ve…been trying to both promote, and live by example, that you can pursue social engagement, social justice, community engagement, and your science at the same time. It’s not been an easy path, and I’ve definitely had many people dissuade me from it. We’ll see how it works out for my career! So far, for me, it’s what keeps me happy and wanting to do science.
It’s been more than 8 months. Since Maria. Irma before. And Harvey before that. For many who endured them, it was yesterday. And here we are at the start of another hurricane season. What can we expect? It is nearly indisputable that there will be hurricanes. NOAA’s forecast issued last week calls for 5-9 of them this year. Will they strike land? Science can’t yet say whether any hurricanes and tropical storms will or won’t later this season. It depends on atmospheric steering currents in the Atlantic basin and how they set up this year, particularly during the heart of the six-month season—from August through October.
But new research is looking beyond this season, beyond many seasons, and is discovering a different type of hurricane season less than 80 years from now, as Earth’s climate warms.
The new study published in the Journal of Climate finds that near-future hurricanes will be wetter and stronger, and they likely will move slower than before, increasing the risk of serious landfall flooding.
Scientists analyzed more than 20 recent hurricanes to determine how they might change near the end of this century, assuming an increase in global temperatures. One such hurricane—Ike from 2010, which inundated coastal Texas, killing more than 100 people and obliterating the popular Bolivar Peninsula barrier island north of Galveston, would have 13 percent stronger winds, move 17 percent slower, and be 34 percent wetter in a warmer world.
Others might move faster and be slightly weaker. But none of the storms reanimated in the future became drier.
“Our research suggests that future hurricanes could drop significantly more rain,” says NCAR scientist Ethan Gutmann, who led the study. Hurricane Harvey unloaded three to four feet of rain in a wide swath from Victoria, Texas, across the Houston area and into Port Arthur in extreme eastern Texas, breaking records and causing devastating flooding, and demonstrating “just how dangerous that can be,” Gutmann says.
That danger is being magnified as coastal populations continue to exponentially grow. “The potential influence of climate change on hurricanes has significant implications for public safety and the economy,” NCAR stated in a release about the new research. The study showed that “the number of strong hurricanes, as a percent of total hurricanes each year, may increase,” Ed Bensman, an NSF program director in the Division of Atmospheric and Geospace Sciences, says. “With increased development along coastlines, that has important implications for future storm damage.”
NSF supported the study, which viewed future hurricanes for the first time collectively at high resolution. Past studies looking at how hurricanes may change in a warmer climate have relied on climate model projections that are determined on a global scale and with temporal resolution of decades to centuries. Their resolution is too low to “see” future hurricanes. Weather models, on the other hand, can see them, but they aren’t used to see long-term because of the high costs of running them.
With the new research, scientists made use of an enormous NCAR dataset and ran the Weather Research and Forecasting (WRF) model at a high resolution (4 kilometers, or about 2.5 miles) focused on the lower 48 United States for two 13-year periods. The first determined the weather as it happened between 2000 and 2013 and the second simulated the same weather but with a climate 5° C (9° F) hotter and subsequently wetter that was warmed near the end of this century by unabated greenhouse gas emissions.
Comparing 22 historic Atlantic hurricanes to the same number of future hurricanes with very similar tracks found a collective 6 percent increase in top wind speeds, but a 24 percent increase in average rain rates. The future storms moved 9 percent slower than in the past.
Individually, each hurricane was unique, some changing one way and others differently. All were rainier. And while other studies have suggested that increases in atmospheric stability and wind shear may lower the total number of annual hurricanes and tropical storms, “from this study we get an idea of what we can expect from the storms that do form,” Gutmann says, and they are likely to be more intense. There isn’t a way to tell yet what this year’s hurricanes will be like. But it’s another year into our warming world, and this is yet another study pointing to ominous changes with hurricanes in our future.
In a “post-truth” world of contemporary politics and culture, “it’s easy to assume that science is really in trouble and everything is bad,” said Jane Lubchenco in her James R. Mahoney Memorial Lecture in Washington, D.C., last month.
In fact, science does have its image problems: most people don’t interact with science and don’t know scientists. A recent study showed that only 30% of Americans can even name one living scientist—and the most commonly cited name on that list last year, Stephen Hawking, no longer qualifies.
But the annual Mahoney lecture, hosted in part by AMS and NOAA, is now online, and you can see for yourself that even with a hard-hitting topic of “Science in a Post-Truth World,” Lubchenco was full of hope and practical advice about engagement, and ultimately about working toward a new paradigm of “embedding” scientists in society.
First of all, the vital signs of science are good. Public trust in scientific leaders has been stable for decades, even as it has plummeted for bankers and politicians. A majority believe science has been beneficial for society.
Lubchenco, a marine ecologist and now Distinguished University Professor at Oregon State University, has solid reason to think we can build on such durable trust. She has a history of commitment to communicating about science, as a former president of the American Association for the Advancement of Science and later as the NOAA Administrator. She’s been involved in efforts to help scientists communicate better—for example as a co-founder of COMPASS, a group that among other things provides a handy online workbook for scientists engaging the public.
In part Lubchenco argues for better understanding of the rift between scientists and the public. She cites inequities and “powerful vested interests promulgating a self-serving, anti-science agenda.” She also notes the decline of media business models that has led to citizens individually choosing their sources of information. Meanwhile, people also tune out scientists who seem to have ulterior motives, or are all “doom and gloom.”
Lubchenco says part of the solution is simply putting a real human face on science. The fact that people don’t know scientists means we have “an incredible opportunity. We need more scientists who are seen as scientists by the general public.”
Lubchenco argued that this doen’t mean every scientist is suited to being a celebrity or even a regular public messenger. Research shows that people are considered trustworthy when they are competent—but they also need to be “warm.” Teachers and nurses rated highly in both; professors and scientists rated highly in competence, but were seen as “cold.”
“Part of that is the way scientists are trained to talk to people,” said Lubchenco. It’s the downside of a facts-only, no-stories scientific culture. Lubchenco urges good analogies and metaphors and above all, making a connection with audiences. “Finding common ground and creating a shared value experience enables you to then pursue things that might be particularly contentious.”
While Lubchenco offered many tips on better communication—understanding audience, keeping messages simple, offering hope, showing value and successes—she went deeper, arguing that scientists need to be “physically and psychologically integrated” with society. She urged scientists to show who they are by working with society. One avenue is to enlist citizen scientists as well as a broader public in observing and other projects.
Lubchenco also wanted her audience to see beyond the dichotomy of applied and basic science—that we need more of the middle way of “use-inspired science” that has immediate relevance as well as prospects for advancing basic knowledge.
What are impediments? Science itself needs to reward its people who are good at outreach, Lubchenco said. They need training and recognition for it. They need to get involved, including running for political office. “I don’t think all scientists should be engaging… but they should all support their colleagues that do.”
There may already be progress in this direction, Lubchenco noted, moving first from an “ivory tower” model of science to a post-World War II “social contract” with the public, producing great benefits. “Now, I think we’re seeing another innovation from social contract to science embedded in and serving society—maybe.”
If people generally don’t know any living scientists, there’s one whose recent example can be an inspiration for Lubchenco’s vision of science more fully “embedded” in society: That would be the late Jim Mahoney, the NOAA Deputy Administrator, AMS president, and public health scientist whose memory this annual lecture honors. Said Lubchenco,
Science is indeed facing some major challenges. Maybe it’s not quite as bad as we thought, but we have unparalleled opportunities to serve society better and this is only going to happen if scientists take the bull by the horns and step up and make things happen.
I’d like to think we can do this in a way that is inspired by Jim’s example in confronting challenging times and figuring out how to navigate those. I would suggest that maybe if he were here, he would say, “It’s time for us to take back the narrative.” It’s time to write a new chapter in the relationship between science and society and for us collectively to have a quantum leap in relevance.”
Severe but highly variable wind damage to homes & infrastructure is a hallmark of intense tropical cyclones. Until recently there was only speculation that such damage, which appears in short swaths, was the work of tornadoes. Now, there’s first-ever proof that tornadoes and other small-scale phenomena did indeed enhance the winds and damage in Hurricane Harvey last August. Fine-scale DOW radar imagery from inside the eyewall of Hurricane Harvey (Left: radar reflectivity, Right: Doppler velocity). The ring of convection comprising the eyewall is highly perturbed by four MVs (labeled A-D). From inside the eye, the wind perturbations caused by the MVs are especially visible. DOW location is the yellow dot. Black rectangle is zoomed-in area shown in figure below illustrating tornado-scale vortices.
Doppler of Wheels (DOW) radar in the eye of Harvey revealed mesovortices (MVs) rotating swiftly around the inner eyewall, and embedded in them and documented for the first time were small tornado-scale-vortices (TSVs) less than a half-mile wide spinning within the larger wind field of the hurricane. The discovery was reported in March in a paper published in Monthly Weather Review.
The rotation of the TSVs is weaker than typical supercell tornadoes, but because these circulating winds are embedded in an already extreme eyewall, they ramp up the wind speed and create greatly enhanced damage potential, says the study’s lead author Joshua Wurman of the Center for Severe Weather Research. In Harvey, major hurricane winds of about 120 mph ramped up to 130-140 mph or more and resulted in streaks of severe damage not evident elsewhere from the eyewall winds.
“Wind gusts at the DOW site were measured up to 145 mph, likely caused by a TSV, and 30% of the vehicles parked near the DOW were lofted,” Wurman wrote in a summary of the paper to appear in a forthcoming issue of the Bulletin of the AMS. A Jeep and two SUVs were picked up by the wind and landed atop debris from the destroyed building in which they were housed. He said the swaths of intense damage corresponded to the tracks of the eyewall TSVs. Doppler velocity data reveals single and paired TSVs (black circles) translating southward in Harvey’s northwestern eyewall embedded in strong northerly flow (black arrow). These TSVs, moving southward at up to 120 mph, were associated with very intense winds measured up to 145 mph, lofted vehicles, and swaths of the most intense building damage.
Wurman and co-author Karen Kosiba, also with CSWR, will present their research findings from Hurricane Harvey as well as newly identified evidence of at least one Harvey-like TSV in Hurricane Irma over Florida at the 33rd AMS Conference on Hurricanes and Tropical Meteorology next week in Ponte Vedra Beach, Florida. The conference will feature a number of other presentations on the devastating hurricanes of 2017, in multiple sessions (Session 1, Session 2, Session 3, Session 4). Intense wind gusts, likely caused by TSVs in Harvey’s eyewall, lofted SUV-type vehicles (red arrows; green arrows point to unlofted vehicles). Wind gusts as intense as 145 mph were measured by a DOW-mounted anemometer 350 m downstream from these lofted vehicles.
Wurman notes that it’s unclear whether the new wind whirls are more numerous in intense or rapidly strengthening hurricanes. But adds that the enhanced damage was palpable, and with an increase in powerful hurricanes possible due to rising global air and ocean temperatures, it’s important to learn more about them, he says.
“Potential climate change may result in more frequent intense and/or rapidly intensifying hurricanes, thus understanding and forecasting the causes of hurricane wind damage is a high priority.”
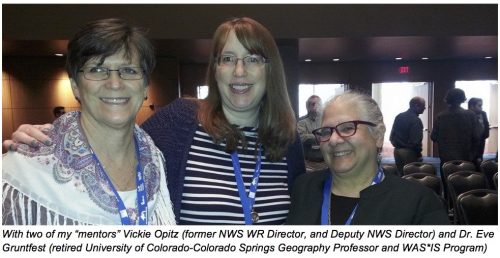
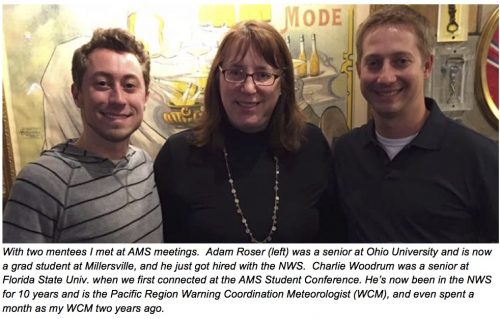
by Tanja Fransen, AMS Councilor and Mentoring Program Ad-Hoc Committee Chair
AMS has a wealth of talent and we’d love to see more of our members signed up for the Mentoring 365 program as mentees, mentors–maybe both! We should never stop learning. When I started in college and early in my career, I hadn’t even heard of the term mentor, let alone thought of myself as a mentee. Looking back now, there are so many people who I can count as someone who had a positive influence in my decisions and the path my career took. Coaches, mentors, professors, classmates, co-workers, bosses, supervisors, leaders: they all had a hand in shaping my career because they invested their time in me. Who are you investing your time in? Who is investing their time in you?
About ten years ago, through various leadership programs, I learned more about formal mentoring, and I couldn’t help but wonder, “Why doesn’t everyone have a mentor?” It’s a logical step for anyone who is excited about their careers and looking for guidance. Everyone can benefit from having a non-coworker or non-supervisor to talk with, who will be honest with them, encourage them, celebrate their successes, and help them get to the next levels in their careers. I’ve participated in several formalized programs, and it always puts a smile on my face to see these mentees doing well. One of the most amazing moments for me was having a mentee whose son was murdered while we were working together. We went from my mentoring someone in sciences and government, to learning one of the most amazing lessons about grace and forgiveness, and I’ll never forget that experience. Not all benefits are apparent when you start a program!
When I was nominated to run for the council of the AMS, it was an obvious niche that was needed. I made it one of my priorities to bring a formal program to all of our AMS members. With the help of others within AMS who also had our people as their passion, including Matt Parker, Keith Seitter, Wendy Marie Thomas, Wendy Abshire, Maureen McCann, and Donna Charlevoix, we were able to connect AMS with the American Geophysical Union’s (AGU) Mentoring365 program through a signed MOU. AMS members can join this program as either a mentee, a mentor or both. You also have access to mentors across the geophysical sciences, including members of the AGU, the Society of Exploration Geophysicists (SEG), Association for Women Geoscientists (AWG), and the Incorporated Research Institutions for Seismology (IRIS).
I’ve met the most amazing people thanks to AMS, from the enthusiastic students, to the eager early career professionals to the mid- and late-career professionals who have the most amazing resumes and curricula vitae! Let’s tap into all of that energy out there and build Mentoring 365 for the benefit of all! Join today!
Geostationary Operational Environmental Satellite 16, now GOES-East, became operational in December and this eye in the sky is capturing stunning color weather imagery daily. Today, it’s the third nor’easter in two weeks explosively developing into a blizzard off the Northeast Coast. GOES-16 GeoColor image of the March 13, 2018 blizzard wrapping up off the New England coast. Image from 10:47 a.m. EDT. Click here for a loop of the storm.
Following on the heels of the deadly and damaging storm of March 2, which cranked out onshore wind gusts of nearly 100 mph flooding the eastern New England coastline while dropping more than three feet of snow inland, and last week’s barrage of heavy wet snow that knocked out power to more than a million customers, today’s storm is delivering blizzard conditions to eastern New England, with the potential to bury the region with as much as two feet of late-season snow.
And it’s hitting on an auspicious date. Twenty-five years ago today the infamous Superstorm of 1993 (March 13-14) exploded into the history books with crippling snowfall and ferocious winds from the Gulf Coast to the Northeast, and with severe thunderstorms, tornadoes, and deadly storm surge in Florida. The massive comma-shaped cloud of the Superstorm of March 13-14, 1993, envelopes the entire eastern United States. Click here for an animation of this “Storm of the Century.”
GOES H, which launched on February 26, 1987, and became operational as GOES-7 captured the image of the Superstorm above.
Also known as the “Storm of the Century,” it set record-low barometric pressures across the Southeast and Mid-Atlantic states and ranks among the costliest and deadliest storms of the twentieth century, killing hundreds of people. Jeff Halverson of NASA reports in a Washington Post article the five most remarkable attributes of the Storm of the Century, including that in 2017 dollars the storm cost $10 billion.
The NWS office in Wilmington, North Carolina has an online report of the Superstorm, including its meteorological history, animated satellite imagery, observations, weather maps, links to local newspaper stories, personal accounts, photos, video, and links to technical reports on the storm.
Three papers were published in BAMS just two years following the epic storm. One was an overview of the meteorology of the storm, another looked at forecasting the storm from an operational perspective, while the third looks at what computer models of the day were seeing beforehand.
Similar to today’s blizzard, and arguably even better for such a huge event, the Superstorm of 1993 was well forecast; as many as 5-6 days in advance computer models of the day depicted it run-after-run.
What’s different today is the crisp imagery of weather systems in the Eastern United States from the most advanced GOES satellite in orbit so far. GOES-East employs an Advanced Baseline Imager (ABI) that is state-of-the-art, enabling visible and infrared imagery as well as the generation of many high-level products. A paper published in BAMS in 2017 takes a closer look at the ABI on the GOES-R series, highlighting and discussing the expected improvements of each of its attributes.
By Chris Cappella, AMS
It began with a whisper. And ended in smothered silence for millions.
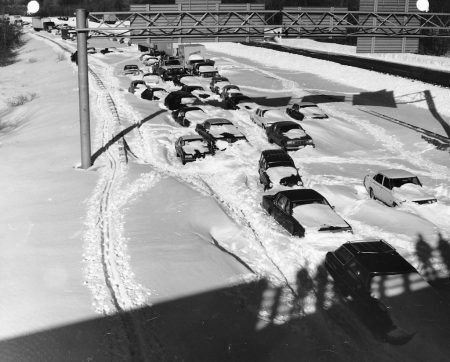
Cars and trucks stuck in snow on Route 128 near Needham, Massachusetts, following the Blizzard of ’78. Source: U.S. Army Corps of Engineers Slideshow of blizzard photos.
I’ll never forget seeing tiny snowflakes blowing down Ocean Avenue in our small sea-side suburb of New Haven. In my hometown of West Haven, on the south shore of central Connecticut overlooking Long Island Sound, when snow fell it usually just stuck, firmly. On everything. The relative warm ocean water often changes our winter events to miserably cold rain. It never allows for dry, powdery snow. Or so I thought. Today—February 6, 1978—would be different. Far, far different. Than many of us hearty New Englanders, as we’re known, had ever seen. For that silky soft sinewy snow I was seeing in the infancy of this storm would grow into a furious blizzard and bury the region—a blizzard by which all others there since would be measured.
The tiny flakes blew into snowy tendrils that would side-wind down the road until they escaped the wind. And pile into miniature snowdrifts. A harbinger of things to come, but on a gigantic scale. This was the beginning of the epic Blizzard of ’78 in New England. Over the next 30+ hours, the snow would fall heavier than anything I—and most of us in the Northeast—had ever experienced. Sideways snow. Two to three inches an hour. For hours and hours. Blowing in winds gusting over 50 mph region-wide, and to hurricane force along the coast. 110 mph Scituate, Massachusetts. Snow so deep even as a 12-year-old I would struggle to walk in it. Drifts so large and deep they dwarfed entire houses. You could jump off second-story rooftops into them. And my friends and I did. Off our grammar school roof. Even its 45-foot high gymnasium roof. Weightless, for a second or two. And then: whump! We’d completely disappear in snowdrifts 10-15 feet tall.
Buried barely begins to describe the otherworldly landscape. Nearly all human life in the region would slow down and eventually grind to a halt. Thousands of people stranded on roadways as blinding snow enveloped everything, too quickly to make an escape. Governor Ella T. Grasso ordered all vehicles off the roads. We capitalized on it. Building giant snow forts with tunnels in the mountains of snow piled on sides of our road. Only once, though, did we recklessly dive into our snow tunnels to escape an oncoming snowplow. Luckily for us kids the snowplow only took out the last 3-4 feet of our tunnels, sparing us certain death. By snowplow.
Legendary Boston meteorologist, Harvey Leonard, who was just 29 then, remembers seeing “big potential” for a major snowstorm coming together in the Northeast four days beforehand—a lead-time “close to unheard of” in those days, he told The Boston Globe in a recent article chronicling the blizzard.
“As a person — not only a meteorologist, but somebody who really loves weather and is fascinated by storms, particularly winter storms — it was pretty amazing to see what was unfolding. ‘78 still stands as the most powerful and wide-reaching storm that I’ve ever been involved in forecasting and experiencing.”
The defacto “official” website devoted to the storm—blizzardof78.org—put together by amateur historian Matt Bowling describes how a failed forecast weeks earlier set up a situation in which people headed to work and school that Monday morning, February 6, as if just a routine snowfall was expected.
It is safe to say that by the time February 6th, 1978 came along, New Englanders had been pretty-well trained to not pay much attention to the weathermen. It had been a difficult winter already. On January 21st, as most forecasters predicted only rain, New England had been blanketed by a major league snowstorm that dropped 21 inches of snow in Massachusetts and downed a record number of power lines in Rhode Island. This forerunner to the Blizzard of ’78 had brought so much snow that the roof of the Hartford Civic Center actually collapsed from the weight. When forecasters began predicting another big storm, nobody thought too much of it.
In a series of quotes gathered and posted to the site, WTNH-TV meteorologist and Western Connecticut State University professor Dr. Mel Goldstein continues this theme, describing why there was skepticism about the forecast for the storm:
Back in 1978 we did not have the accuracy of the computer models that we have today. And in 1978 there was a brand new computer model that came out and it was predicting the storm to be pretty much the magnitude it turned out to be. But because the computer model was brand new, people did not have confidence in it. And so there was some question whether or not people wanted to buy into the kind of product that it was delivering. To me it looked very reasonable … and I took my little bag of clothes and I moved into Western Connecticut State College weather lab and I said, ‘I’m going to be here for a few days and there’s no question about that. It’s in the logbook on that day: ‘a granddaddy of a snowstorm is coming our way.’
And in another Boston Globe article, noted weather columnist David Epstein wrote four years earlier about The meteorology behind the blizzard of February 6-7th 1978. In his article he reiterates how so many were caught off guard by the blizzard.
Computer models were still relatively new and a series of busted forecasts left many people skeptical that a big storm was actually coming. On the morning of the 6th, snow was suppose to start prior to the morning commute. However, when folks awoke and saw the snow hadn’t begun many of them decided it was another busted forecast and went to work. These same people would then try to get home that afternoon while the blizzard was fully underway.
A search on YouTube turns up numerous documentaries on the Blizzard of ’78, including “Blizzard of ’78,” below, on Leonard’s station WCVB.
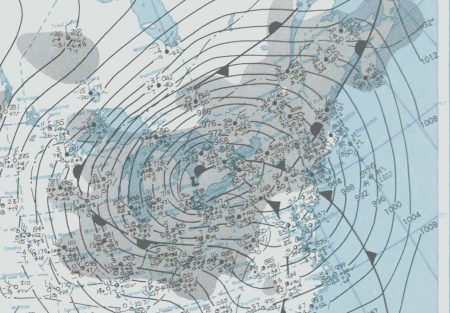
Remarkably, New England’s Blizzard of ’78—with its record snowfall observations in Boston and Providence and its utter destruction along the Massachusetts coast as powerful winds slammed monster waves ashore through four tide cycles—came on the heels of a nearly equally intense blizzard that slammed the Midwest on January 25-27. That Blizzard of ’78 became known as the White Hurricane, with wind gusts of 100 mph and feet of snow shutting down states from Wisconsin to Ohio. It set pressure records (956.0 mb in Mount Clemens, Michigan—third lowest non-tropical atmospheric pressure ever recorded in the Unites States) and remains the worst blizzard on record in Ohio, Indiana, and Michigan. Surface weather analysis of the Great Blizzard of 1978 on 26 January 1978. Source: NOAA
Its magnitude was summed up in a statement by NWS Detroit meteorologist C. R. Snider on January 30, 1978:
The most extensive and very nearly the most severe blizzard in Michigan history raged January 26, 1978 and into part of Friday January 27. About 20 people died as a direct or indirect result of the storm, most due to heart attacks or traffic accidents. At least one person died of exposure in a stranded automobile. Many were hospitalized for exposure, mostly from homes that lost power and heat. About 100,000 cars were abandoned on Michigan highways, most of them in the southeast part of the state.
Nearly three dozen times as many cars abandoned—and that was in just one Midwestern state.
To some, Blizzard of ’78 conjures up memories of a similar yet completely different storm.
AMS Executive Director Keith Seitter sent a letter today to President Trump. It begins,
In an interview with Piers Morgan on Britain’s ITV News that aired Sunday, 28 January, you stated, among other comments:
“There is a cooling, and there’s a heating. I mean, look, it used to not be climate change, it used to be global warming. That wasn’t working too well because it was getting too cold all over the place”
Unfortunately, these and other climate-related comments in the interview are not consistent with scientific observations from around the globe, nor with scientific conclusions based on these observations. U.S Executive Branch agencies such as NASA and NOAA have been central to developing these observations and assessing their implications. This climate information provides a robust starting point for meaningful discussion of important policy issues employing the best available knowledge and understanding.
Read the whole letter here.
In response to the BBC interview, Bob Henson of Weather Underground’s Category 6 blog gave a detailed debunking of the President’s comments. It’s a useful read for those wanting to parse out the persisting misunderstandings about the climate change discourse.
One misconception Henson clarifies is the talking point about which came first, “climate change” or “global warming.”
The history of the phrases “climate change” and “global warming” is much more interesting than Trump gives it credit for. Researchers were using climatic change or climate change as far back as the early 20th century when writing about events such as ice ages. Both terms can describe past, present, or future shifts—both natural and human-produced—on global, regional, or local scales.
Climate change is a general term that has applied over the years to many forms of climate change. Per the AMS Glossary:
It applies to both natural and human-caused changes (and “anthropogenic climate change” gets its own Glossary entry).
Obviously, the term still applies. So does “global warming.” In 2018 already, “global warming” is in the title of several scientific papers accepted to AMS journals.
Henson traces the first usage of “global warming”—a term specific to the observed climate trend—to a paper by Wallace Broecker in the 8 August 1975 issue of Science.
This may indeed be the first paper to apply “global warming” to a changed worldwide condition, via carbon dioxide release. Broecker was writing in anticipation of this trend becoming an observed fact, surpassing the then-prominent cooling influence of dust and pollutants as
the exponential rise in the atmospheric carbon dioxide content will tend to become a significant factor and by early in the next century will have driven the mean planetary temperature beyond the limits experienced during the last 1000 years
The idea that the Earth would warm as a whole, if not in every locale or region, was not new at the time of Broecker’s paper. In 1971, the National Academy of Sciences had included an objective to study the “effect of increasing carbon dioxide on surface temperatures” in its report, “The Atmospheric Sciences and Man’s Needs” (summed up by Robert Fleagle in BAMS that year).
The term “global warming” itself appears in AMS journals at least five years before Broecker’s paper. Jacques Dettwiller addressed the means of collecting long term global temperature records in the February 1970 Journal of Applied Meteorology. Lamenting the difficulty of separating out urban heat island effects, Dettwiller advocated monitoring deep soil temperatures, which seemed to “afford a means to monitor the global increase in temperature during the first half of the 20th century.”
For our purposes, it’s a landmark paper in the way Dettwiller cited a 1964 paper in Monthly Weather Review by Stanley Changnon that used such techniques in rural Urbana, Illinois: Changnon, wrote Dettwiller, “was able to discern values for global warming….”
At the time, the “current” term for global warming or anthropogenic climate change through the greenhouse effect was actually, ”Inadvertent Climate Modification.” That was the title of a 1971 report by an international group of climatologists convened by MIT and the Royal Swedish Academies for a “Study of Man’s Impact on Climate.” It was one of the first large consensus reports to warn of sea level rise, polar ice cap melt, major Arctic warming, and more.
After nearly a half century of highly prominent scientific warnings, a word was indeed dropped from the climate lexicon because it no longer made sense. That word was “inadvertent.”
The path from good science to good societal decisions is the central paradigm not only of the scientist’s perspective on how to impact the world, but also to the public’s faith in science itself. It also turns out to be a path of personal growth as well.
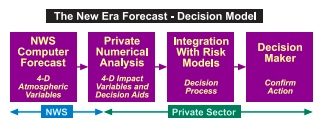
There’s a whole genre of attempts to depict these connections between science and its usage. One noteworthy example of such diagrams was published by the Bulletin of the American Meteorological Society back in 2002. John Dutton (now of Prescient Weather, Ltd.; then dean at Penn State University), saw a need to update the flow of scientific information from numerical models to decision makers. He recognized the increased use of computerized decision models that were interpreting scientific forecast input; he also wrote eloquently about the feedback and blurring between economic sectors, users, and scientists. Here’s what he came up with:
While Dutton’s focus was on expanding economic opportunity, he wrote with a palpable sense of inexorably widening horizons from that kernel of numerical weather modeling into all corners of societal activity: “Wider distribution leads to enhanced creativity and advancing capability as a thousand flowers bloom,” Dutton wrote.
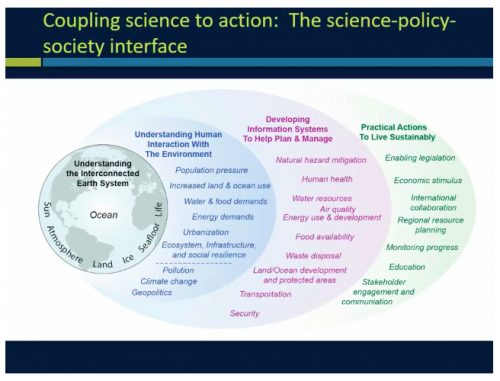
That same vision of the expansive horizons, all stemming from a mere act of meteorology, infused Susan Avery’s address to the AMS Student Conference in Austin this year. Only in this case, it is a parallel to Dutton’s economic view–a rippling from science to policy to society. In her talk, titled “Usable Science: Connecting Science to Action,” Avery, president emerita of Woods Hole Oceanographic Institute, depicted the pathway from science to society as a personal journey. Her ever-widening ellipses show an expansion of opportunities, knowledge, and horizons throughout a career as you move beyond the possibilities of a scientific education.
She explains:
Often those pathways, those learning opportunities, those experiences come about by the sciences themselves, and the evolution of the science. Believe it or not, the demands right now for you and predictive information—it’s not just about the weather forecast anymore.
I know this is the American Meteorological Society and everybody thinks it’s all about weather, but this Society itself, which has been an inspirational part of my personal and my professional growth, it also isn’t just about the weather anymore and the daily weather forecast.
I’d like you to think broadly as you go through your life and your career. Some of these learning experiences you might have will allow you to evolve your thinking in terms of what is knowledge of the atmosphere and how does it apply to something else other than the daily forecast.
Part of this idea of coupling science to use is associated with understanding the interdependency of what you’re trying to do and what you’re trying to solve. I like this diagram because—it looks kind of complicated—but it’s really the only one I can think of in trying to understand what is this connection between science, policy, society, and use.
First of all, the atmosphere is only one part of our planetary system. A lot of the atmospheric motions there are because of ocean-atmosphere interaction. You have to understand there’s an ocean driver there as well. When you worry about how that plays out in terms of people, you have to worry about where we live, on the land….A lot of atmospheric science departments today are really Earth system science departments. The science is pushing us that way.
If you want to apply that science to solving problems, it’s pretty important to understand what those problems are and the interdependencies particularly between the planet system and humans. So that second ellipse talks about those interdependencies—particularly population pressure, societal desires, and what that means in terms of consumption patterns, water use, energy use, where you live. We are a human forcing function on that planetary systems.
And so to the third ellipse and on to the last as the knowledge pushes us. Dr. Avery explained, “These are just some of the pathways that you might see yourself taking in the future.”
You now can hear Avery’s whole talk online.
This year’s AMS Annual Meeting provided no shortage of memorable presentations. The focus on 2017’s hurricanes in particular yielded some of the most memorable moments, and now you can listen (again, or for the first time) for yourself. Recorded presentations are being uploaded gradually to the AMS meeting program site.
Richard Alley’s speech at the Presidential Forum was the first to go online, here including AMS President Roger Wakimoto’s introduction as well as questions from the audience:
Here’s a portion of Dr. Alley’s memorable riff on our semi-aware relationship to the science and technology we carry around in our pockets every day:
I’m a Newtonian physicist. I didn’t take quantum, I didn’t take relativity. But my understand is that the nice lady in the (cell) phone using the GPS is using both general and special relativity. Because down here, she is deeper in Earth’s gravity well and she is moving slower than the clocks on the satellite. And the correction from relativity is about 10 km a day. And she can do 10 km pretty easily. Which means if she didn’t have relativity, she would get lost in about two minutes. And that’s … We get where we’re going not only because of quantum mechanics but also because of Einstein. And, no, she will not fall for you because she’s canoodling with Einstein in the phone here.
But you know how these things work. Right? … I’ve been working on ice since 1977, the summer after my freshman year. My teachers, in geology and other things, I think if you were to ask them what is the most useless and esoteric science you can think of, they might have said relativity and quantum mechanics. And you’ve got relativity and quantum mechanics in your phone, in your pocket, and you can’t really think of living the life you now live if we didn’t understand relativity and quantum mechanics….
Climate science is not this new-fangled stuff you’ve got in your cell phone … it’s been with us for a long time. But I can tell you, and some of you out there know this as well, that there are people—good people, neighbors, people who pay our salaries—who will pull out their cell phone and send me a note saying, ‘You’re an evil liar. You should be fired.’ They go to my president and try to get me fired. Because I’m talking about this global nonsense. ‘These scientists are just trying to take away our pickup trucks.’ And they do it with a cell phone. And they are, I think, all across the board, good people. Some of them have been misled. And that’s something we have to come back to.
Also online now are the talks from the web-streamed Presidential Town Hall on the hurricane season. Well worth a listen while you’re waiting for more talks to appear online, like this reaction to forecasting Hurricane Irma, from NBC-6 Miami Chief Meteorologist John Toohey-Morales:
In South Florida I’m known as the non-alarmist guy. I mean if you want a just-the-facts-and-he’s-not-at-all-that-excited-about-this-tropical-cyclone guy, I’m your person … But with Hurricane Irma … on Friday night … National Weather Service Key West … about to go into full-Katrina mode: catastrophic, life threatening, and those types of messages were about to go out … what does the non-alarmist guy do? (Plays video of his TV broadcast that Friday night.) ‘If you’re sitting on a Florida Key right now—What the heck are ya doing? Get out! Now!’
Or this zinger from FEMA’s Tony Robinson, while talking about Hurricane Harvey:
Working with our counterparts in the state of Louisiana a guy said, ‘I finally figured out your flood codes on when I should have flood insurance.’ And I said, ‘Oh, yeah? What’s that?’ He said, ‘Your driver’s license says Louisiana, you aughta have flood insurance.’ That’s a public service announcement right there. There’s 144 days to the start of the 2018 hurricane season.”
But it was Ada Monzon, WIPR TV/WKAQ Radio, San Juan, who drew a rare standing ovation after her heartfelt presentation on Hurricane Maria:
And I can tell you, that in my 30 years as a meteorologist in Puerto Rico, even going through Hugo and Georges and more than 10 other tropical storms … (I’m sorry) … For the first time in my life I was afraid. Not because of the wind or the storm surge or the rain. I was afraid [for] the future of Puerto Rico. … Still to this day there are great discrepancies on how many people died in Puerto Rico because of Maria. By government information, there were 64 dead. Our other entities have informed … of more than 1,000 dead. … The response and recovery efforts have been very slow and complicated. More than three months after the hurricane, near 45% of the island is still without power. Many are suffering. More than 100,000 people have left the island in the last three months, to Florida, New York, Texas. … Enduring two major hurricanes has been hard. But at the same time it has served a vast lesson to all our society: We need to find a way of living with natural disasters and other potential catastrophic events and we need to work harder as meteorologists and scientists to educate our public through all means of communication, especially social media.
 What can we expect? It is nearly indisputable that there will be hurricanes. NOAA’s
  There isn’t a way to tell yet what this year’s hurricanes will be like. But it’s another year into our warming world, and this is yet another study pointing to ominous changes with hurricanes in our future.