Highlights from the CoFU2 Study: Part 1
By Jeffrey K. Lazo, PhD
In 2006, I, my National Center for Atmospheric Research (NCAR) colleagues Julie Demuth and Rebecca Morss, and Alan Stewart of The University of Georgia began designing and implementing a national study of weather forecast users. We wanted to understand how people are getting their forecasts, how they’re using them, and how much they’re worth to people. 15 years after that study was published, I have released the follow-up study: Communicating Forecast Uncertainty (CoFU) 2. Using essentially the identical 2022 survey, I replicate and extend the findings from the first survey for another look at the public’s relationship with weather forecasts. We believe that our 2022 survey reached a more representative proportion of the U.S. population, including younger adults and certain racial groups, compared with the survey in 2006.
In this post–part one of two–I delve into a few of the key takeaways.
The big picture
This study estimates that members of the U.S. public access weather forecasts roughly 317 billion times per year—a 7.26% increase since 2006, driven largely by the increase in U.S. population. There was also a significant increase, however, in the number of survey respondents who said they never used weather forecasts. If this result is real, and not just an unusual result of the repeated survey implementation, it would be very important to understand why. Overall, people rated their satisfaction with weather forecasts high, but confidence in short-term (1-day) forecasts has decreased, while people were more confident in longer-term forecasts.
To get their forecasts, people continue to shift toward sources like web pages and cell phones, from which they specifically seek out weather information, rather than more “passive” sources such as TV and public/private radio broadcasts.
The estimated monetary value of forecasts to the U.S. public is $102.1 billion (which comes out to about 32 cents per forecast use). However, our approach to obtaining this value was limited, and we feel it should be used only as an estimate of the overall strength of people’s preferences for the information pending more rigorous studies.
Who’s using weather forecasts, and what for?
People with the following characteristics were more likely to say they used weather forecasts: Higher income, female, more highly educated, White, Black, Asian, Native, and those who spend leisure time outdoors.
The percentage of the surveyed population who said they never used weather forecasts increased from 3.62% in 2006 to 9.15% in 2022, a statistically significant difference. This was a basic yes/no question, so we don’t have good information about what people mean when they say they don’t use weather forecasts at all. It’s also possible that our latest survey did a better job of reaching people who don’t use weather forecasts. As noted above, if there has been a real decline in the number of people using forecasts this should be examined in more detail to determine why.
According to the survey, the most common reason people checked a forecast was simply to know what the weather would be like (they may be simply monitoring the weather in case their plans change or the weather shifts dramatically). The next most common uses were for weekend activities, getting dressed, social activities, and travel. Job-related activities and commuting ranked last.
How and where are people getting their forecasts?
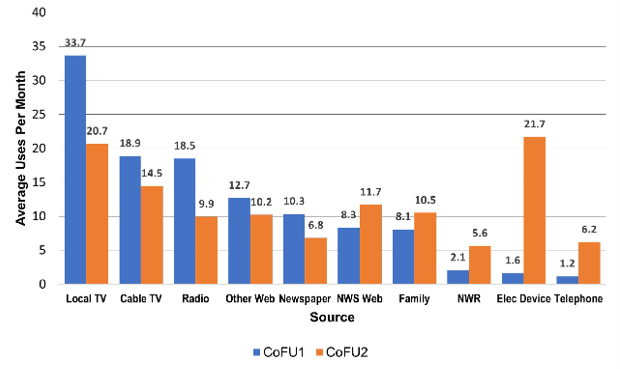
As shown in the figure below, usage of weather forecast sources such as TV, commercial and public radio, and newspapers has decreased since 2006. Notably, these are sources which tend to be more traditional and more “passive,” in that you may come across weather information without specifically looking for a forecast. Meanwhile, the use of more “modern” sources like NWS web pages, phones, and other electronic devices increased, along with the use of social connections and NOAA Weather Radio to find out about weather information. These days, people who use weather forecasts appear to be more likely to actively seek out this information.

Frequency of Use by Source by Survey Version
Notes: The survey question asked, “How often do you get weather forecasts from the sources listed below?” Response options ranged from “Rarely or never” to “Two or more times a day,” and were conservatively recoded into times per month. (CoFU1 n = 1,465; CoFU2 n = 1,092). Source: CoFU2, Figure ES-2.
The number of times that the average person accessed weather information each month slightly increased between 2006 (115.4) and 2022 (117.8), but the difference was not statistically significant. Time of forecast access has shifted slightly earlier in the day on average, which we suspect may be related to the shift away from TV forecasts, or possibly an increase in people who work from home since the onset of the COVID pandemic.
Tune in for part 2 of this summary to learn more about what people are looking for from weather forecasts, and how we arrived at an economic value for those forecasts. Or, you can read the full study here.
Photo at top: “Striking Sunset,” by Liz Kemp, was an entry in the 2023 AMS Weather Band Photo Contest.
