Highlights from the CoFU2 study: Part 2
By Jeffrey K. Lazo
This is part two of my summary of the Communicating Forecast Uncertainty (CoFU) 2 study, a follow-up (based on a 2022 national survey) to the 2009 CoFU 1 study that examines how the U.S. public gets, perceives, uses, and values weather forecasts. In part one we discussed key findings and delved a bit deeper into who uses forecasts the most, what they use forecasts for, and where they get their forecasts from. Read part 1 here.
In this post, we’ll examine public satisfaction with weather forecasts, what people most want from a forecast, and how much money the general public thinks a forecast is worth.
How satisfied are people with weather forecasts?
As shown below, people are more satisfied with weather forecasts than before. Overall, satisfaction with weather forecasts on average was 4.03 on a 5-point scale (significantly higher than the 3.78 average in 2006). People with higher education, Latinos, those who use city-specific weather forecasts, and those who access forecasts purely out of interest were more satisfied. People who spent more leisure time outside or used forecasts to plan social activities, however, were less satisfied.
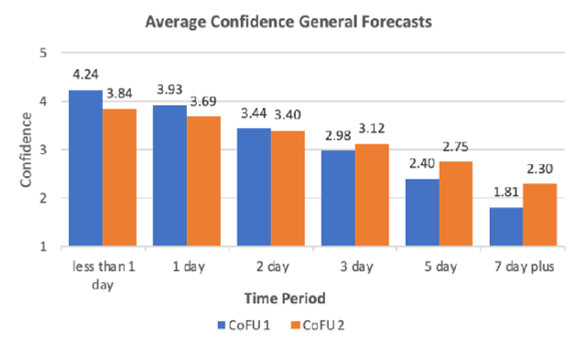
Interestingly, however, there has been a slight decrease when it comes to confidence in weather forecasts—specifically short-term (1-day) weather forecasts. Confidence in 3-day and longer forecasts increased between 2006 and 2022. We don’t know exactly why, and are curious to further explore this question. I am particularly interested in examining whether these changes in public perception actually track with differences in forecast performance.

Average Confidence in Forecasts by Time Period and Survey Version
Notes: The survey question asked, “How much confidence do you have in weather forecasts for the times listed below?” The times were listed as “Less than 1 day from now, “1 day from now,” and so on, out to “7 to 14 days from now.” (CoFU1 n = 1,465; CoFU2 n = 1,092). Source: CoFU2, Figure ES-5.
What weather factors matter most to people?
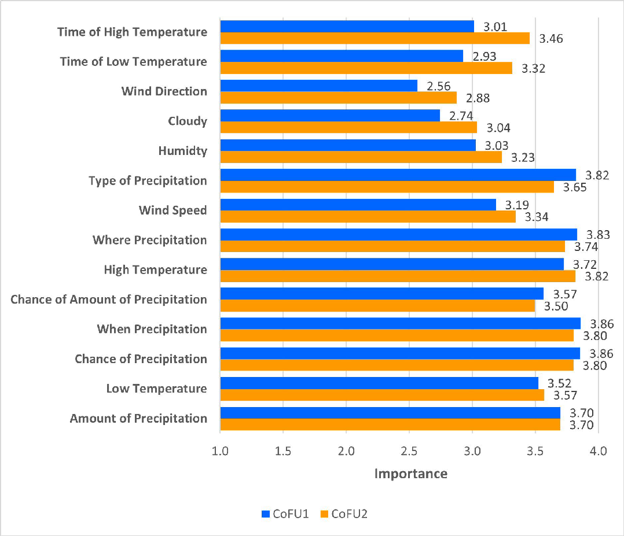
We asked survey respondents which components of a weather forecast were most important to them. In 2006, people most wanted to know when precipitation was going to occur. In 2022, however, high temperature took the top spot. This reflects an overall preference for precipitation information in 2006 vs. temperature information in 2022. That preference could be related to climate shifts, or it may simply be a reflection on when the surveys took place (November in 2006, May in 2022).

Mean Importance of Forecast Attributes Ranked by Difference between Surveys
Notes: The survey question asked, “How important is it to you to have the information listed below as part of a weather forecast?” (CoFU1 n = 1,465; CoFU2 n = 1,092). Source: CoFU2, Figure ES-7.
How do people value weather forecasts?
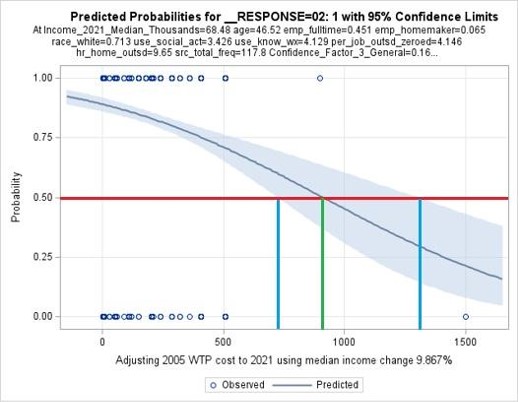
We assigned each respondent a dollar value that they might hypothetically pay in taxes each year to support NWS products and services (including forecasts). We then asked whether NWS services were worth that amount, worth more, or worth less. Using those responses, we calculated the likelihood of saying it was worth that amount for each dollar value, and then calculated the median willingness to pay for weather forecasts as $898.50, with a 95% confidence interval of approximately $700-$1,300 per household per year as shown below.

Fitted Demand Curve for Current Weather Forecast Information
Notes: The survey question asked “Do you feel that the services you receive from the activities of the NWS are worth more than, exactly, or less than $N a year to your household?” (CoFU2 data only n = 1,094). Source: CoFU2, Figure ES-10.
On average, people who were older, who were employed full time or were homemakers, who were white, who spent more recreational time outside, who used forecasts for social activities or just out of interest, and who highly valued knowing the daily high temperature were all less willing to pay for NWS forecasts. Those who spent more working time outside, used forecasts more frequently, placed more importance on NWS information, had more personal weather impacts, considered wind and cloud information more important, and who had greater total weather salience (a measure of attunement to and awareness of weather) were all more willing to pay for current forecasts. Related to the Cultural Theory of Risk, people who were identified as “individualists,” based on cultural risk theory, were significantly less likely to be willing to pay for forecasts. Individualists may perceive themselves to be less at risk from weather events.
If we can take the $898.50 median value as the average household willingness to pay, we can then aggregate this across the entire US population of about 120 million households. Accounting for the portion who say they don’t use forecasts, we calculate a total value to the US of about $102.1 billion for current weather forecast information.
Like any large-scale study of human beings, this analysis has tried to be as representative and accurate as possible—and yet almost certainly has potential gaps. Hopefully CoFU2 provides a useful picture of weather forecasts and the U.S. public, but its results should be replicated and further studied if they are to be used to inform any real-world decisions. Access to weather information can be a life-and-death matter, and no decision about that should be taken lightly. Read the full study here.
Photo at top: “Colorado Flakes,” by Henry Reges, was a finalist in the 2022 AMS Weather Band Photo Contest.
