NOAA released the 2010 edition of its annual State of the Climate report this week revealing that Earth’s atmospheric and oceanic temperatures are rising unabated. The 218-page report, consisting of the peer-reviewed conclusions of more than 350 researchers in 45 nations, will be distributed with the June issue of the Bulletin of the AMS.
A press briefing summarizing the report’s findings noted a “consistent and unmistakable signal from the top of the atmosphere to the bottom of the oceans” that the world continues to warm.
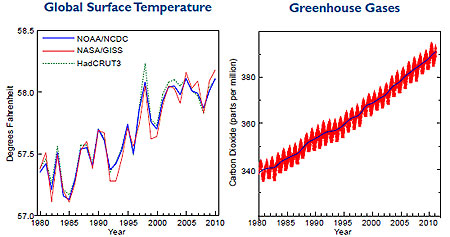
Those signals include last year’s global surface temperatures virtually tying 2005 as the warmest in the reliable global record, which dates to 1980. The Arctic warmed about twice as fast as the rest of the world, reducing sea ice extent to its third lowest level on record.

The area of Arctic sea ice was so small in September that for the first time in modern history both the Northwest Passage through northern Canada’s usually ice-bound islands as well as the Northern Sea Route along Russia’s northern coast were open for navigation.
Average sea surface temperatures (SSTs) worldwide were third warmest on record in 2010. This was despite a nearly 2°F SST drop since 2009 as major El Niño warming of the tropical Eastern Pacific during the first half of 2010 rapidly transitioned to a major La Niña cooling event.
Greenland’s ice sheet lost more mass in 2010 than in any year during the last decade. The melt rate was nearly 10 percent more than the previous record year for loss, 2007. Mountain glaciers globally lost mass for the 20th straight year.

Additionally, global ocean heat content last year was among the warmest on record, following the trend of 2009. Warmer oceans combined with glacial melting to increase average sea levels around the world.
Climate indicators tracked in the State of the Climate during 2010 also included precipitation, greenhouse gases, humidity, cloud cover and type, temperature and saltiness of the ocean, and snow cover.
The report indicated that the concentration of carbon dioxide continued to rise in 2010, surpassing 390 parts per million (ppm) for the first time. In 1979, the CO2 concentration reached 340 ppm.
The 2010 Climate Report also notes that the oceans were found to be saltier than usual in some areas, due to increased evaporation of the sea surface, and less salty, or “fresher,” than average where precipitation was more than is typical. Researchers conclude in the report that this is a sign that Earth’s water cycle is intensifying, which will lead to heavier rainfall and snow events worldwide.
Such events reached extremes in 2010, assisted in part by the transition to La Niña as well as an extraordinarily abnormal pressure anomaly in the northern Atlantic Ocean referred to as the North Atlantic Oscillation (NAO). Helping to create a blocking weather pattern over Greenland, and generating huge undulations in the jet stream, the NAO in early 2010 resulted in a lopsided winter in North America with warmer- and drier-than-usual weather in much of Canada and frigid and snowy weather in the Eastern third of the United States), and the coldest winter in more than 30 years in the United Kingdom.
While this blocking pattern eased its extreme grip across North America and Western Europe into summer, continued amplification of ridges and troughs downstream across Asia contributed to a searing summer heatwave in Russia and epic flooding in Pakistan. More than two months of above-average temperatures, including all-time record heat in Moscow, resulted in at least 14,000 heat-related deaths as well as choking wildfires. At the same time, extreme monsoon rains inundated a fifth of Pakistan, displacing more than 20 million people in normally fertile flood plains.
The year 2010 ended with unprecedented flooding across eastern Australia. The lingering La Niña pattern coupled with the enhancement in the water cycle led to the region’s wettest spring (September–November) since record keeping began 111 years ago. December precipitation in the state of Queensland was more than double the average amount, which led to massive flooding where entire geographical regions of the nation—not just cities and towns—were under water.
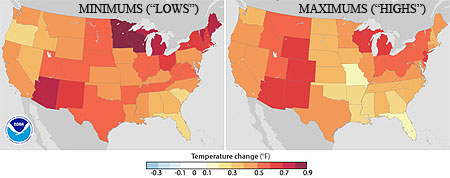
The overall consensus, especially when considering the dire predictions of an increasingly warmer world, is that the events and records of 2010 are the new normal on planet Earth. In one way, NOAA is confirming this today, releasing its new “climate normals” for temperature and precipitation for the United States, which serve to put into perspective current extremes based on the changing climate of the most-recent 30 years of data. The new climate “normals” valid for the period 1981-2010 have increased in temperature just as the State of the Climate has observed. Comparing the new temperature normals to those of the past decade—the period 1971-2000—shows they’ve increased by 0.5°F in that 10-year period over the United States.
“The [global] climate of the 2000s is about 1.5°F warmer than the 1970s, so we would expect the updated 30-year normals to be warmer,” NOAA National Climatic Data Center Director Thomas R. Karl says with regard to the new report.
