Hurricane Sally's Extreme Flood Potential

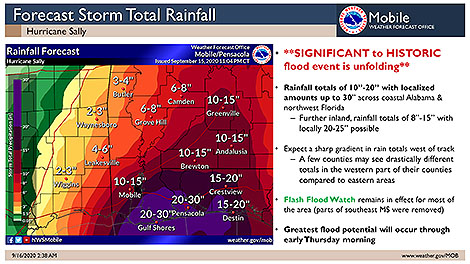
Hurricane Sally is inching ashore in southeast Alabama Wednesday morning and has started to flood parts of the central Gulf Coast with an expected 1-2 feet of rain, maybe more. With that much rain forecast, it seems likely to join other recent catastrophic flood disasters Harvey (2017) and Florence (2018) in ushering in a new era of rainier storms at landfall that bring with them an extreme rain and flooding threat.
Sally_rainfall-3
Recent research by NOAA’s Tom Knutson and a team of tropical weather and climate experts in the March Bulletin of the American Meteorological Society and blogged about here determined with medium-to-high confidence that more and more hurricanes in our future warming world will be wetter at landfall.
And with more wetter storms on the way, better communication about these potentially deadly impacts from copious rainfall is needed. Another BAMS article we blogged about addressed this by creating an Intuitive Metric for Deadly Tropical Cyclone Rains. Its authors designed the new tool—the extreme rainfall multiplier (ERM)—to easily understand the magnitude of life-threatening extreme rain events.
Co-author James Kossin explained to BAMS:

Water presents a much greater hazard in a hurricane than wind does, but the Saffir-Simpson categories are based on wind-speed alone. Salt-water hazards along and near the coast are caused by storm surge. Coastal residents are warned about these hazards and are provided with evacuation plans. Fresh-water flooding from extreme hurricane rainfall, however, can happen inland away from evacuation zones, and pose the greatest threat to life and property in these areas where people tend to shelter-in-place. Compound hazards such as dam failures and land-slides in mountainous regions pose additional significant threats. In this case, effective warnings and communication of the threats to inland populations is paramount to reduce mortality. This work strives to present a tool for providing warnings based on people’s past experience, which gives them a familiar reference point from which to assess their risk and make informed decisions.

Lead author Christopher Bosma:

We started out this project focused on analyzing the catastrophic and record-breaking rainfall associated with Hurricane Harvey. But, as we started to finish our analysis of that system, just a year later, Hurricane Florence brought devastating and torrential rainfall to the Carolinas, which forced us to go back and revisit some of our initial analysis. The fact that multiple major storms happened in quick succession grabbed a lot of headlines, but, from a research and scientific perspective, it also provided a chance to note how the messaging used to describe these systems had changed (or not) and think of other ways to use the metric we had developed.

ERM is not yet operational, but that is the researchers’ goal, to “convey effective warnings to people about fresh-water flooding threats,” Kossin says.
Hurricane Sally is one such extreme rainfall flood threat, with “significant to historic flooding” likely, the National Weather Service says.
Hurricane Sally’s Extreme Flood Potential

Hurricane Sally is inching ashore in southeast Alabama Wednesday morning and has started to flood parts of the central Gulf Coast with an expected 1-2 feet of rain, maybe more. With that much rain forecast, it seems likely to join other recent catastrophic flood disasters Harvey (2017) and Florence (2018) in ushering in a new era of rainier storms at landfall that bring with them an extreme rain and flooding threat.

Sally_rainfall-3

Recent research by NOAA’s Tom Knutson and a team of tropical weather and climate experts in the March Bulletin of the American Meteorological Society and blogged about here determined with medium-to-high confidence that more and more hurricanes in our future warming world will be wetter at landfall.

And with more wetter storms on the way, better communication about these potentially deadly impacts from copious rainfall is needed. Another BAMS article we blogged about addressed this by creating an Intuitive Metric for Deadly Tropical Cyclone Rains. Its authors designed the new tool—the extreme rainfall multiplier (ERM)—to easily understand the magnitude of life-threatening extreme rain events.

Co-author James Kossin explained to BAMS:

Water presents a much greater hazard in a hurricane than wind does, but the Saffir-Simpson categories are based on wind-speed alone. Salt-water hazards along and near the coast are caused by storm surge. Coastal residents are warned about these hazards and are provided with evacuation plans. Fresh-water flooding from extreme hurricane rainfall, however, can happen inland away from evacuation zones, and pose the greatest threat to life and property in these areas where people tend to shelter-in-place. Compound hazards such as dam failures and land-slides in mountainous regions pose additional significant threats. In this case, effective warnings and communication of the threats to inland populations is paramount to reduce mortality. This work strives to present a tool for providing warnings based on people’s past experience, which gives them a familiar reference point from which to assess their risk and make informed decisions.

Lead author Christopher Bosma:

We started out this project focused on analyzing the catastrophic and record-breaking rainfall associated with Hurricane Harvey. But, as we started to finish our analysis of that system, just a year later, Hurricane Florence brought devastating and torrential rainfall to the Carolinas, which forced us to go back and revisit some of our initial analysis. The fact that multiple major storms happened in quick succession grabbed a lot of headlines, but, from a research and scientific perspective, it also provided a chance to note how the messaging used to describe these systems had changed (or not) and think of other ways to use the metric we had developed.

ERM is not yet operational, but that is the researchers’ goal, to “convey effective warnings to people about fresh-water flooding threats,” Kossin says.

Hurricane Sally is one such extreme rainfall flood threat, with “significant to historic flooding” likely, the National Weather Service says.

Keeping Score When Temperature Records Are the Expectation

Through July, 2020 has been on almost the same track as 2016: the two years had the hottest first seven months in NOAA’s 141 year dataset of global surface temperatures (land and ocean combined). Since 2016 turned out to be the hottest year on record, it might seem as if this fast start puts 2020 on track to set a new record, too, or to be a near miss. NOAA says it’s already “very likely” 2020 will be among the five hottest years on record.

But in the strange reality of ever rising global temperatures, it’s not so much the first half of the year that puts 2020 on the verge of a record. It’s the underlying trend of warming: 2020 was already on the verge on New Year’s Day.

As the new State of the Climate in 2019 released last week points out, the six hottest years in the last century and a half were…exactly the last six years, 2014-2019. Due to global warming, practically every year’s surface temperature is going to be a hot one. Just by showing up at the starting line, every year is a serious threat to set a new standard.

A paper recently published in the Bulletin of the American Meteorological Society puts this relentless streak of rising temperature expectations in terms of probabilities. There’s a greater than a 99% chance that most of the next 10 years through 2028 will be ranked among the top 10 warmest.

The study, by Anthony Arguez (NOAA/NCEI) et al. also finds an 82% chance that all years in the next decade will rank in the top 15 warmest years as global warming continues. Its authors suggest that record warm years are already “baked into the cake” of Earth’s global climate and that it would take “an abrupt climate shift for even a few years within the next decade to register outside the top 10 warmest years.”

To determine these odds, the researchers analyzed the monthly version of NOAA’s Merged Land Ocean Global Surface Temperature Analysis Dataset (NOAAGlobalTemp) to project annual global temperature rankings in the future. The ever-shifting expectations for global temperatures render the usual way of keeping tabs on the data—by comparing to 30-year normals—inadequate. So Arguez et al. formulated a new way to compare each year to surrounding years:

We introduce a “temperature score”  to help NOAA communicate the coolness or warmth of a given year relative to the long-term trend. We believe this is the first such projected ranking and temperature score currently produced operationally. Our objective is to use this tool to improve the communication of climate change impacts to the general public.

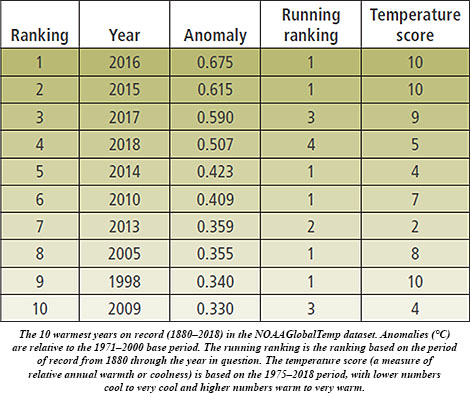
Top 10The temperature score from 1 (a very cold year) to 10 (very warm) is useful to distinguish between warmer and colder years relative to the long-term trend. As examples, the authors note that 2008 and 2011 were considerably cooler than surrounding years and below the overall trend, whereas 1998 and 2016 were not only the warmest years on record but were also notably warmer than surrounding years.
The study only includes average annual global temperatures through 2018. But as reported in the annual State of the Climate, 2019 ranks as the second or third warmest year on record (depending on your favored dataset), adding another year to the recent string of those warmer than any years back to the mid 1800s. The report notes that each successive decade since 1980 has been warmer than the previous. Arguez’ research suggests that not only will this continue but it will worsen dramatically.

This is a testament to the exceptional warmth experienced over the last few decades, punctuated by the last [5] years [2015–19], which have separated themselves from “the pack.”

We asked Arguez a few questions (more found in the latest print/digital issue of BAMS) about this work as well as about his background and what sparked his interest in meteorology.

Anthony_ArguezBAMS: What would you like readers to learn from your study of record global temperatures?
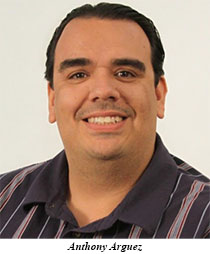
Anthony Arguez: I would like the general public to know that there is not a great deal of suspense that most years—if not all—over the next decade will likely register as top 10 years. In fact, the data suggest we should expect this, as it would likely take a pretty abrupt change to get us off this trajectory.

BAMS: How did you become interested in finding new ways to analyze the global temperatures and their trend?

AA: I feel like I’ve been staring at the annual global temperature time series continually over the past 15 years or so because it is just so interesting in many ways. I find it challenging and rewarding to develop methods to translate volumes of data into answers to specific questions posed by the general public. I’ve drawn inspiration from Nate Silver, whose penchant for expounding on and communicating the “signal” hidden in the “noise” informs the way I would like to see myself and fellow climate scientists communicate to the general public more effectively.

BAMS: What surprised you most in doing this work?

AA: I was very surprised that the ranking errors we found were so small! Before calculating the results, I had a gut feeling that these errors would be modest, but the mean absolute ranking error of ~2 spots a full 10 years out was well below anything I could have imagined. I clearly under-appreciated the predictability inherent in the observed upward trend when it comes to annual global temperature rankings.

BAMS: What was the biggest challenge?

AA: I think the biggest challenge we faced was that we were not aware of any similar operational products in existence (neither for projected rankings or global annual temperature scores), or of any papers that had characterized ranking errors in a similar fashion, so we were in uncharted territory to some extent.

BAMS: This isn’t the biggest climate challenge, or surprise, you’ve ever faced…

AA: I became interested in meteorology as a teenager in 1992 when Hurricane Andrew totaled my parents’ home in Miami, Florida.


When Hurricanes Become Machines…or Monsters

Officially, the Atlantic season is almost upon us. The season of tropical storms and hurricanes, yes, but more to the point, the season of heat-seeking machines and relentless monsters.

At least, that’s the metaphorical language of broadcast meteorologists when confronted with catastrophic threats like Hurricane Harvey in Houston in 2017. A new analysis in BAMS of the figures of speech used by KHOU-TV meteorologists to convey the dangers of this record storm shows how these risk communicators exercised great verbal skill to not only connect with viewers’ emotions, but also convey essential understanding in a time of urgent need.

For their recently released paper, Robert Prestley (Univ. of Kentucky) and co-authors selected from the CBS-affiliate’s live broadcasts during Harvey’s onslaught the more than six hours of on-air time for the station’s four meteorologists. The words the meteorologists used were coded and systematically analyzed and categorized in a partly automated, partly by-hand process. No mere “intermediaries” between weather service warnings and the public, the meteorologists—David Paul, Chita Craft, Brooks Garner, and Blake Matthews—relied on “figurative and intense language” on-air to “express their concern and disbelief” as well as explain risks.

As monster, the hurricane frequently displayed gargantuan appetite—for example, “just sitting and spinning and grabbing moisture from off the Gulf of Mexico and pulling it up,” in Paul’s words. The storm was reaching for its “food,” or moisture. The authors write, “The use of the term ‘feeder bands’…fed into this analogy.” Eventually Matthews straight out said, “We’re dealing with a monster” and Craft called the disaster a “beast.”

When the metaphor shifted to machines, Harvey was like a battery “recharging” with Gulf moisture and heat or a combustion engine tending to “blow” up or “explode.” Paul noted the lingering storm was “put in park with the engine revving.”

Other figurative language was prominent. Garner explained how atmospheric factors could “wring out that wet washcloth” and that the saturated ground was like “pudding putty, Jello.” The storm was often compared to a tall layered cake, which at one point Garner noted was tipped over like the Leaning Tower of Pisa.

In conveying impact risks, the KHOU team resorted frequently to words like “incredible” and “tremendous.” To create a frame of reference, they initially referred to local experience, like “Allison 2.0”—referring to the flood disaster caused by a “mere” tropical storm in 2001 that deluged the Houston area with three feet of rain—until Harvey was clearly beyond such a frame of reference. Then they clarified the unprecedented nature of threats, that it would be a storm “you can tell your kids about.”

The authors note, “By using figurative language to help viewers make sense of the storm, the meteorologists fulfilled the “storyteller” role that broadcast meteorologists often play during hurricanes. They were able to weave these explanations together with contextual information from their community in an unscripted, ‘off-the-cuff’ live broadcast environment.” They conclude that the KHOU team’s word choices could “be added to a lexicon of rhetorical language in broadcast meteorology” and serve as a “a toolkit of language strategies” for broadcast meteorologists to use in times of extreme weather.

Of course all of this colorful language was, perhaps, not just good science communication but also personal reality. Prestley et al. note: “The KHOU meteorologists also faced personal challenges, such as sleep deprivation, anxiety about the safety of their families, and the flooding of their studio. The flood eventually forced the meteorologists to broadcast out of a makeshift studio in a second-floor conference room before evacuating their building and going off air.”

As water entered the building, Matthews told viewers, “There are certain things in life you think you’ll never see. And then here it is. It’s happening right now.”

The new BAMS article is open access, now in early online release.


Is It Just Us…or Was That the BBQ Talking?

So many conversations at the 2018 AMS Annual Meeting started–and ended–on the same note, and Dakota Smith captures it just right in his “Weather Nerds Assemble” vlog:

Communication is a huge aspect in this field….If a forecast is a hundred percent accurate, but no one understands it, it’s not a useful forecast. That in a nutshell was what this meeting was about.

According to Smith, all that geeked out conversation amongst 4,200 weather, water, and climate nerds added up to at least these four lessons:

  1. The future is bright: “I talked with so many intelligent, bright, passionate students who are bound to make an impact on our community. Keep up the grind!”
  2. Meteorologists are incredibly strong: The communications workshop reflecting on the experience of Harvey, Irma, and Maria showed that  “meteorologists across the country used…love and passion to fuel them through this relentless hurricane season.”
  3. Austin has incredible BBQ.
  4. Meteorologists are awesome. “I already knew this before…we love weather, and we love science!”

The last two are obvious, right? The first two make our day. Share your own take-away points; meanwhile, you owe yourself the injection of enthusiasm–just in case you got lost in the trees since returning home:


With Floods or Baseball, It's a Game of Percentages

Perhaps no one thought that Game 5 of the World Series would end the way it did. It started with two of the game’s best pitchers facing off; a low-scoring duel seemed likely. But the hitters gained the upper hand. In the extra-inning slugfest the score climbed to 13-12.
If you started that game thinking every at-bat was a potential strike-out, and ended the game thinking every at-bat was a potential home run, then you’ll understand the findings about human expectations demonstrated in a new study in the AMS journal, Weather, Climate and Society. University of Washington researchers Margaret Grounds, Jared LeClerc, and Susan Joslyn shed light on the way our shifting expectations of flood frequency are based on recent events.
There are two common ways to quantify the likelihood of flooding. One is to give a “return period,” which tells (usually in years) how often a flood (or a greater magnitude flood) occurs in the historical record. It is an “average recurrence interval,” not a consistent pattern. The University of Washington authors note that a return period “almost invites this misinterpretation.” Too many people believe a 10-year return period means flooding happens on schedule, every 10 years, or that in every 10-year period, there will be one flood that meets or exceeds that water level.
Grounds et al. write:

This misinterpretation may create what we refer to as a ‘‘flood is due’’ effect. People may think that floods are more likely if a flood has not occurred in a span of time approaching the return period. Conversely, if a flood of that magnitude has just occurred, people may think the likelihood of another similar flood is less than what is intended by the expression.

In reality, floods that great can happen more frequently, or less frequently, over a short set of return periods. But in the long haul, the average time between floods of that magnitude or greater will be 10 years.
One might think the second common method of communicating about floods corrects for this problem. That is to give something like a batting average–a statistical probability that a flood exceeding a named threshold will occur in any given time period (usually a year). Based on the same numbers as a return period, this statistic helps convey the idea that, in any given year, a flood “might” occur. A 100-year return period would look like a 1% chance of a flood in any given year.
Grounds and her colleagues, however, found that people have variable expectations due to recent experience, despite the numbers. The “flood is due” effect is remarkably resilient.
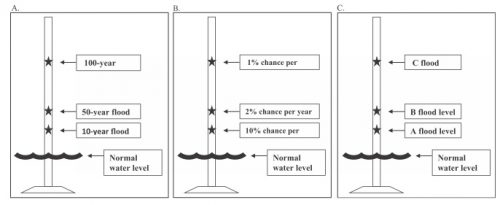
The researchers surveyed 243 college students. Each student was shown just one of the three panels below of flood information for a hypothetical creek in the American West:
FloodBlog1
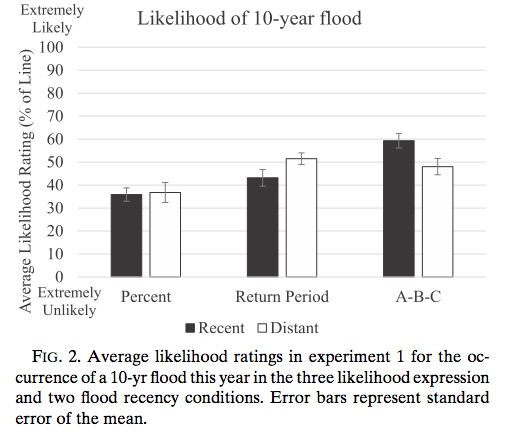
Each panel showed a different method of labeling flooding (panel A showed return periods; panel B percent chance of flooding; panel C had no quantification, marking levels A-B-C). The group for each panel was further subdivided into two subgroups: one subgroup was told a flood at the 10-year (or 10% or “A”) marker had occurred last year; the other subgroup was told such a flood last occurred 10 years ago. This fact affected the students’ assessment of the relative likelihood of another flood soon (they marked these assessments proportionally, on an unlabeled number line, which the researchers translated into probabilities).
Floodblog2
Notice, the group on the right, who did not deal with quantified risks (merely A-B-C), assessed a higher imminent threat if a flood had occurred last year. This “persistence” effect is as if a home run last inning made another home run seem more likely this inning. The opposite, “flood due” effect, appeared as expected for the group evaluating return period statistics. Participants dealing with percentage chances of floods were least prone to either effect.
This test gave participants a visualization, and also did not quantify water levels. Researchers realized both conditions might have thrown them a curve ball, skewing results, so the researchers tried another survey with 803 people (gathered through Amazon.com) to control test conditions. The same pattern emerged: an even bigger flood-is-due effect in the group evaluating return-period, a bigger persistence effect in the group with unquantified risks, and neither bias in the group assessing percentage risks.
In general, that A-B-C (“unquantified”) group again showed the highest estimation of flood risk. The group with percentage risk information showed the least overestimation of risk, but still tended to exaggerate this risk on the scales they marked.
Throughout the tests, the researchers had subjects rank their concern for the hypothetical flood-prone residents because flood communication stops not at understanding, but at concern that motivates a response. Grounds et al. conclude:

Although percent chance is often thought to be a confusing form of likelihood expression…the evidence reported here suggests that this format conveys the intended likelihood information, without a significant loss in concern, better than the return period or omitting likelihood information altogether.

How concerned these participants felt watching the flood of hits in the World Series…well, that depended on which team they were rooting for.
 

Naming Winter Storms: Time for Community Cooperation

by Mary M. Glackin, Senior Vice President, Public-Private Partnerships, The Weather Company
Forecasts of hazardous weather have continually improved, particularly over the past few decades. It is oft-cited fact that 5-day forecasts are now as good as 3-day forecasts were 20 years ago. At the same time, the public has more choices than ever in how it accesses weather information. In particular, we are seeing explosive growth in the web, apps, and social media outlets such as Facebook and Twitter. Yet in the aftermath of a severe event, it is common to hear, “I didn’t know” either from public officials or the public at large.
It is this latter issue that the United Kingdom’s Met Office and the Irish Meteorological Service (Met Éireann) were seeking to address when they recently announced their plans to name storms this fall and winter. And to kick the campaign off, they are soliciting the public’s help in picking the names. After watching other country’s experiences, they believe naming significant storms will increase public awareness of severe weather and thus improve appropriate responses to warnings.
Several European countries name winter storms. For example, the Free University of Berlin’s meteorological institute has been naming them since the 1950s, and these names are adopted and used by the media and the German Met Service, Deutscher Wetterdienst. In the U.S. and elsewhere, very impactful storms become named by the media; think Snowmageddon in the Northeast (2010) and St. Jude Storm in the U.K. (2013). In the U.S., The Weather Company (TWC) began naming winter storms in 2012-13, citing the importance of communicating in social media–especially Twitter, which requires a hashtag. Rightly or wrongly, this effort was roundly criticized as having suspect science and for being a marketing ploy.
After three years experience at TWC, here is what we can report: Twitter alone provides an incredible reach where we routinely see more than one billion people receiving tweets using the storm name. Millions of tweets are sent using the hashtag from government agencies, school districts, utilities, businesses, and the general public. These hashtags also allow the NWS and others to find real-time weather data tweeted by citizens that can be used in nowcasts and other storm reports.
The criteria to name a storm are pretty simple: it must meet the National Weather Service winter-storm warning criteria, and it must be expected to impact at least two million people and/or 400,000 sq. km. We use a formal process and a committee of three meteorologists to review these criteria for each possible storm, and while we consider the criteria strict, the storm-naming committee still reserves the right to override the quantitative decision in certain circumstances. Some of the factors that may influence decisions to override the naming rules include the degree of historical significance of the event (e.g., accumulating snow in South Florida, a summer-season snowstorm, etc.); see more details here.  The U.K. is planning a similar system using their two highest warning levels, so names are only applied to the storms that present a significant threat.
What’s in a name? Well in this case, the name is the headline to attract attention to the threat. It is the beginning. It needs to be backed up with easy-to-understand information that details the threat to a specific locale and appropriate call-to-action statements. But, in this information-saturated world, this headline/hashtag is key. We need to recognize the importance of serving people in the way they find easiest to consume information vs. how we are most comfortable in delivering it.
Could we take this U.K./Ireland announcement as a call to the U.S. weather enterprise to come together to see how we could maximize the use of social media to improve the public response to severe weather events?  Twitter is here to stay, and it requires hashtags to separate the relevant information from an avalanche of incoming data. Hashtags are spilling over into other social media as well. It is easy to create a hashtag from a tropical storm name. If we could come together as a community to address this for winter storms, we’d no doubt learn a lot that could then be applied to significant weather at the local scale. The nomenclature could be something much different than what’s used in tropical storms or what we have been using.
What’s important is to lead as a community in this social media era. For our part, we are willing to share our experiences, transition our system, and/or help set up an enterprise-wide naming system. During major snow events, the reach on Twitter has been over a billion. What would our reach be with all of us working together feeding into the same system to keep people informed during these hazardous events? Are we ready to re-engage on this topic as a community?


Summer Meeting Leads to Summer Tweeting

A primary focus of this week’s AMS Summer Community meeting in Raleigh, NC, has been communication, particularly about how best to present information on weather, water, and climate threats to the public. So it’s not surprising that the meeting has generated plenty of activity on Twitter. Here are a few of the highlights:

Twitter Abuzz during Extreme Precipitation Hangout

Last week’s Google hangout on extreme precipitation touched on a number of different topics related to preparing for extreme weather events and the larger goal of building a Weather-Ready Nation. It’s noteworthy that one of the key themes that recurred throughout the hangout was “communication,” as a healthy discussion was evident on Twitter during the event. We’ve captured some of the highlights here, just below the full video of the hangout.


AMS Summer Community Meeting

by Tom Champoux, AMS Director of Communications
Recently, severe thunderstorms rolled east across the greater Boston area that culminated in an EF2 tornado touching down in the city of Revere, just a few miles from my house.
As I watched the weather on TV that day, I noticed some new information provided by the meteorologist as he gave his severe weather updates. Not only did he show the storm’s path, size, speed, intensity, and time of arrival, but he also included the number of people who were in the line of the storm’s path – in this case more than 200,000 would be affected.
This drive to continually innovate the flow of information to the public—refreshing, improving, and updating services in the process—is ingrained in the character of our weather, water, and climate community. It’s a process driven by AMS members across the enterprise.
I was reminded of this repeatedly while attending the AMS Summer Community Meeting this week in State College, Pennsylvania. This year, the theme was “Improving Weather Forecasts and Forecast Communications.” More than 160 attendees from across the country, including leaders in government, academic, and private sectors, convened to discuss, collaborate, and consider ways of improving weather data being collected, retrieving usable information more quickly, and sharing the most accurate information with the public as quickly as possible. In extreme cases, people have to make critical decisions in a matter of minutes.
Discussions focused on how to better inform the public, ensuring their awareness and safety while decreasing false-alarm rates. During the meetings, it became apparent very quickly how important this topic is to the entire weather, water, and climate community, and that hosting these meetings is a vital step for AMS as we bring together key stakeholders to continue improving all aspects of the enterprise. This year’s AMS Summer Community Meeting not only included well-known weather agencies, organizations, and companies but also social scientists, emergency managers, risk analysts, educators, big data specialists, and broadcast meteorologists.
Discussions covered a wide variety of topics such as public perceptions of words like “likely,” “probable,” “possible,” and “certain,” to describe potential weather. Other panel talks included, “Improving Communicating of Forecast Uncertainty,” Communicating Forecast Confidence,” “Conveying Weather Risk,” and “The Weather Enterprise of the Future.” There were also talks about how various social media may hurt or help communicating accurate information.
A tour of AccuWeather Forecast Center headquarters here during the meetings showed how important these issues are to the entire company. I was impressed with their efforts to improve technology, data collection, analysis, and communications. Similarly, National Weather Services Director Louis Uccellini was on hand to talk about what the NWS is doing to address these issues.
The AMS Summer Community Meeting is unique because of the ideas that emerge there. It also is a reminder of how vital it is to bring everyone together. Ideas, information, and experiences are shared freely, and the conversations both inside and outside the meetings remind us all how committed everyone is to constantly improving the entire enterprise, whether they’re doing it independently in their separate jobs, like my local weathercaster, or together in valuable gatherings like the AMS Summer Community Meeting.